Download to read offline
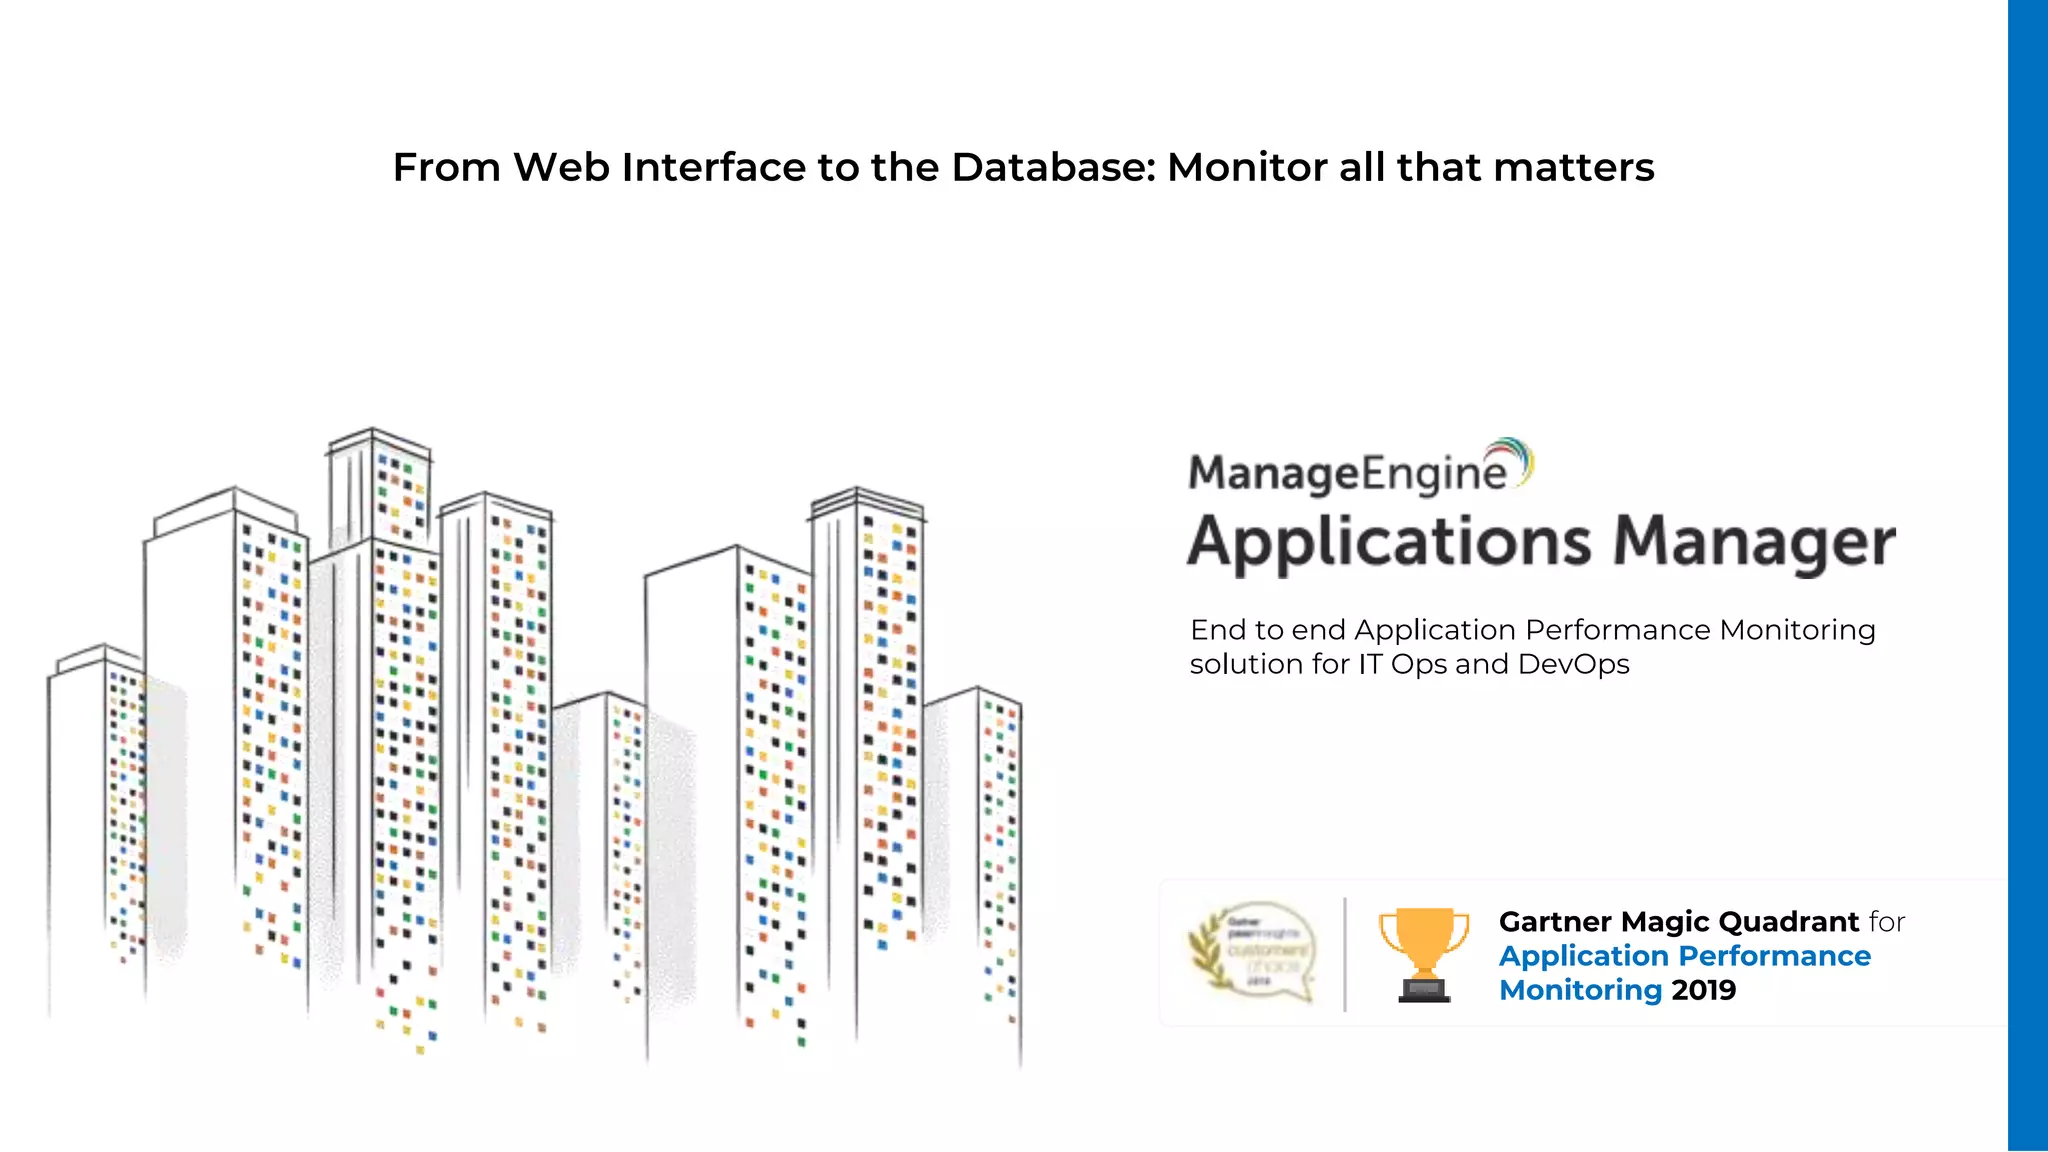
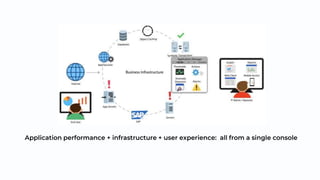
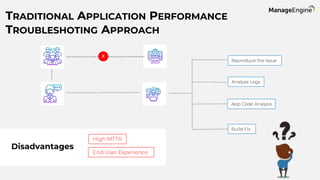
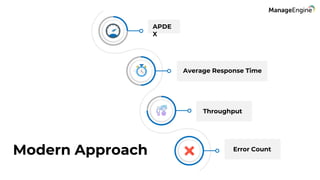
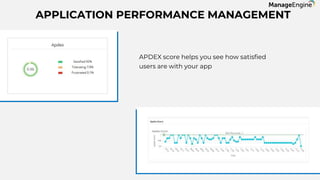
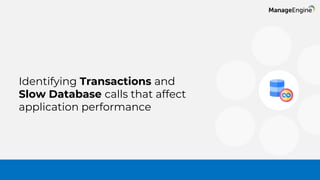
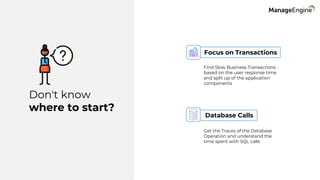

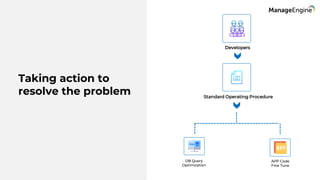
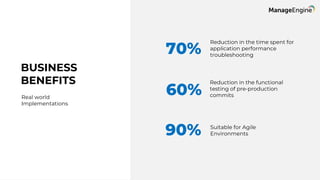
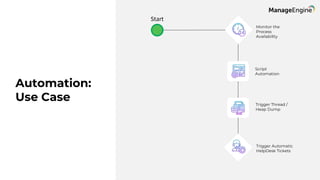
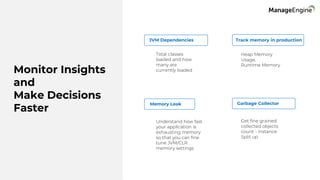
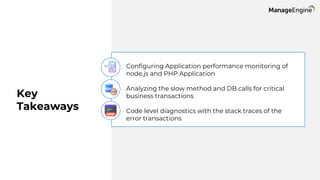

The document discusses an end-to-end application performance monitoring solution that integrates various aspects of performance, including application, infrastructure, and user experience. It outlines the challenges faced in traditional application performance troubleshooting and highlights the benefits of modern approaches that provide code-level visibility and quicker resolutions. The solution emphasizes optimizing database calls, error trace analysis, and ensuring high availability of applications while reducing resource costs.


![Server and application monitoring webinars [Applications Manager] - Part 2](https://cdn.slidesharecdn.com/ss_thumbnails/serverandapplicationmonitoringwebinars-part1-applicationsmanager-180614115127-thumbnail.jpg?width=640&height=640&fit=bounds)
![Server and application monitoring webinars [Applications Manager] - Part 3](https://cdn.slidesharecdn.com/ss_thumbnails/part3optimizeapplicationperformance-180621111200-thumbnail.jpg?width=640&height=640&fit=bounds)


![[Collinge] Office 365 Enterprise Network Connectivity Using Published Office ...](https://cdn.slidesharecdn.com/ss_thumbnails/ecs18paulcollingeoffice365enterprisenetworkconnectivityusingpublishedoffice365urlsips-180618091153-thumbnail.jpg?width=640&height=640&fit=bounds)