Download to read offline


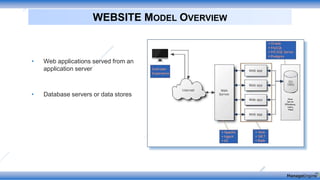
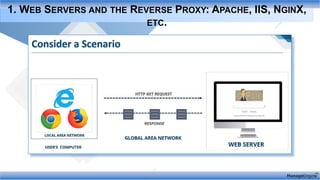
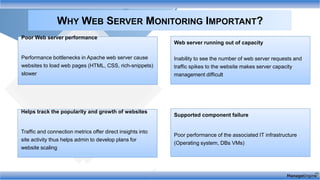
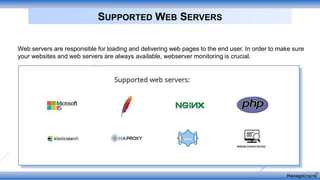
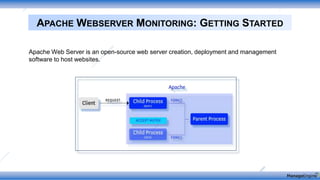

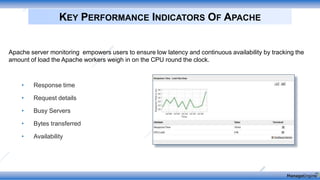
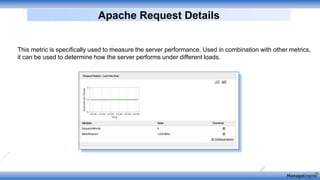
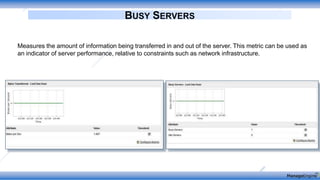
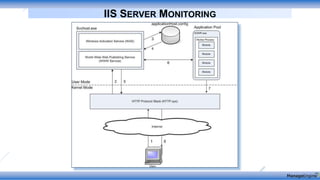
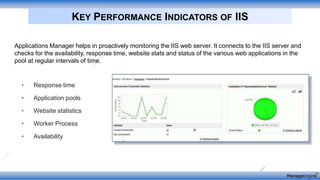
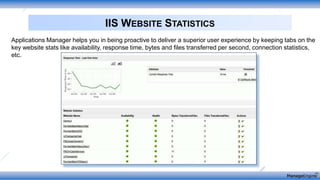
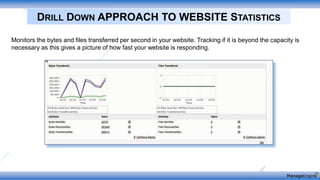
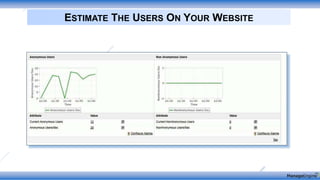
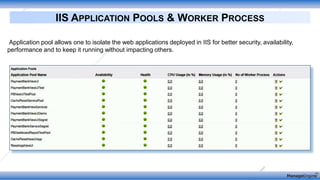
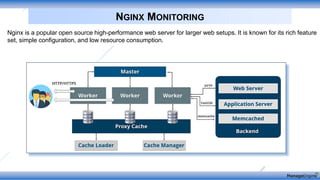
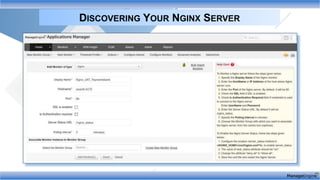
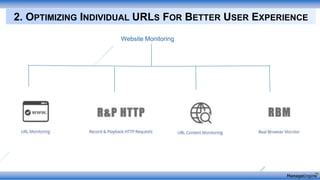
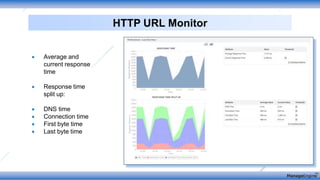
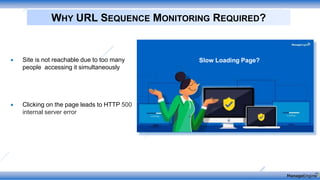
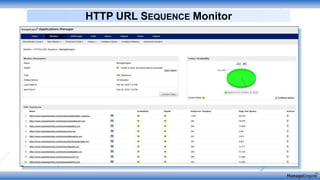
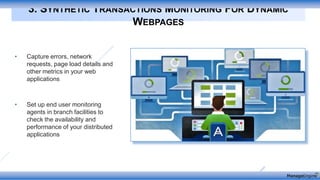
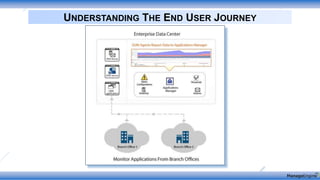
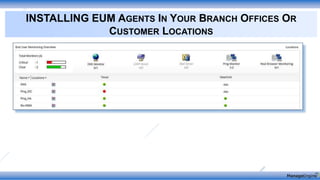
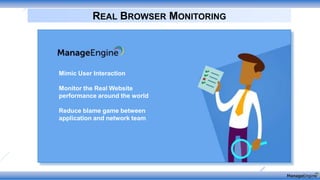
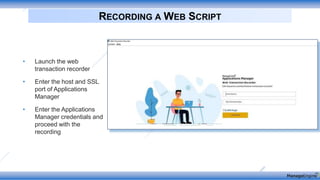
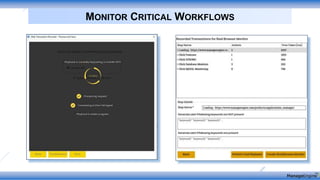
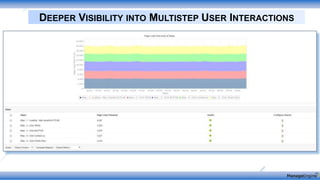
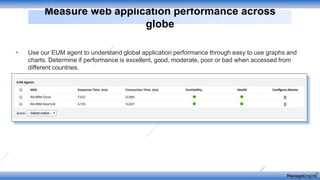
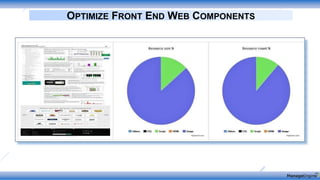
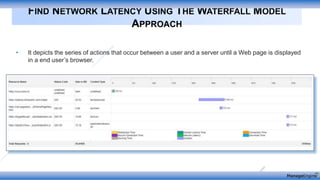
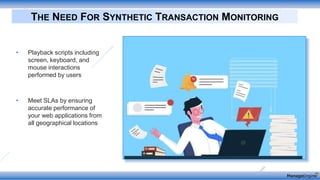
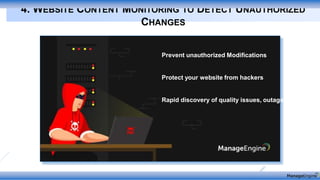
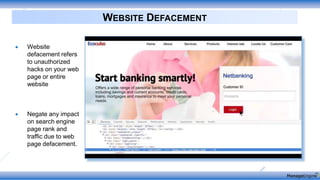
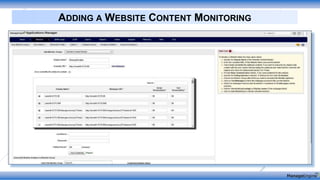
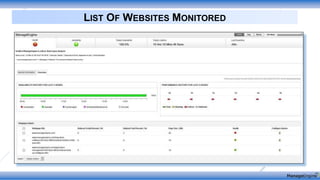
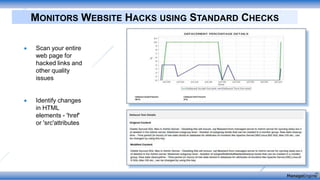


This document discusses website monitoring strategies including tracking key metrics of web servers like Apache, IIS and Nginx; optimizing individual URLs for user experience; using synthetic monitoring to simulate web transactions; and detecting unauthorized content changes. It provides overviews of monitoring various web servers and their key performance indicators. It also describes optimizing the user experience by monitoring URL sequences, implementing real browser monitoring, and using web transaction recording. Finally, it discusses monitoring website content to detect hacks and defacement.