Downloaded 152 times


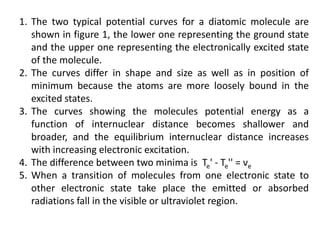


1. Electronic spectroscopy relies on quantized energy states of electrons. Absorption of photons promotes electrons to excited states, and fluorescence occurs when electrons return to lower states. 2. Molecular electronic spectra involve changes in electronic, vibrational, and rotational energies of molecules. They appear in the visible and ultraviolet regions. 3. Potential energy curves describe different electronic states of diatomic molecules. Transitions between states emit or absorb radiation and give rise to band systems consisting of vibrational and rotational transitions within those bands.


