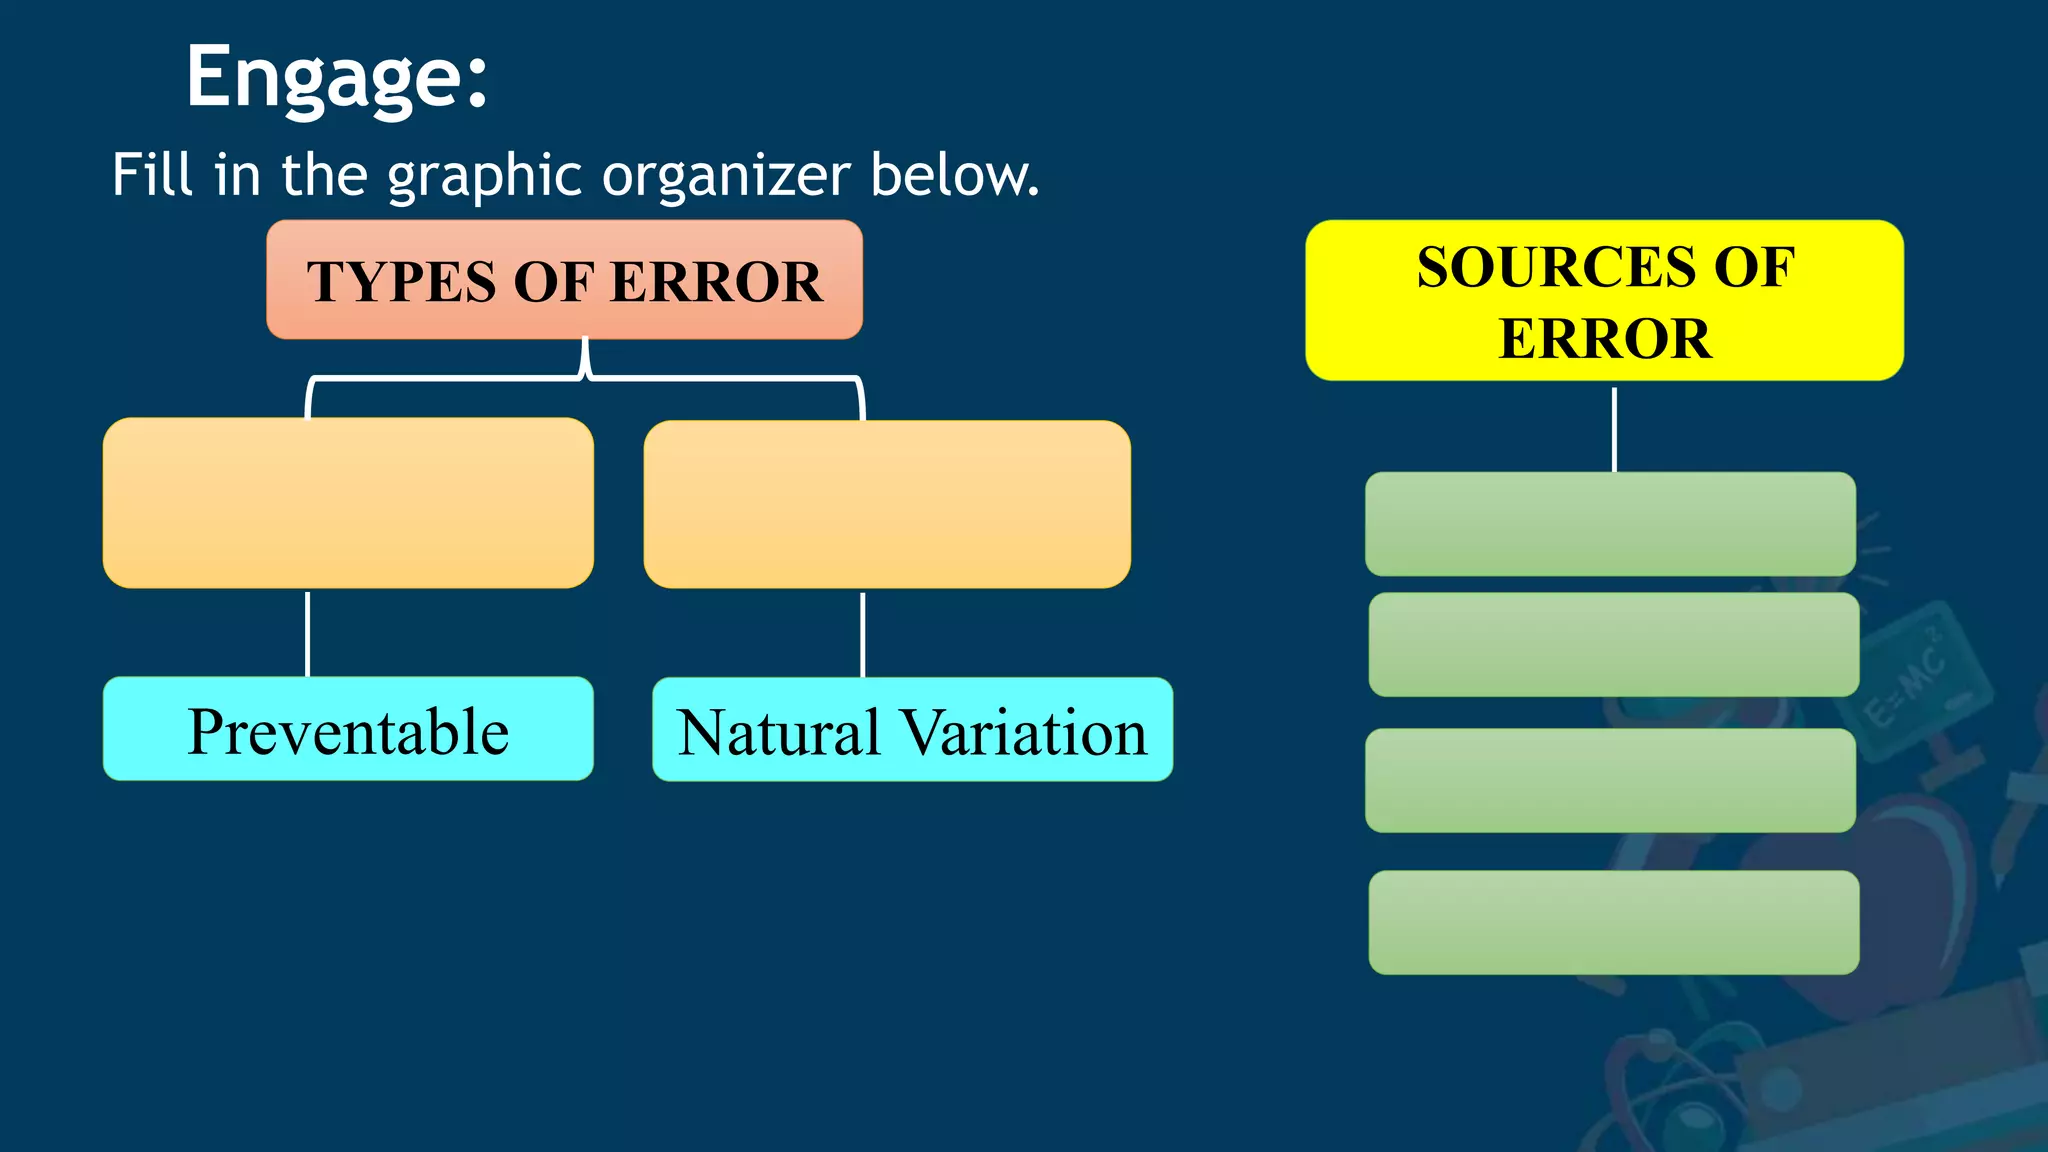
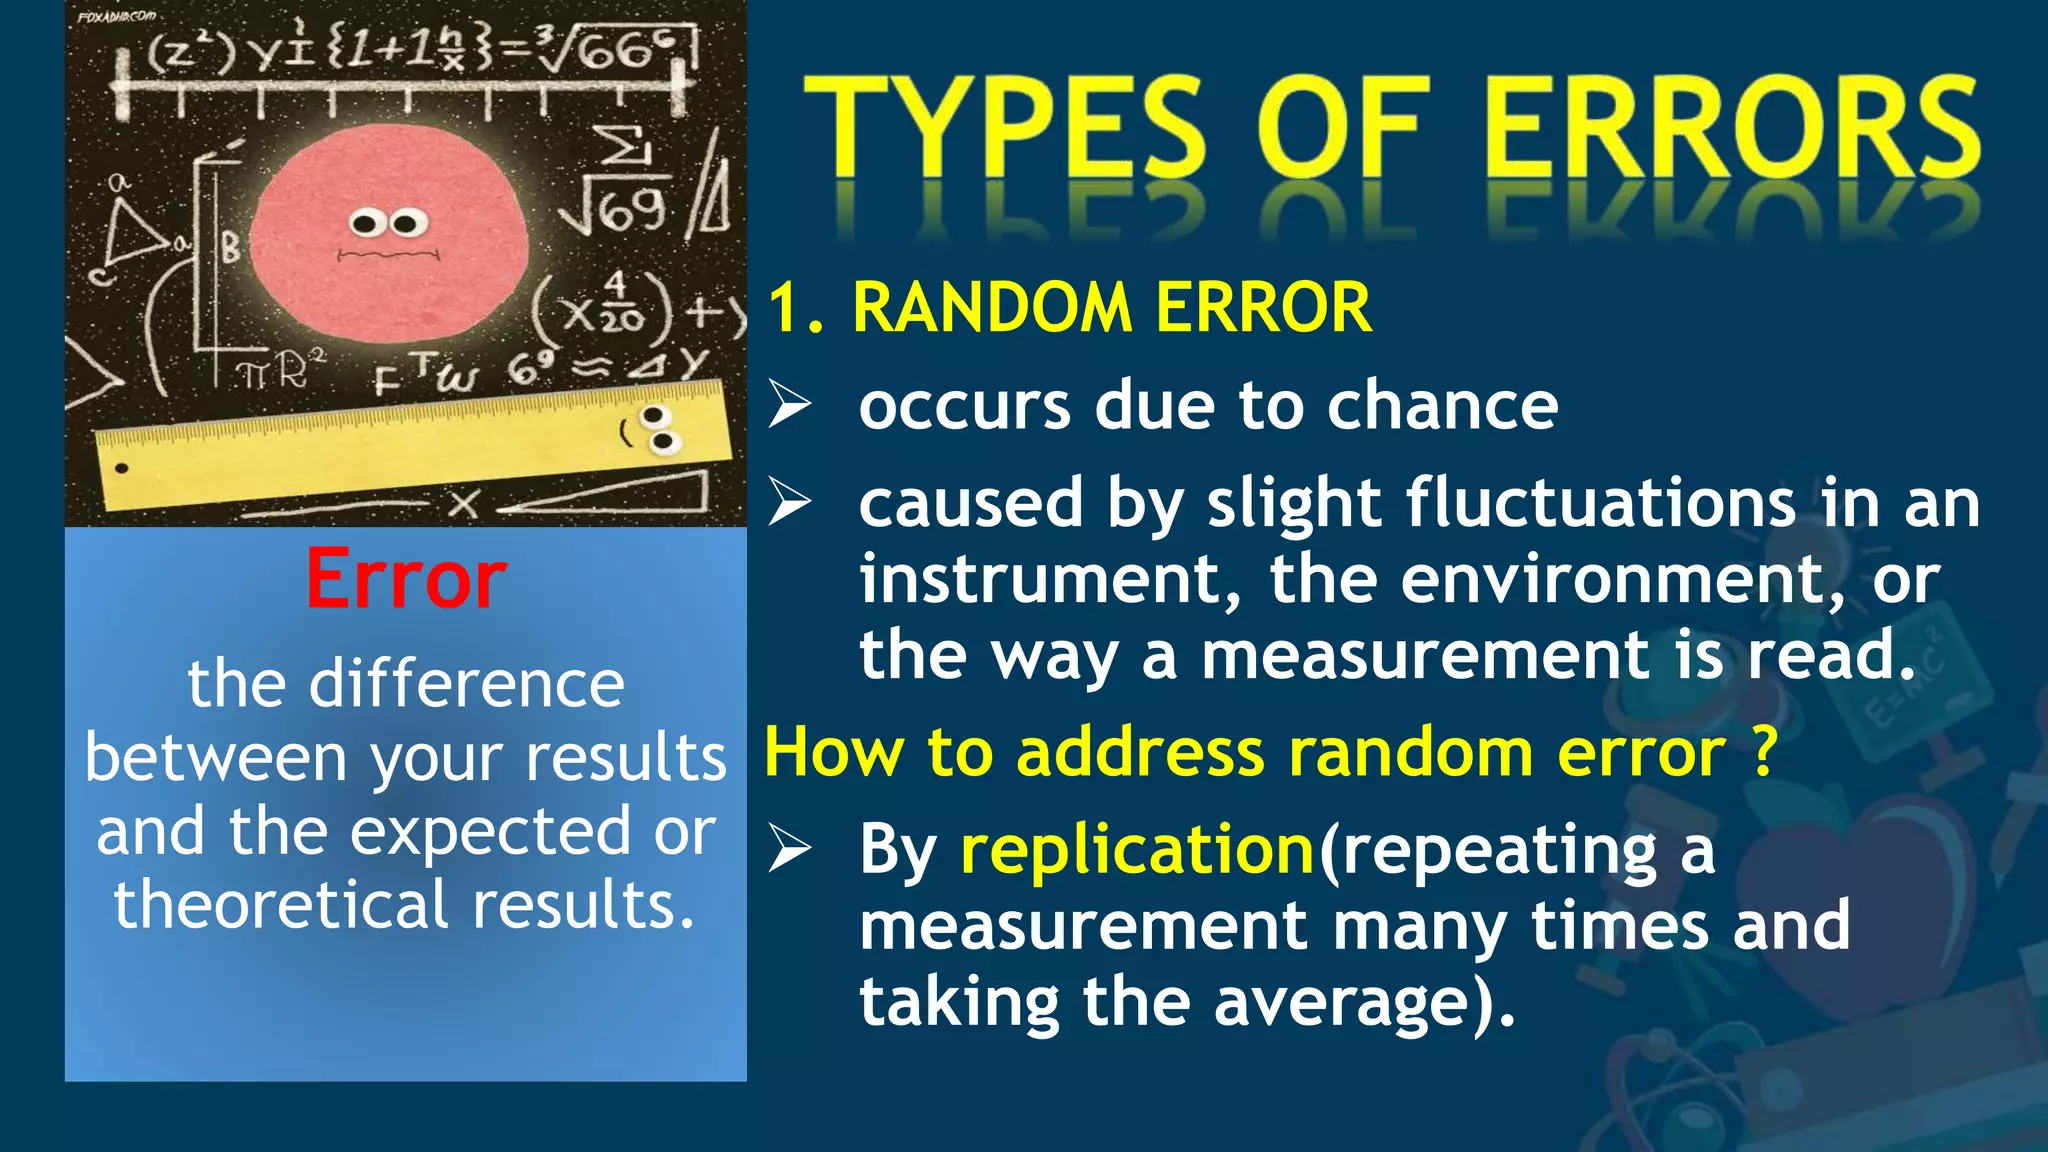
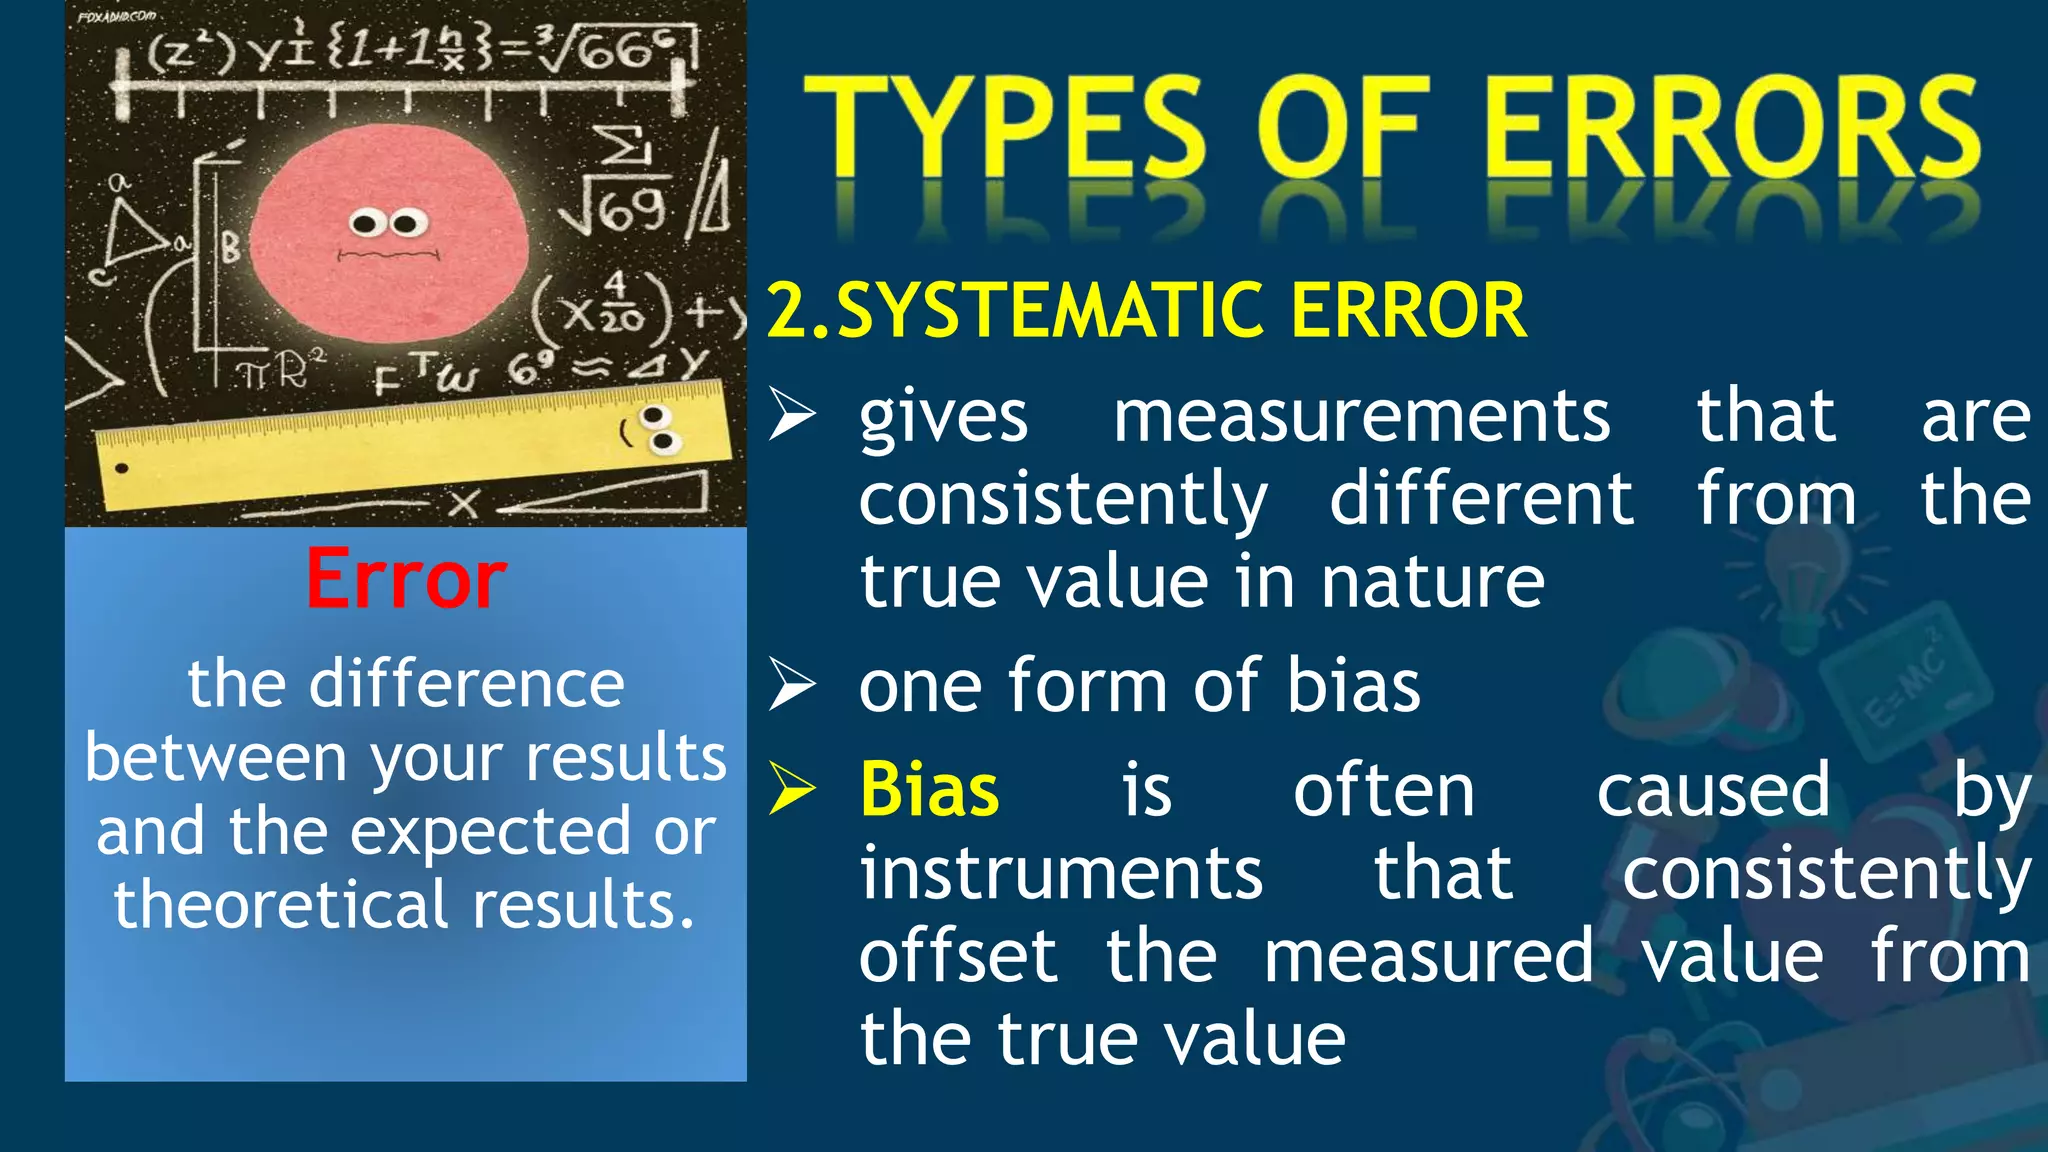
1. The document discusses sources of error in experimental measurements and how to minimize errors. It defines two main types of error - random and systematic error. Random errors can be reduced by taking multiple measurements and finding the average. Systematic errors produce consistent biases and are harder to identify and reduce.
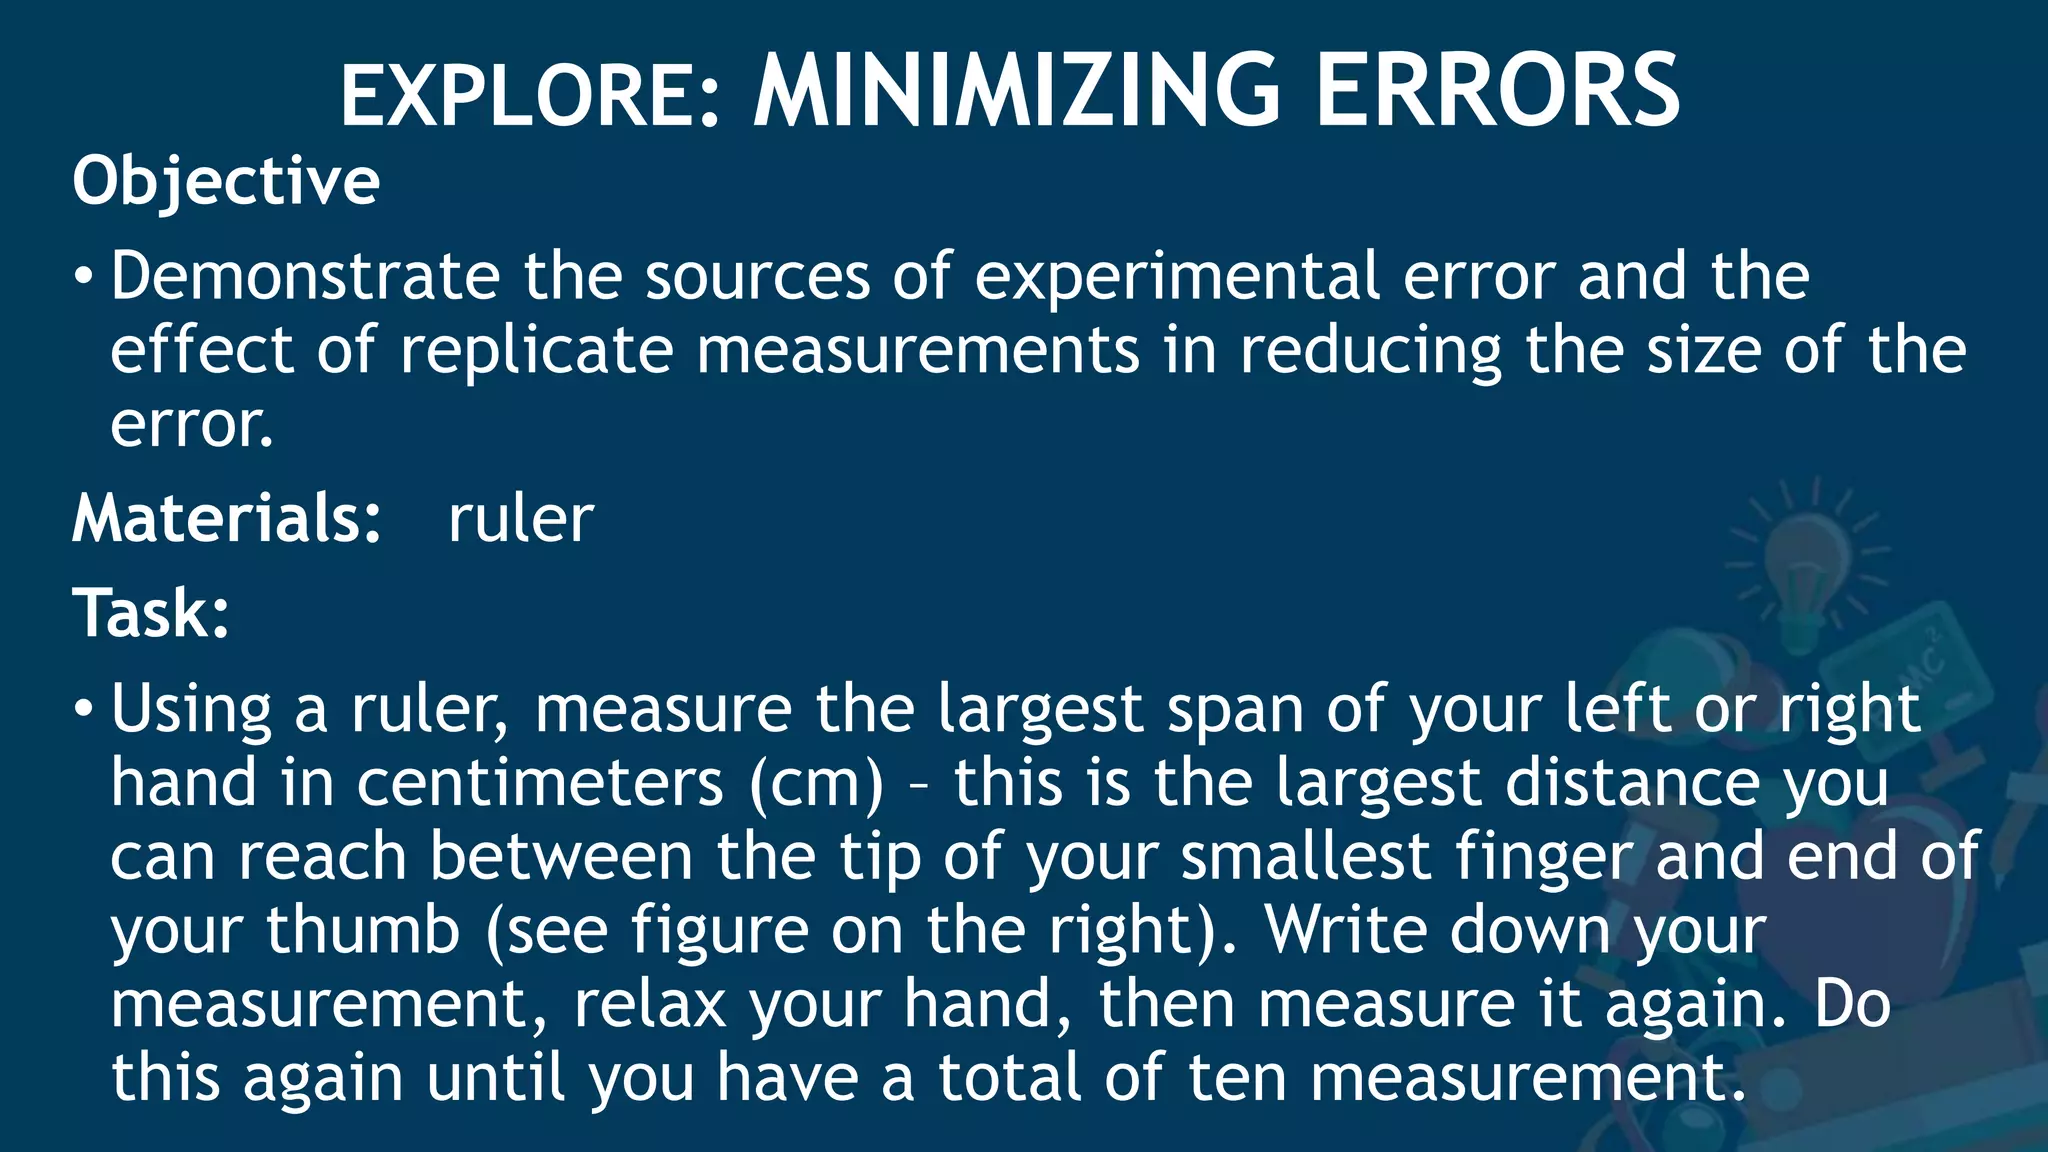
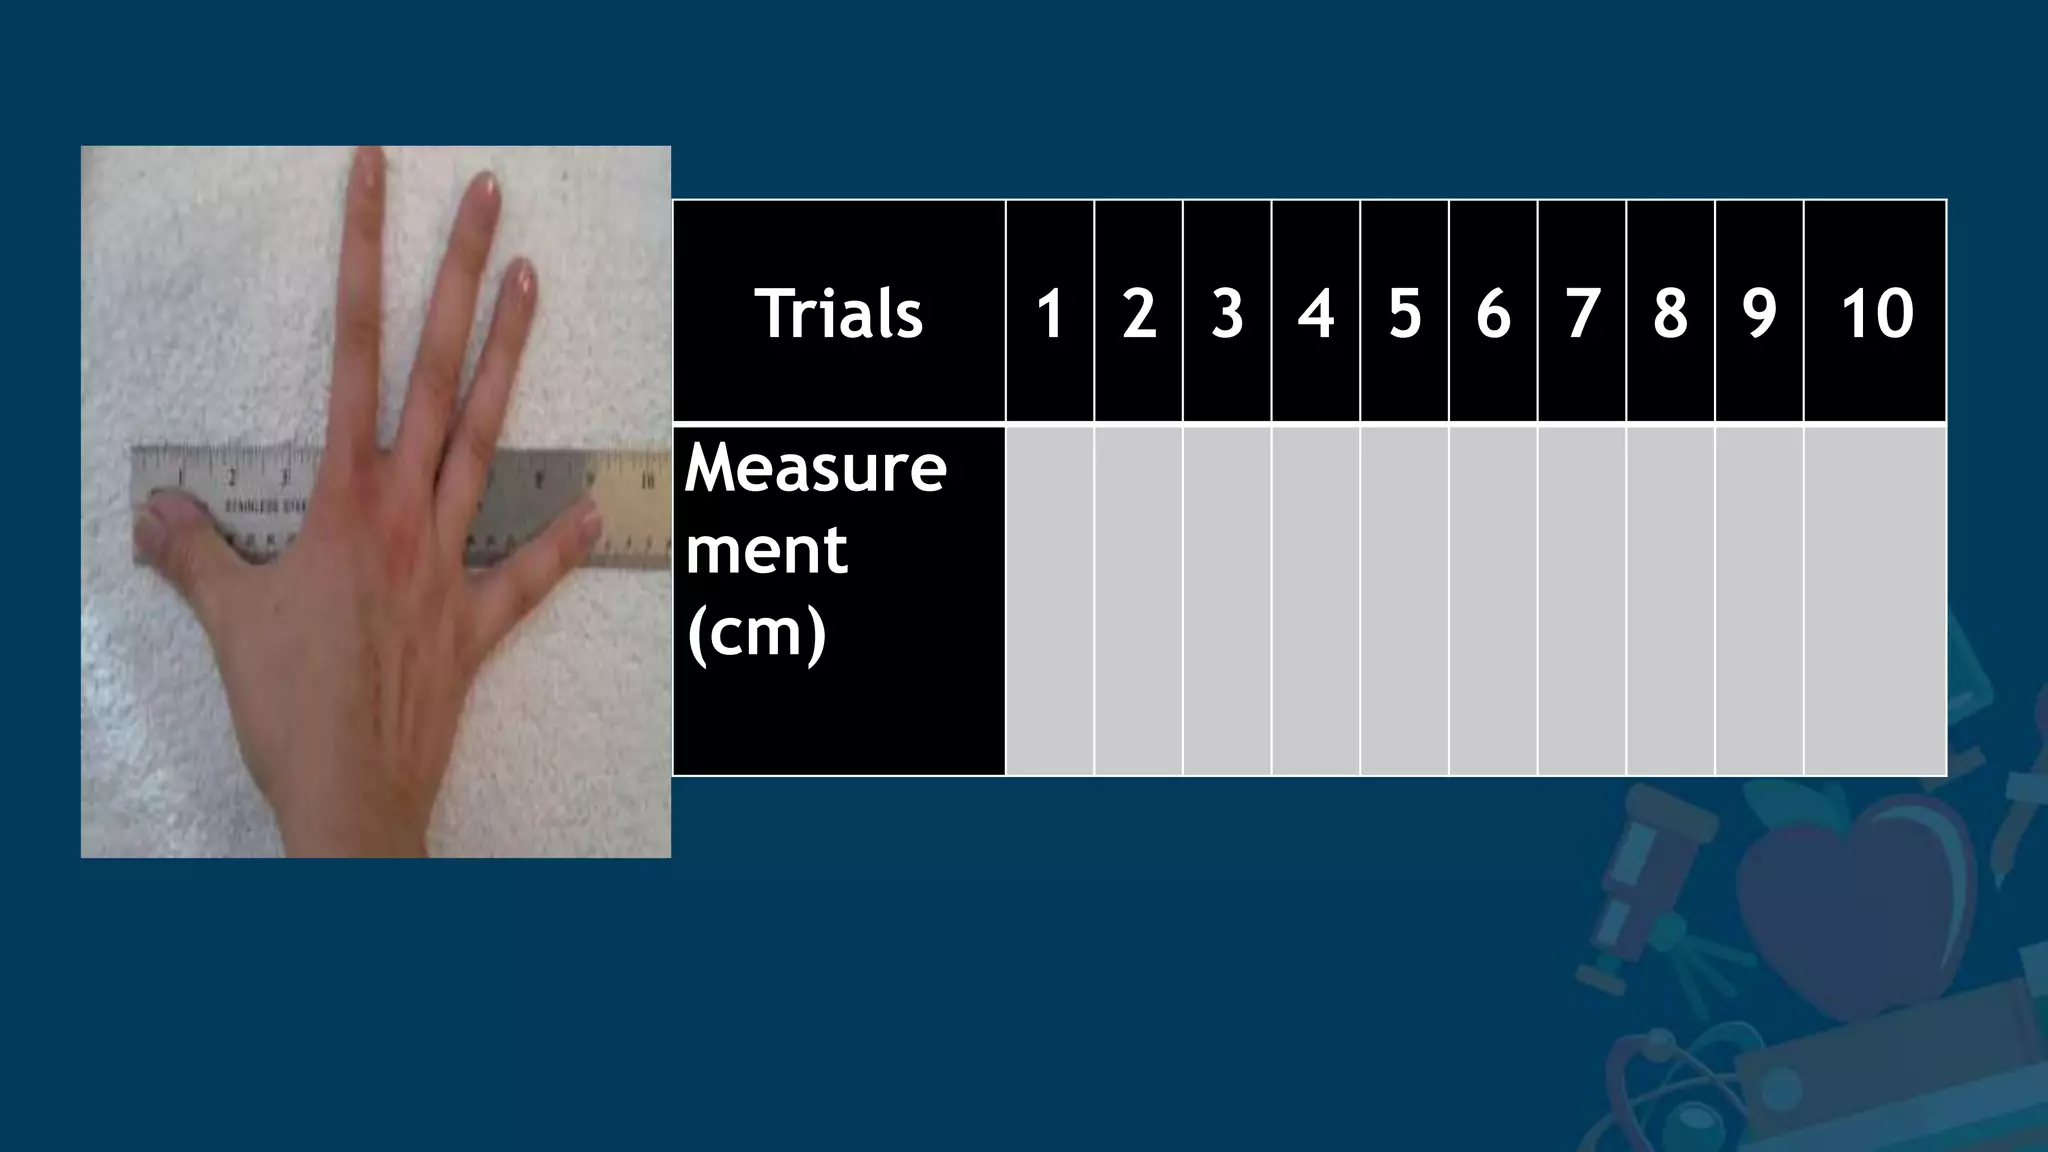
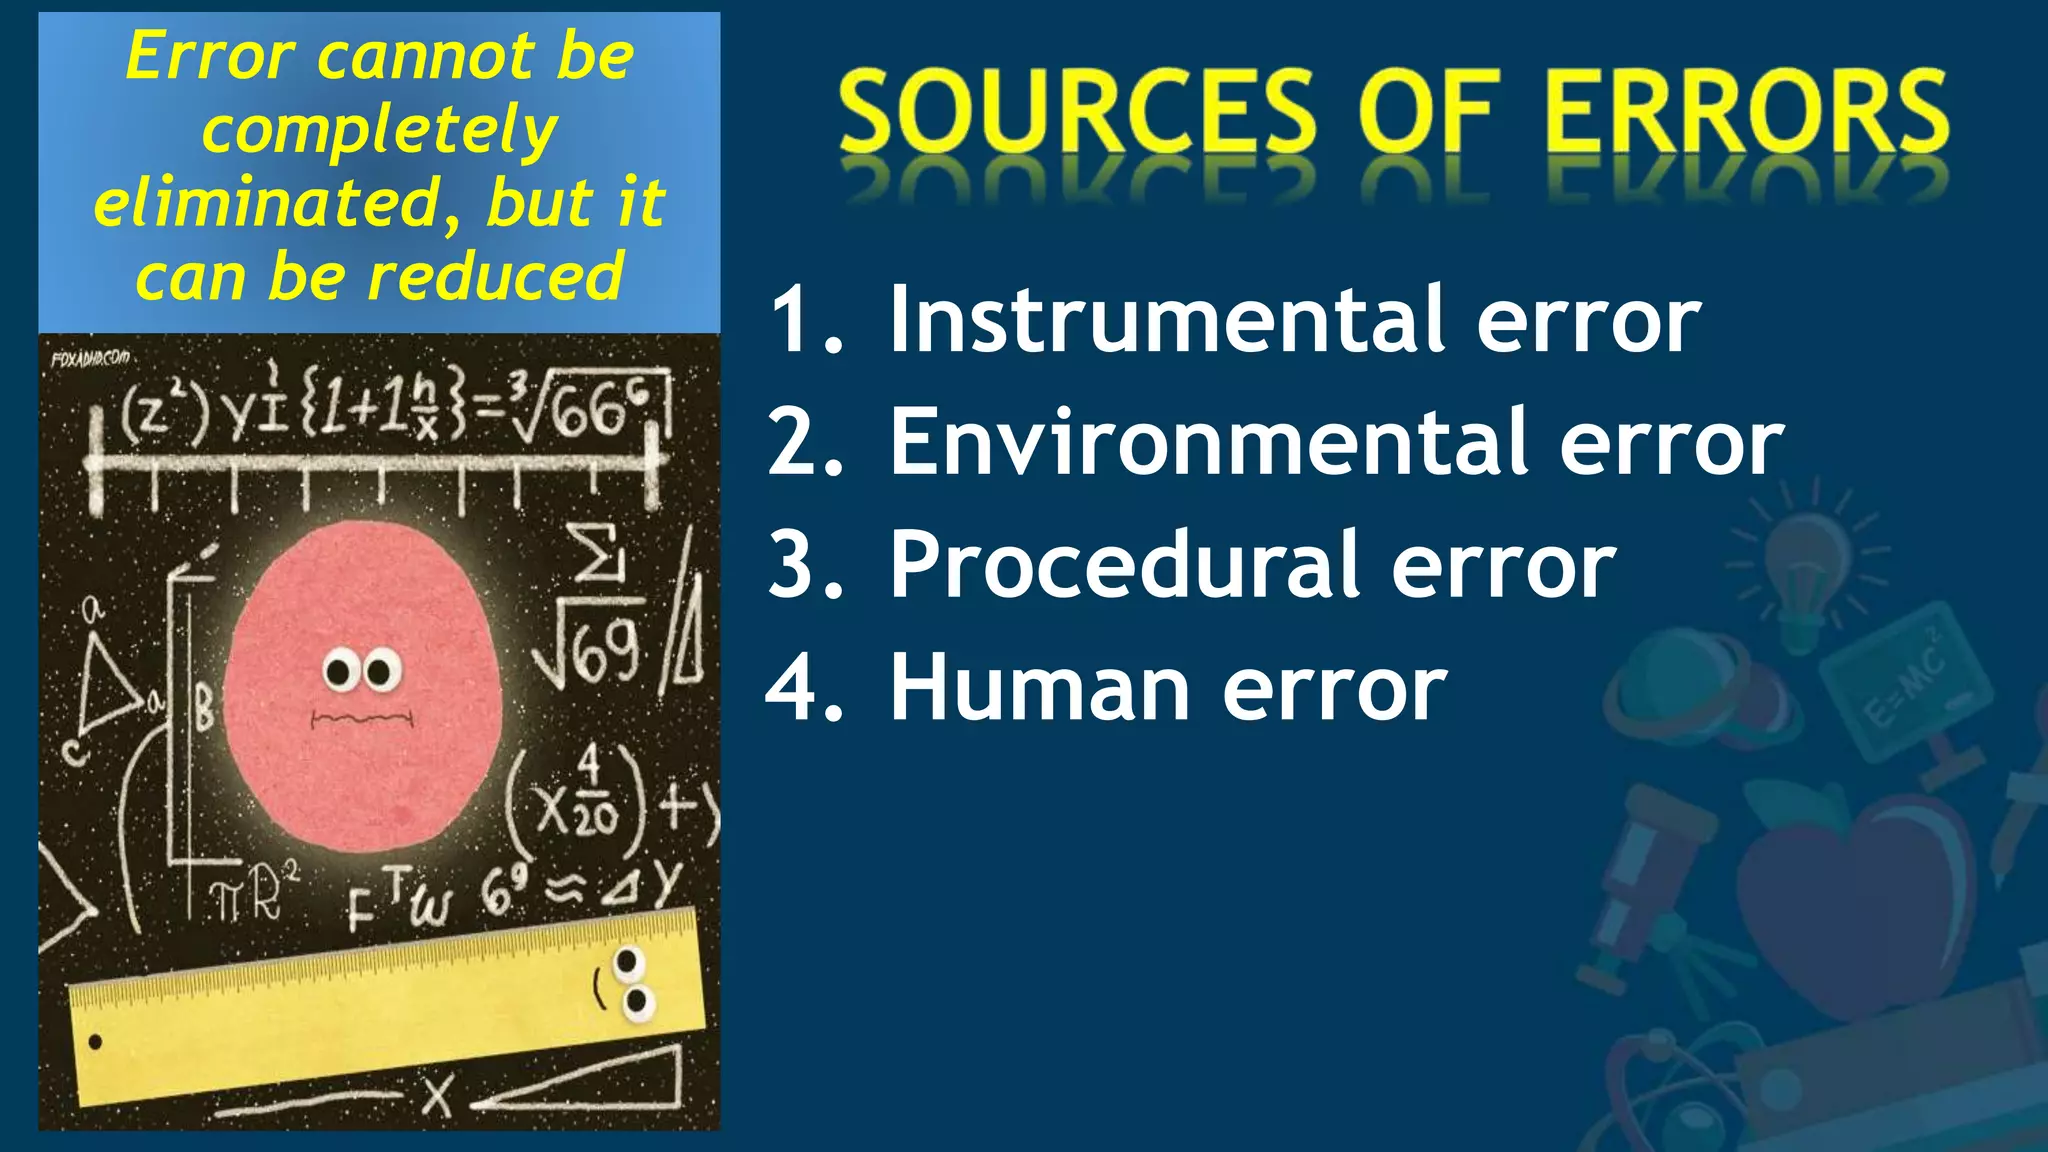
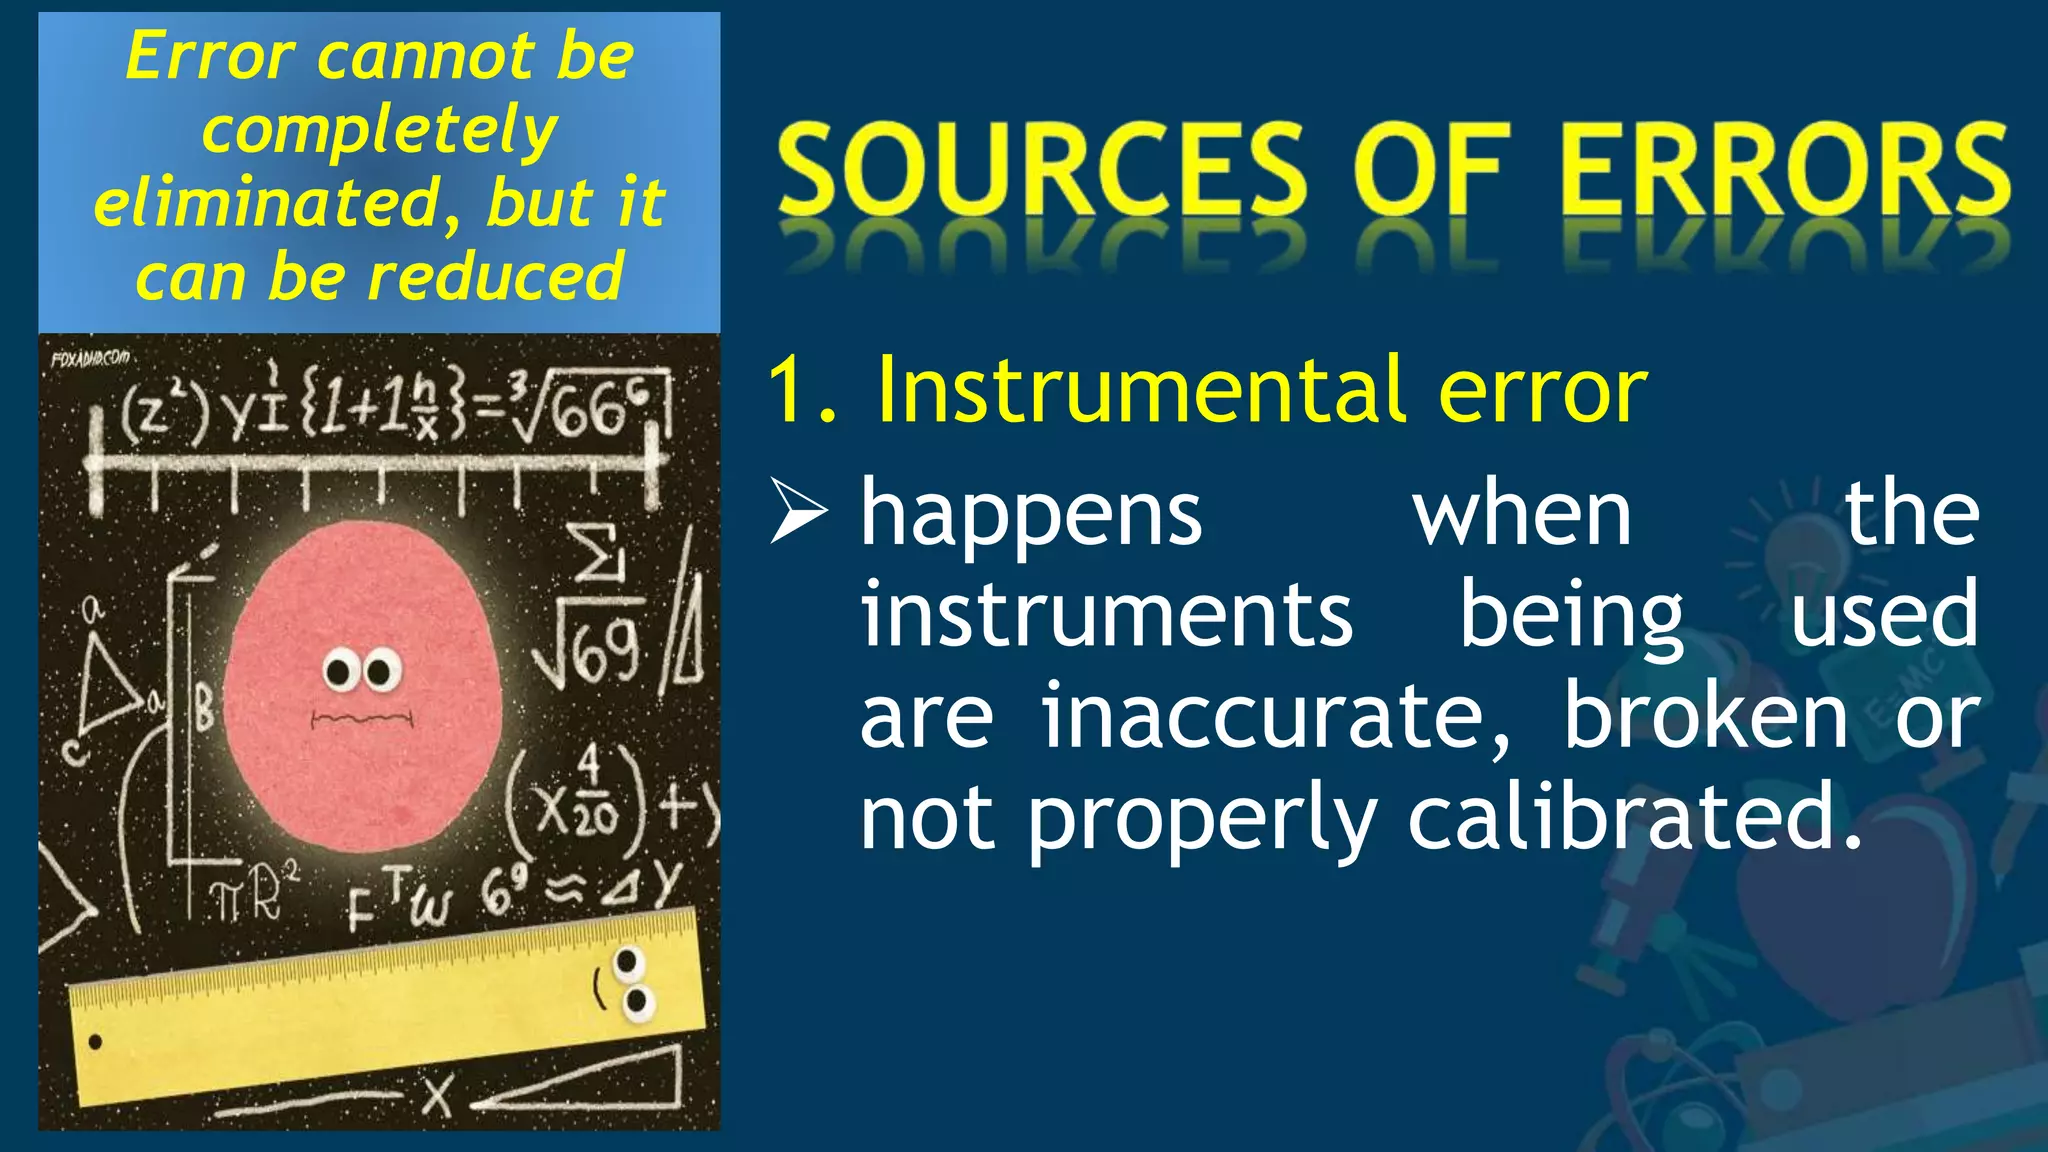
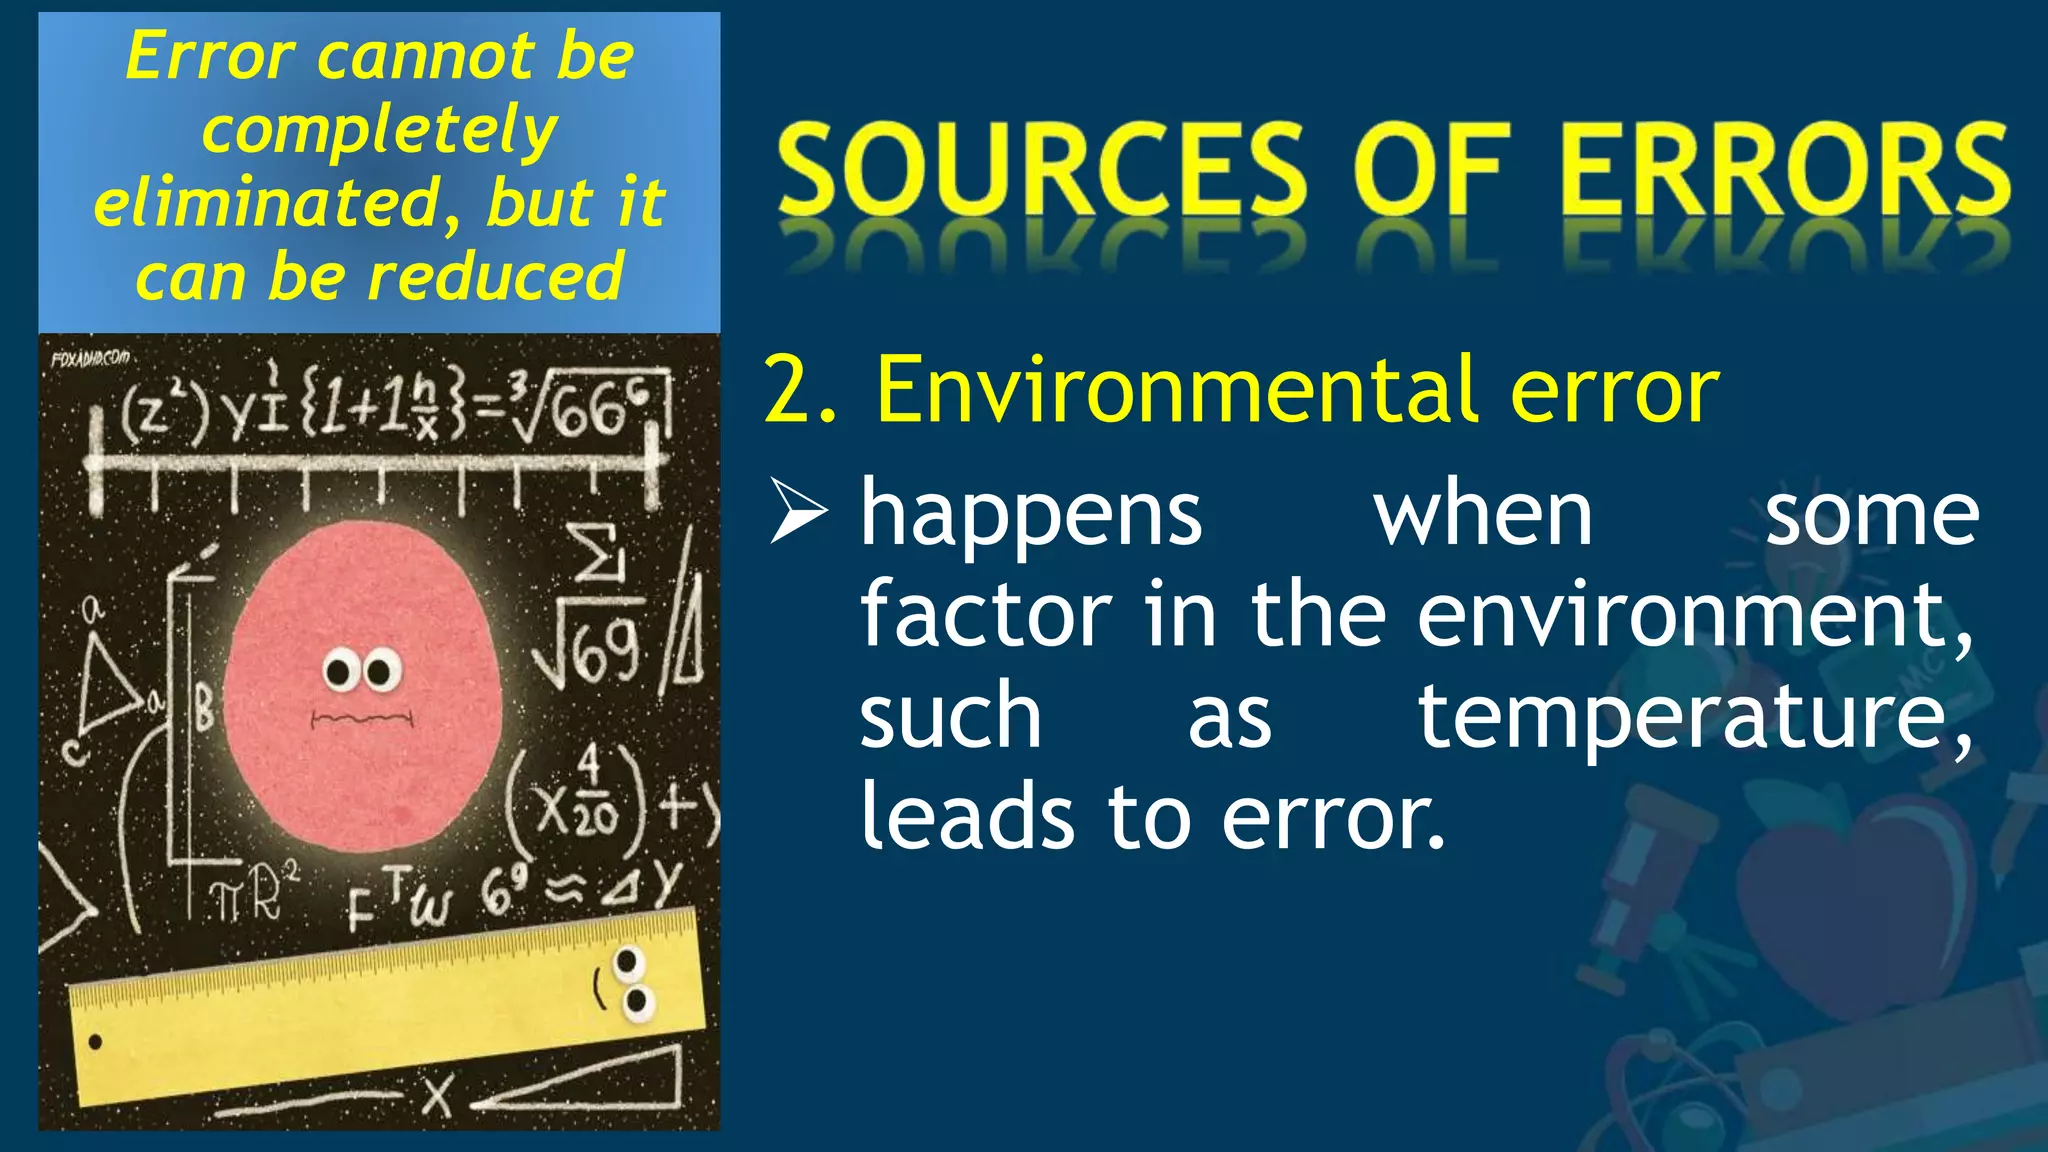
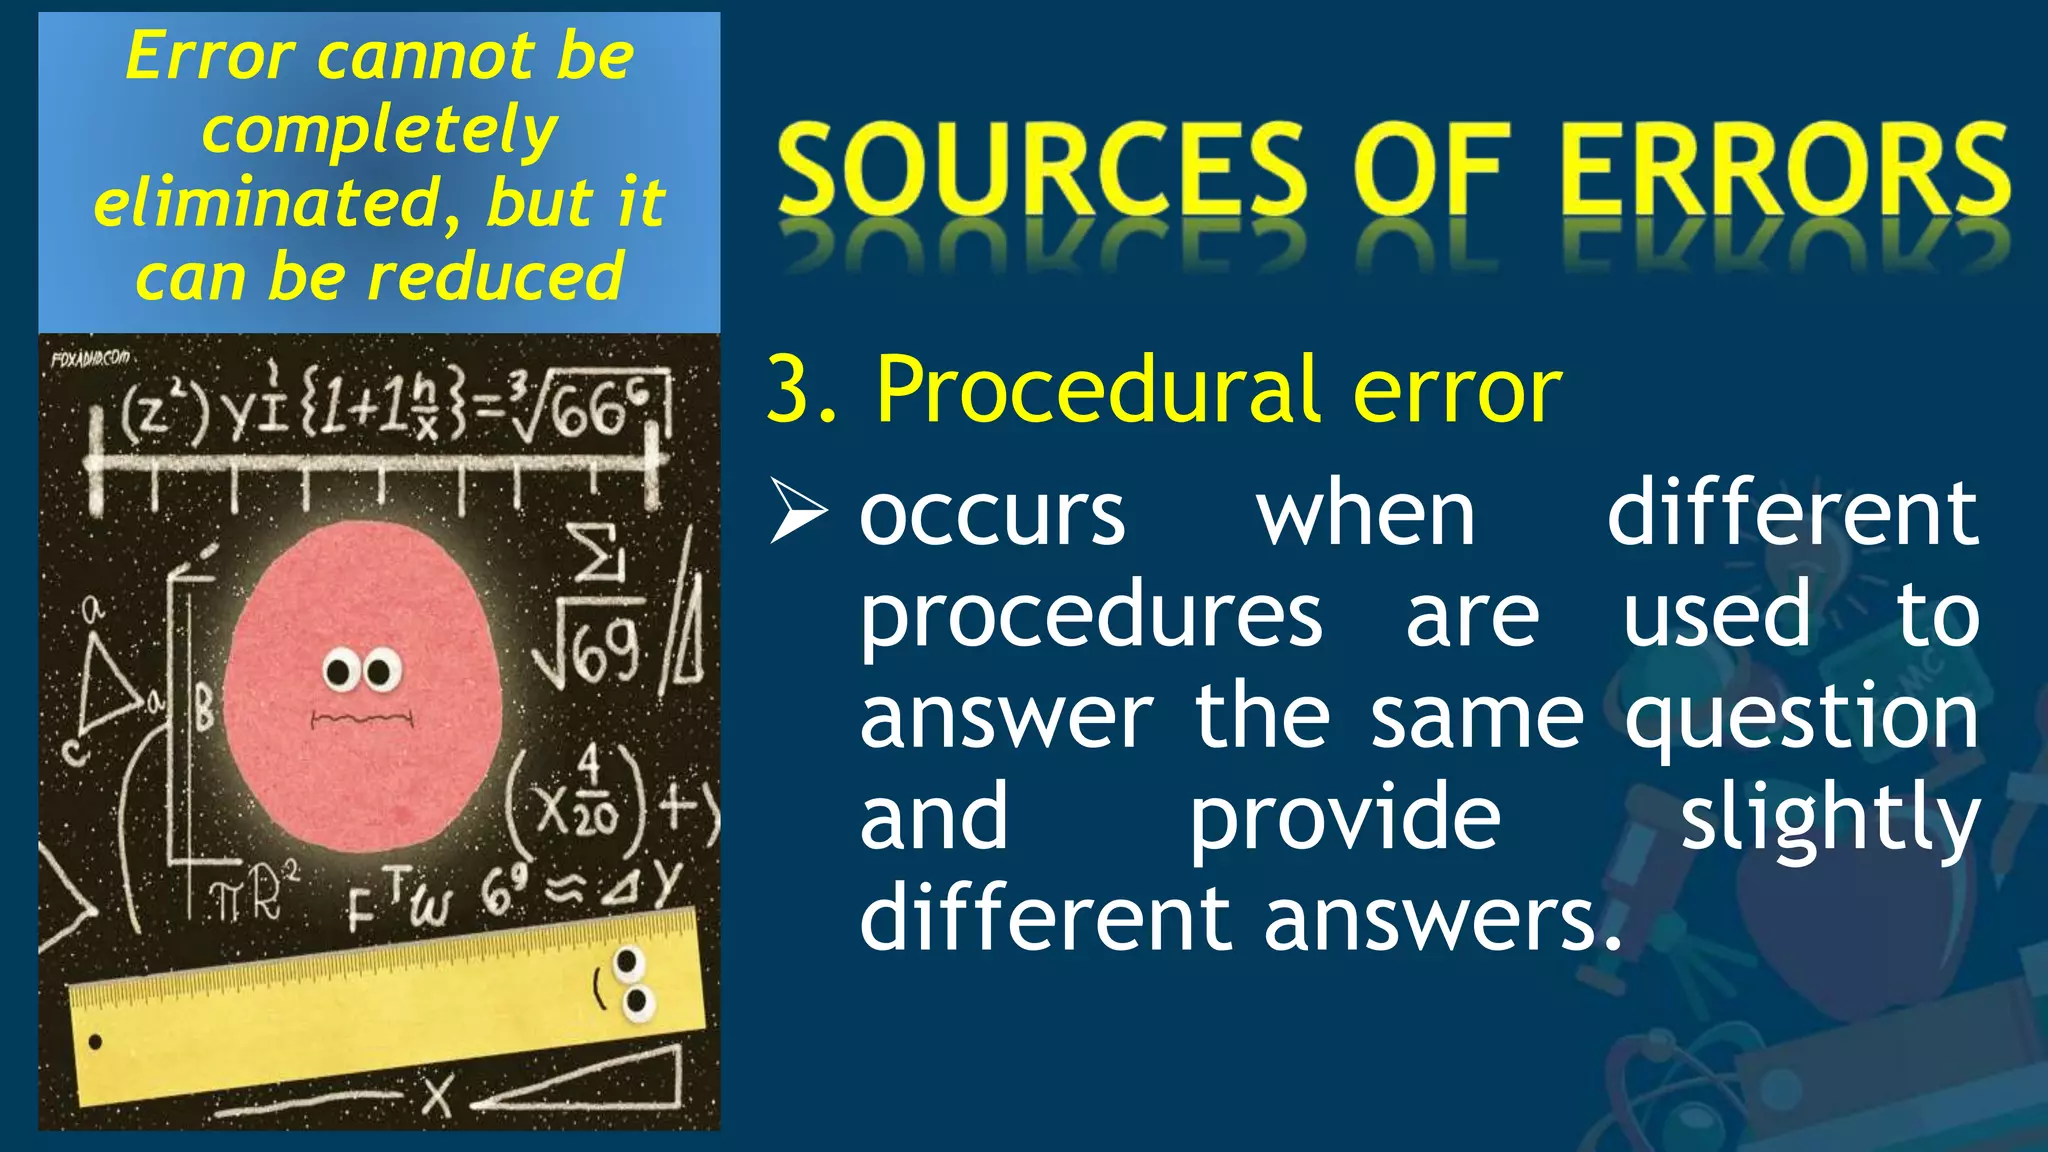
2. Several specific sources of error are described, including instrumental errors, environmental errors, procedural errors, and human errors like transcription mistakes. Taking repeated measurements and calibrating instruments can help minimize different error sources.
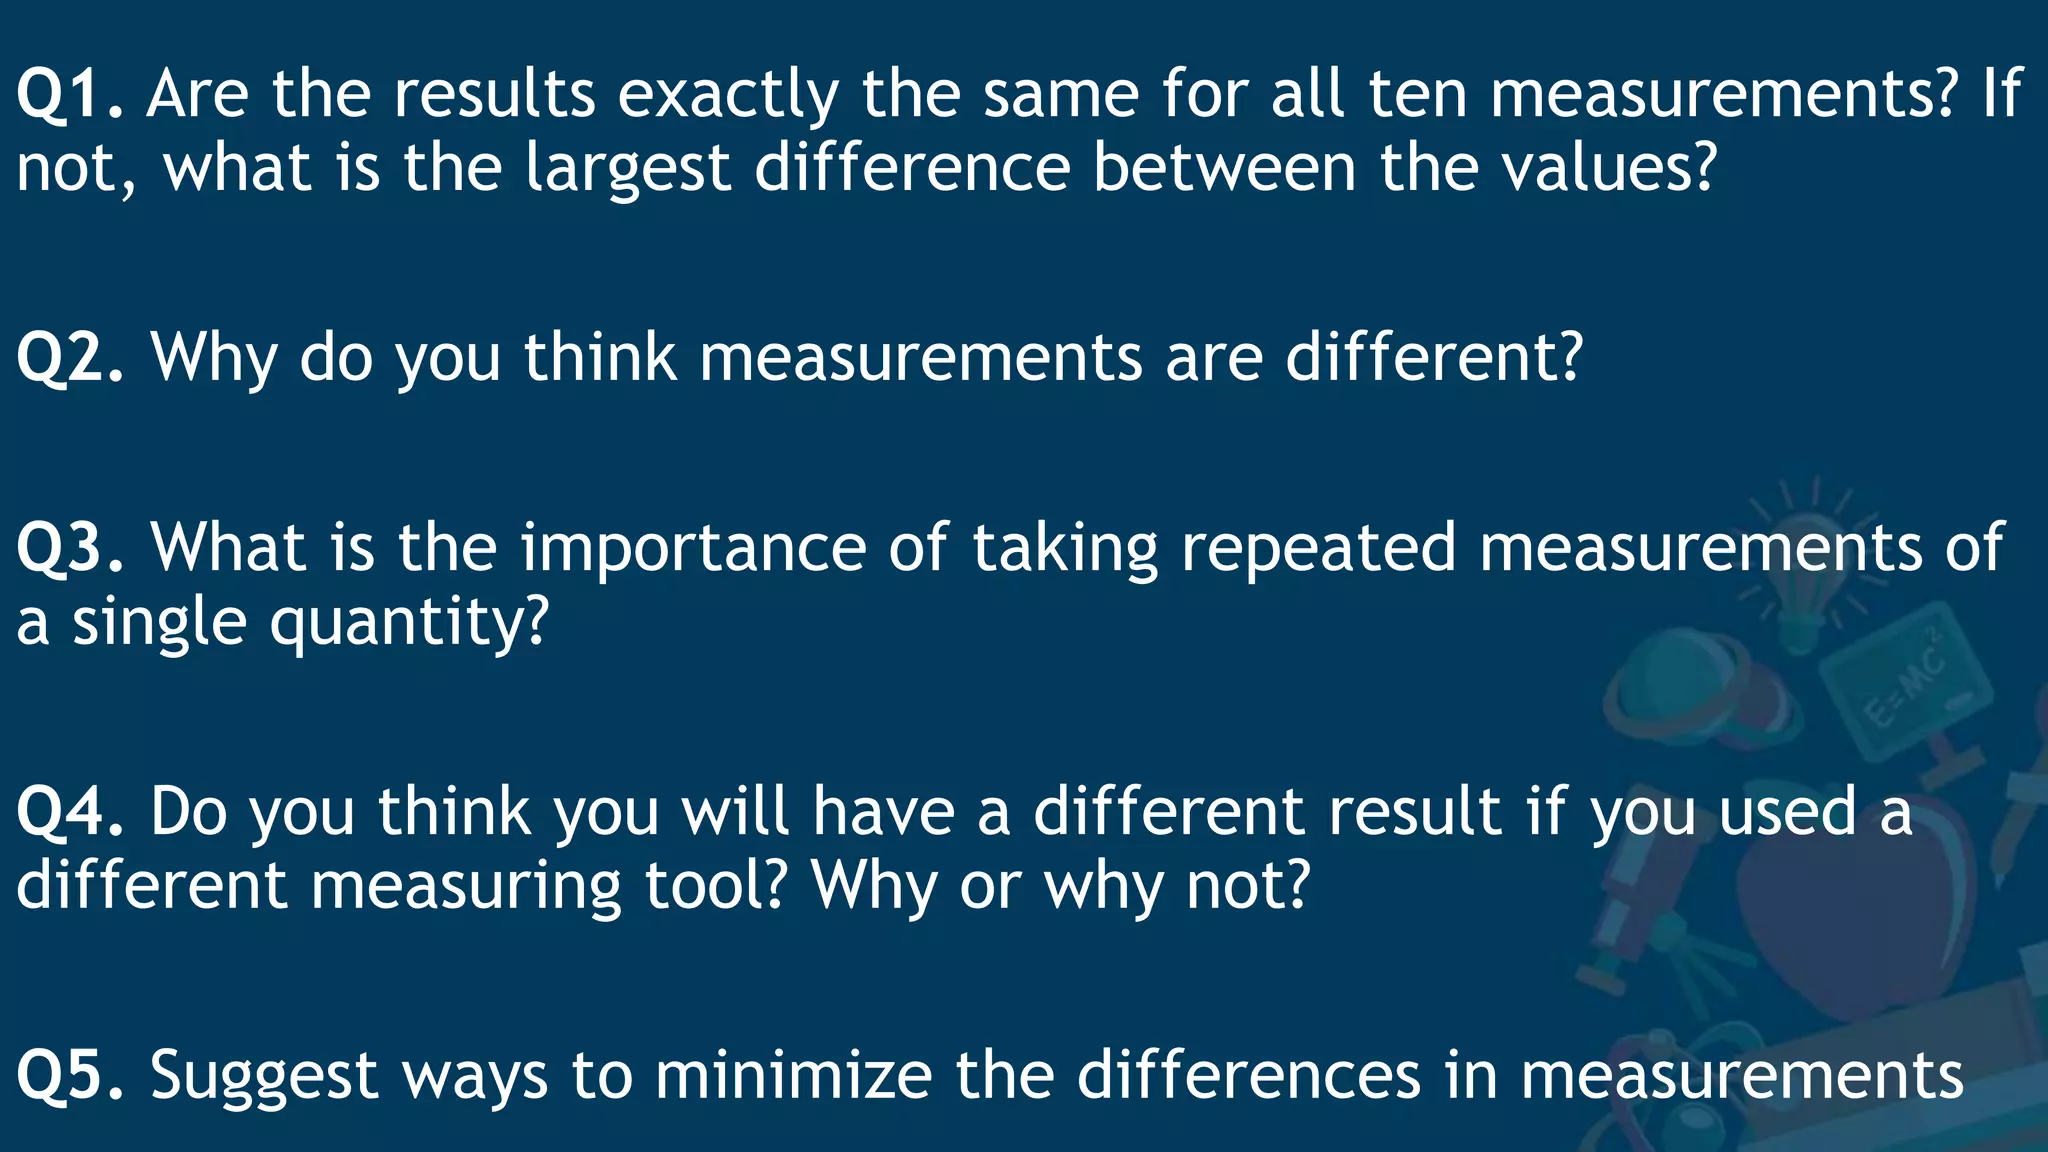
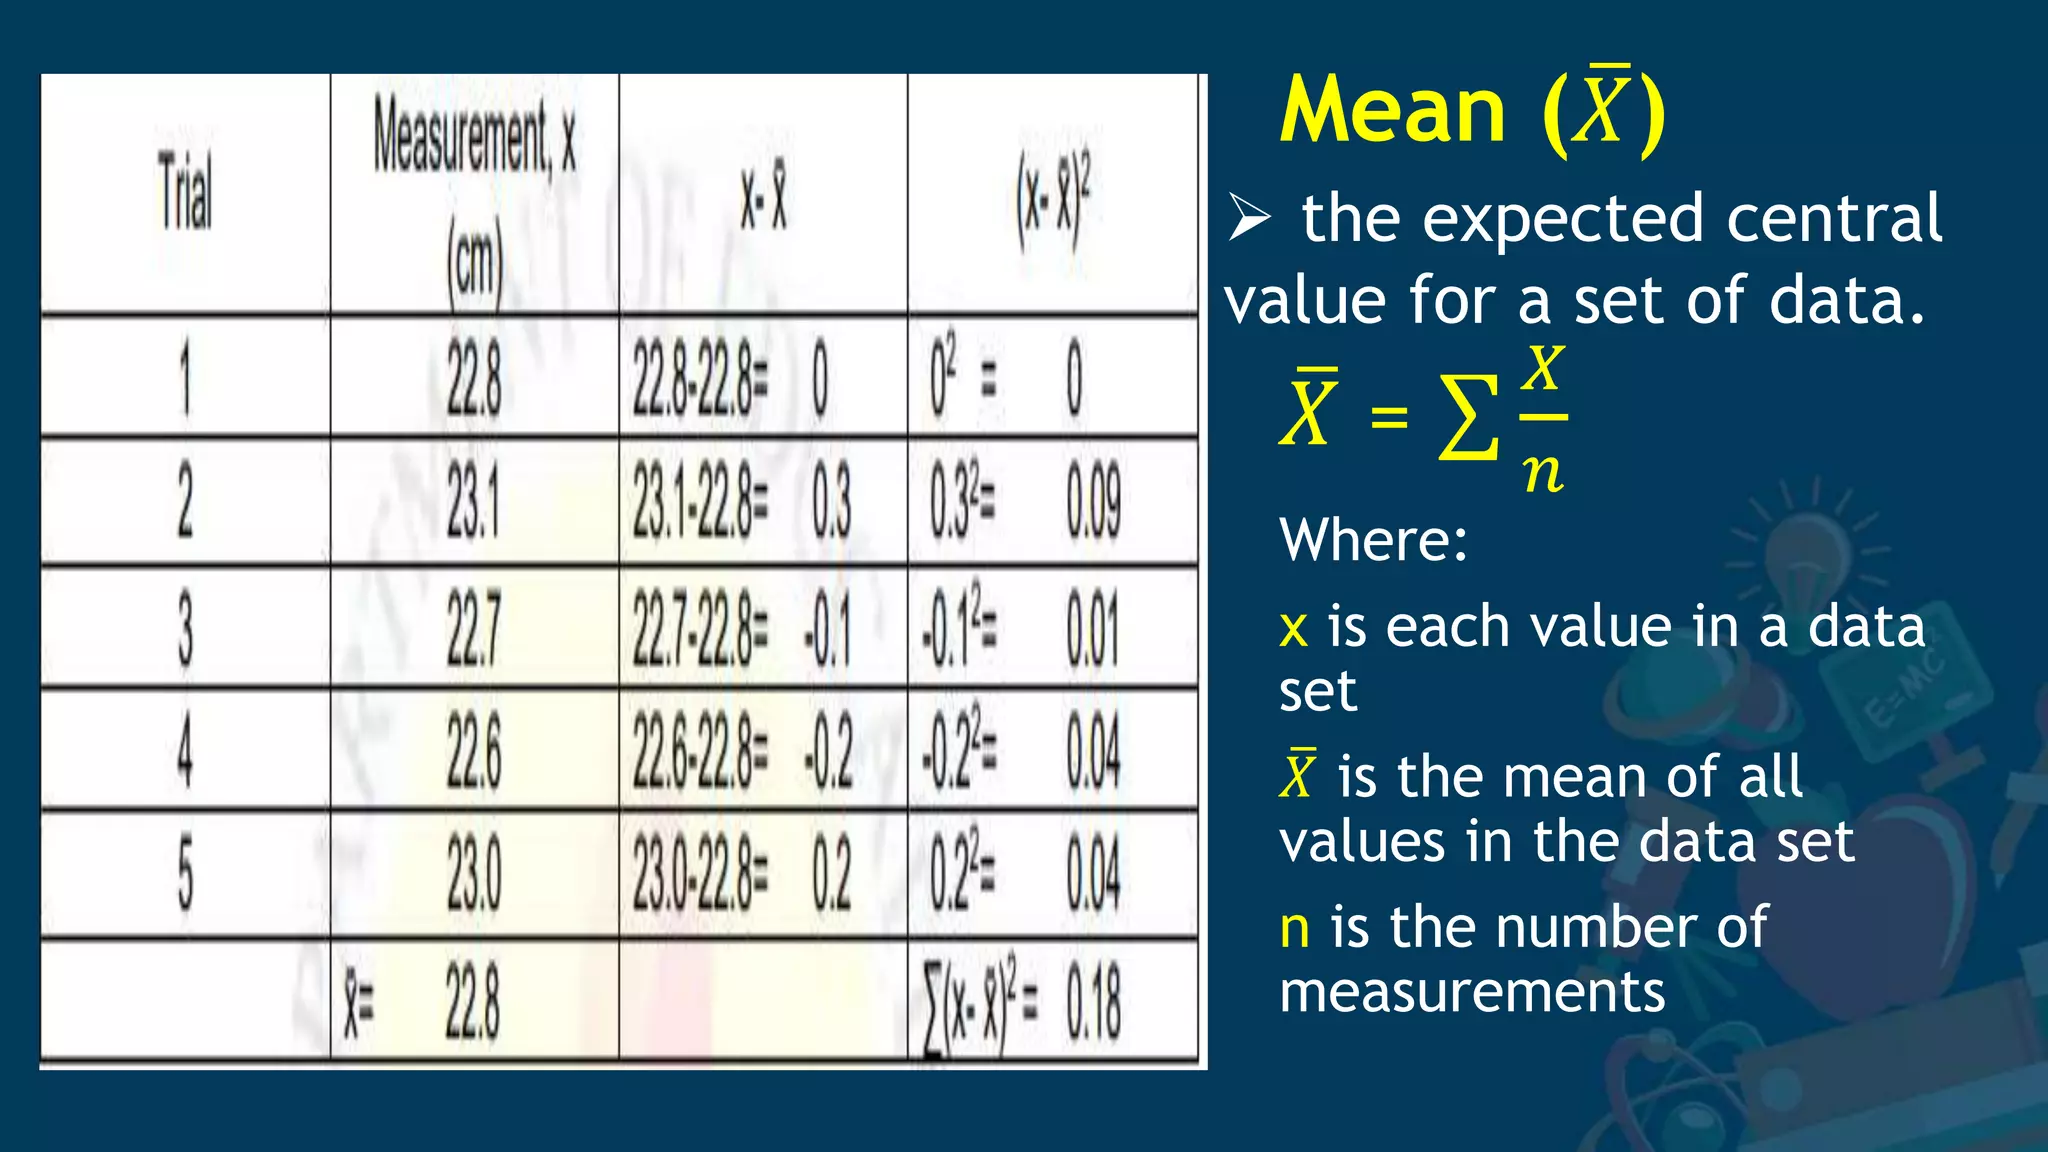
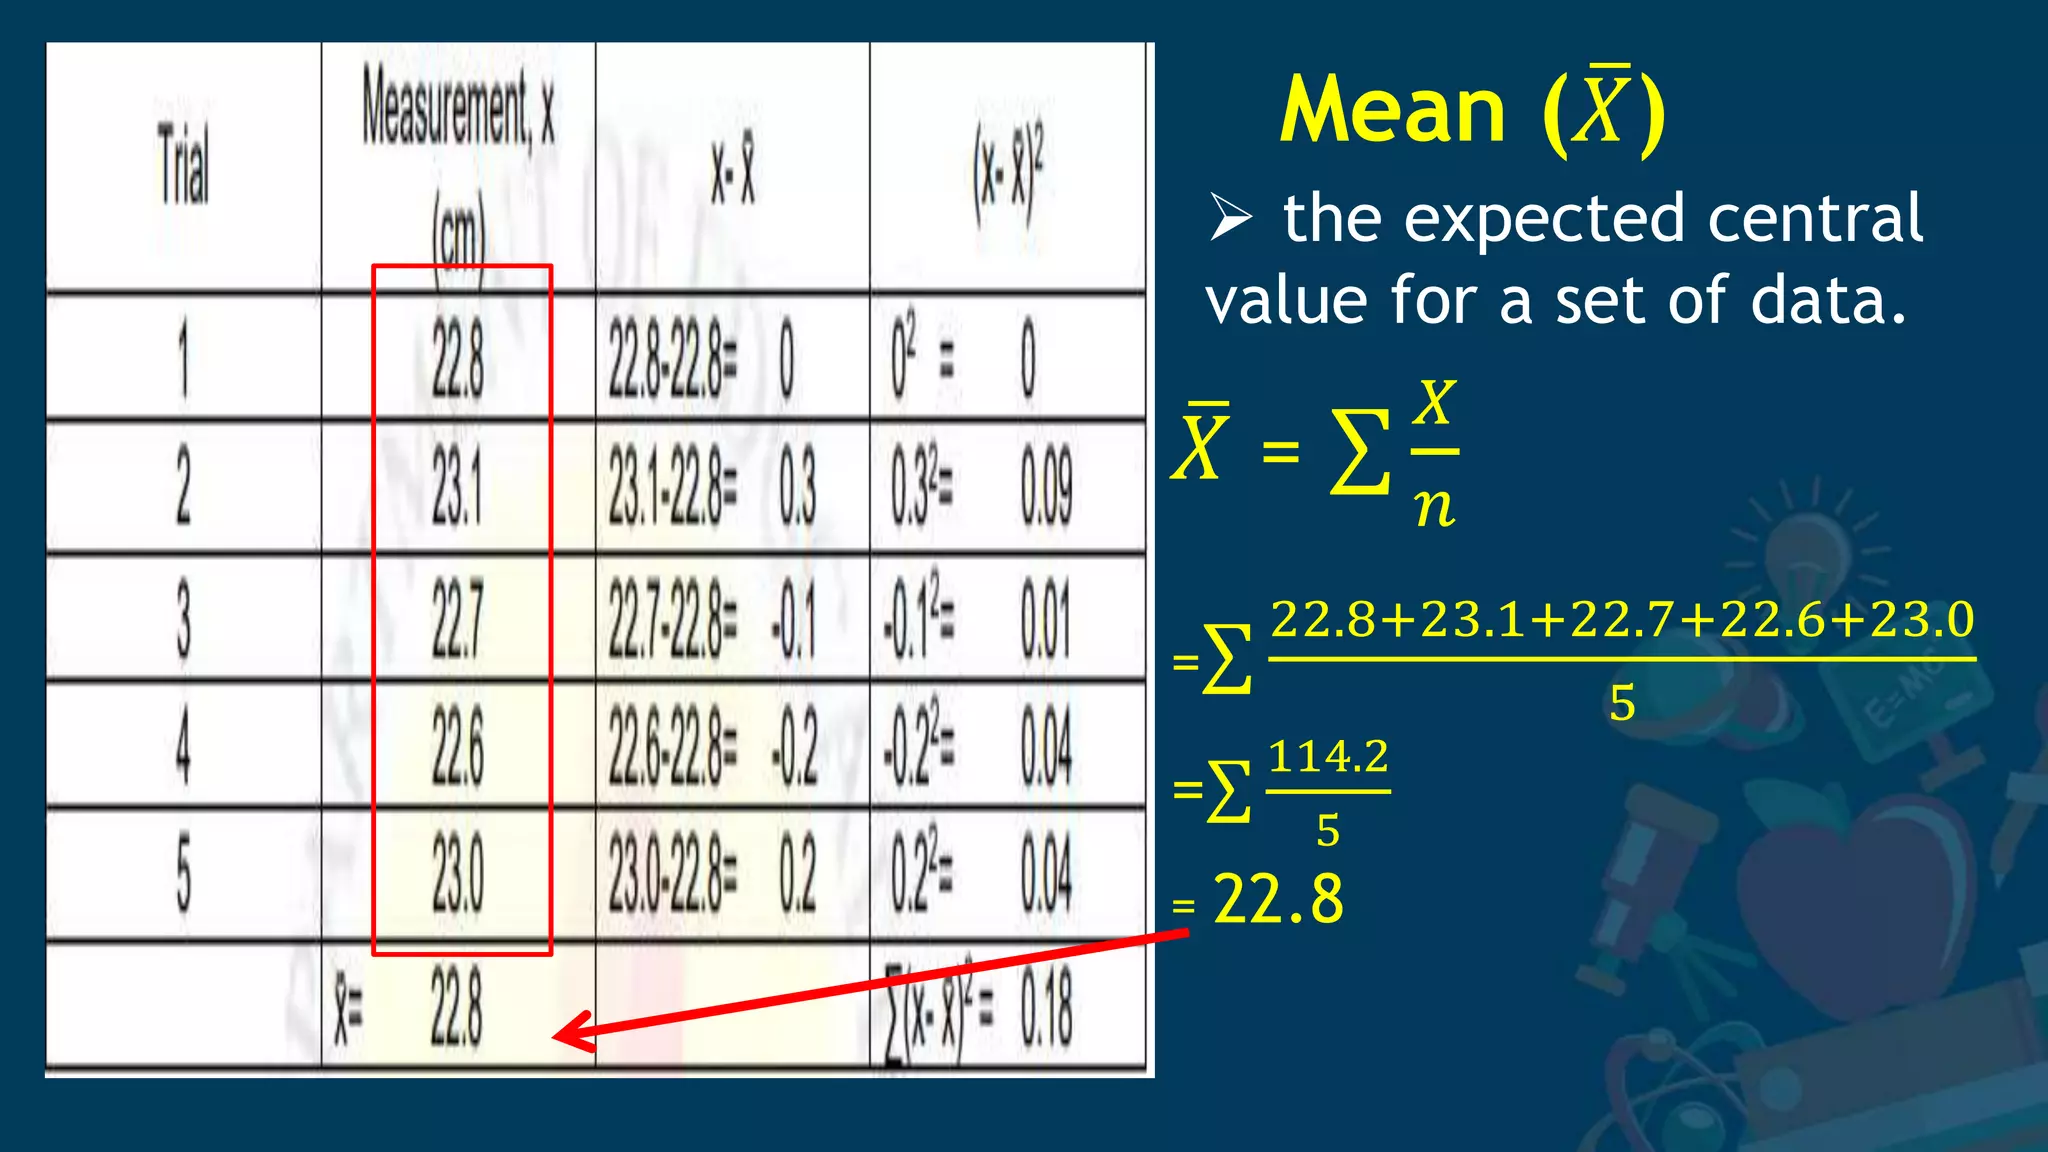
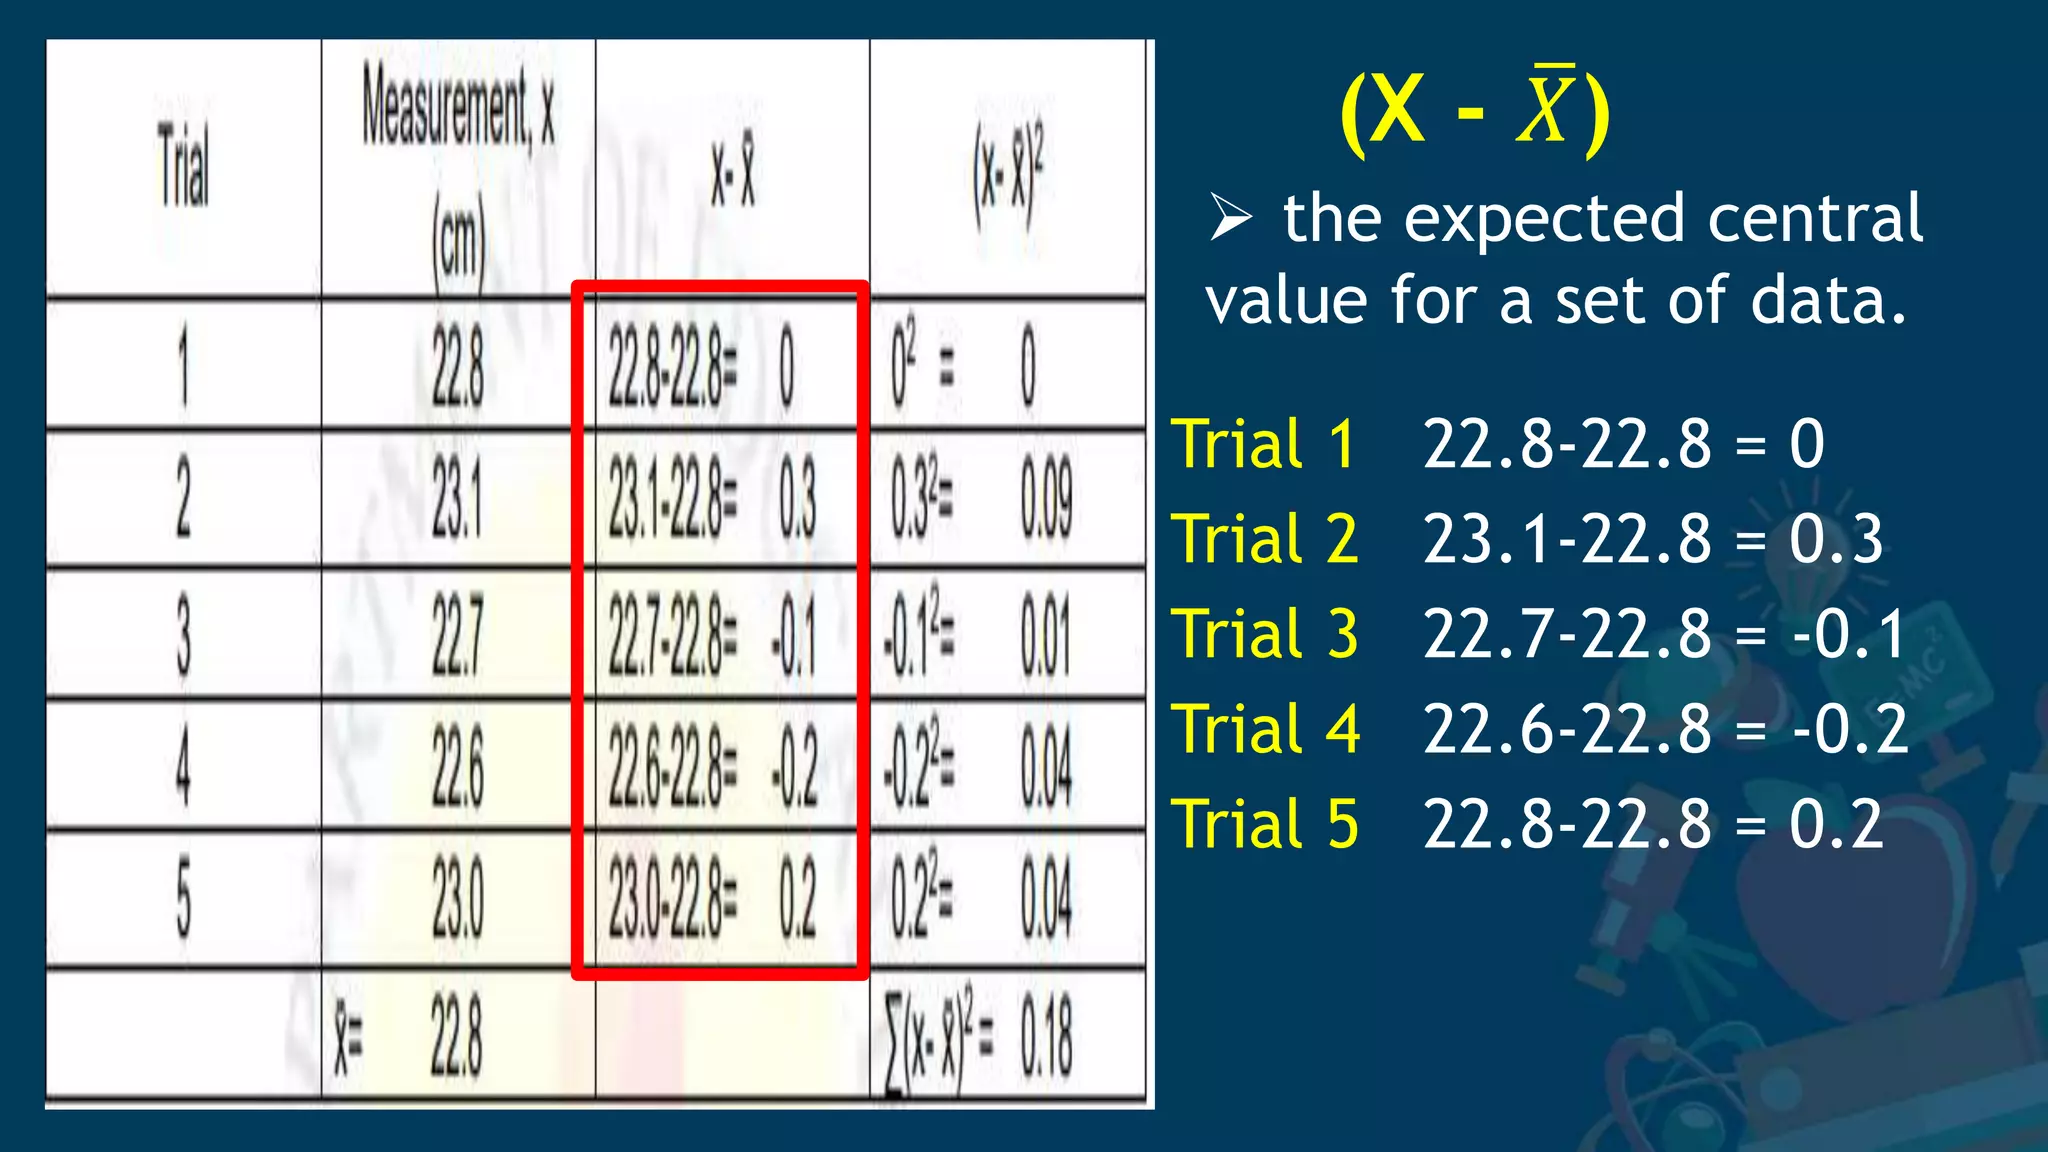
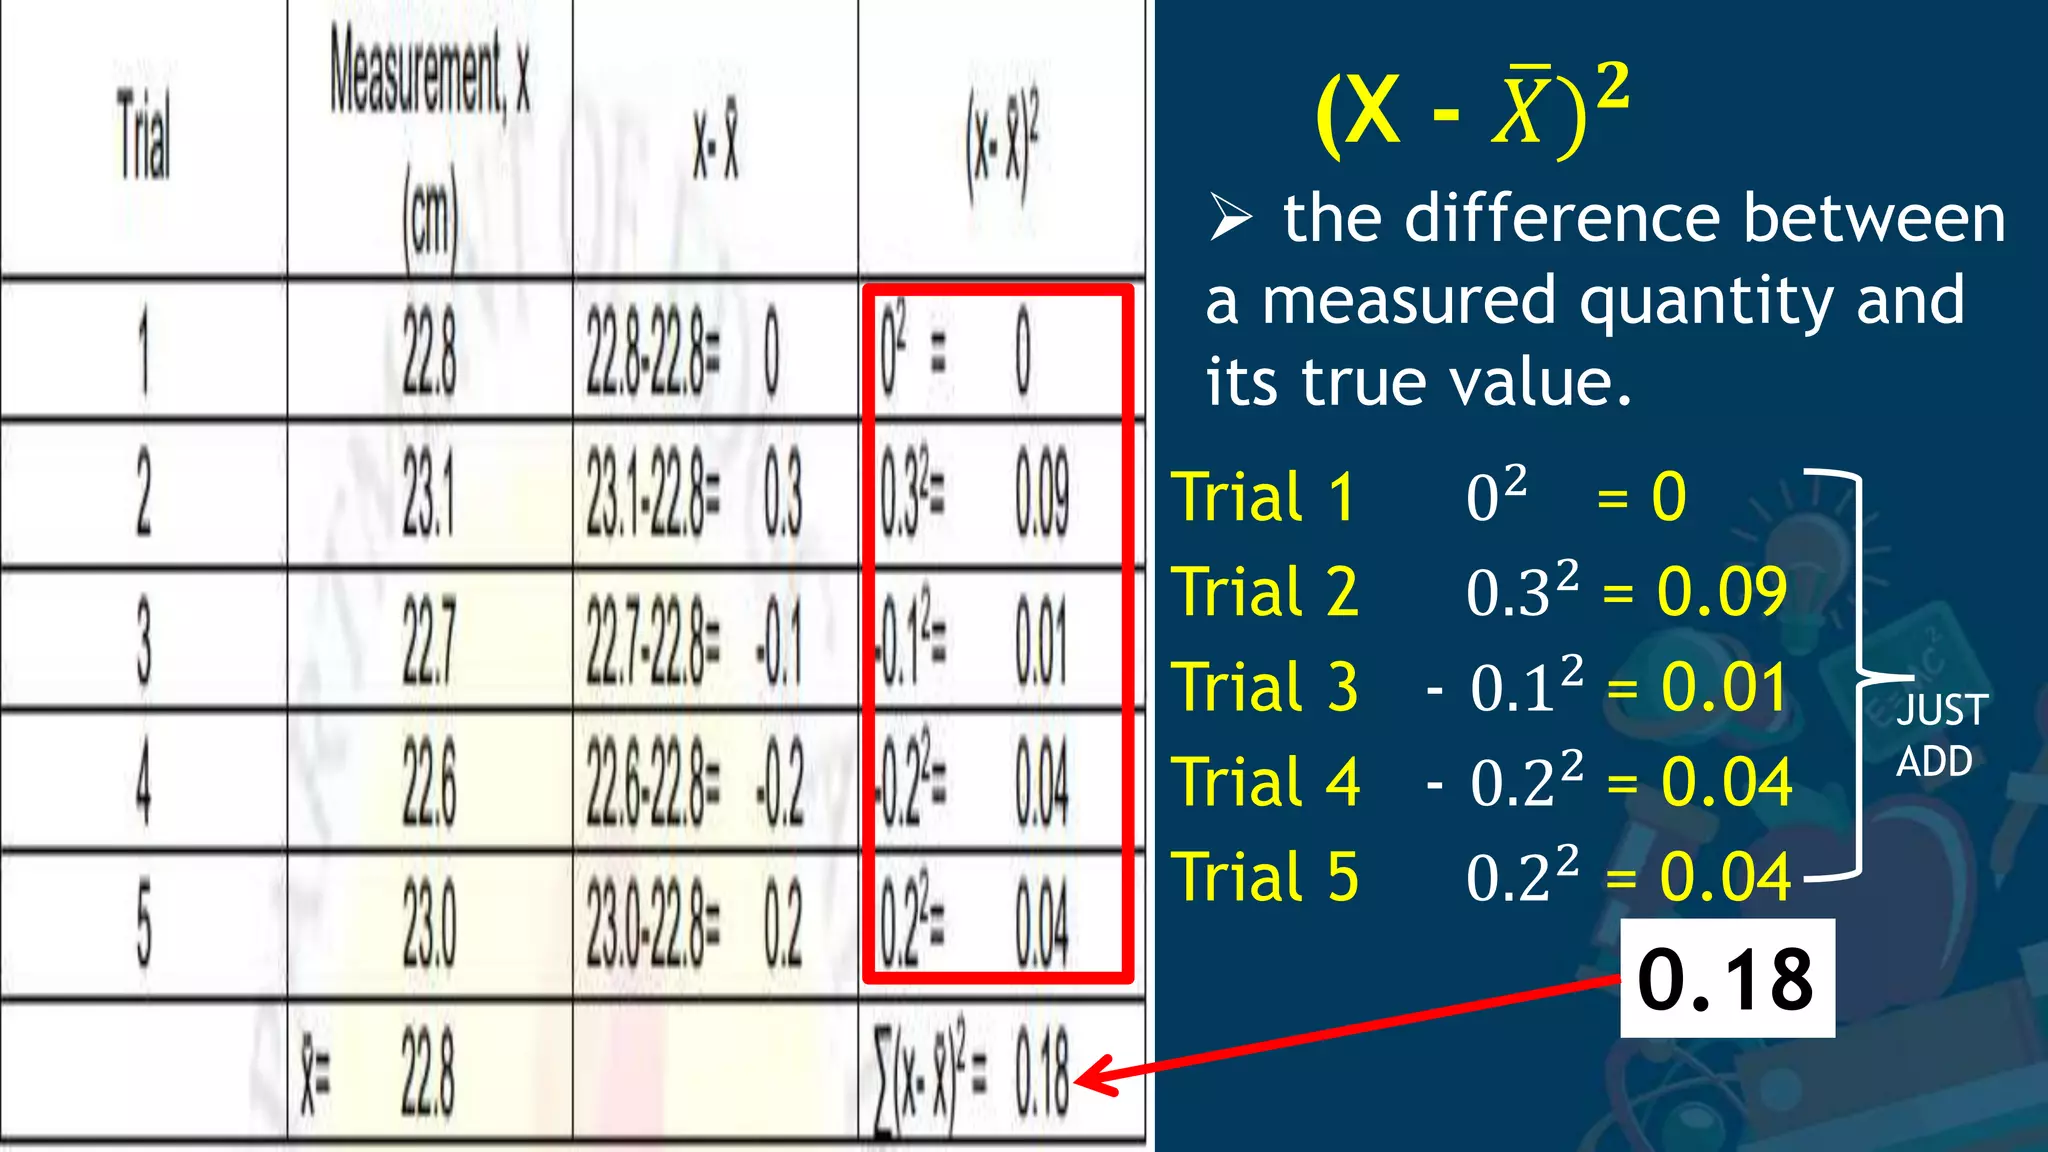
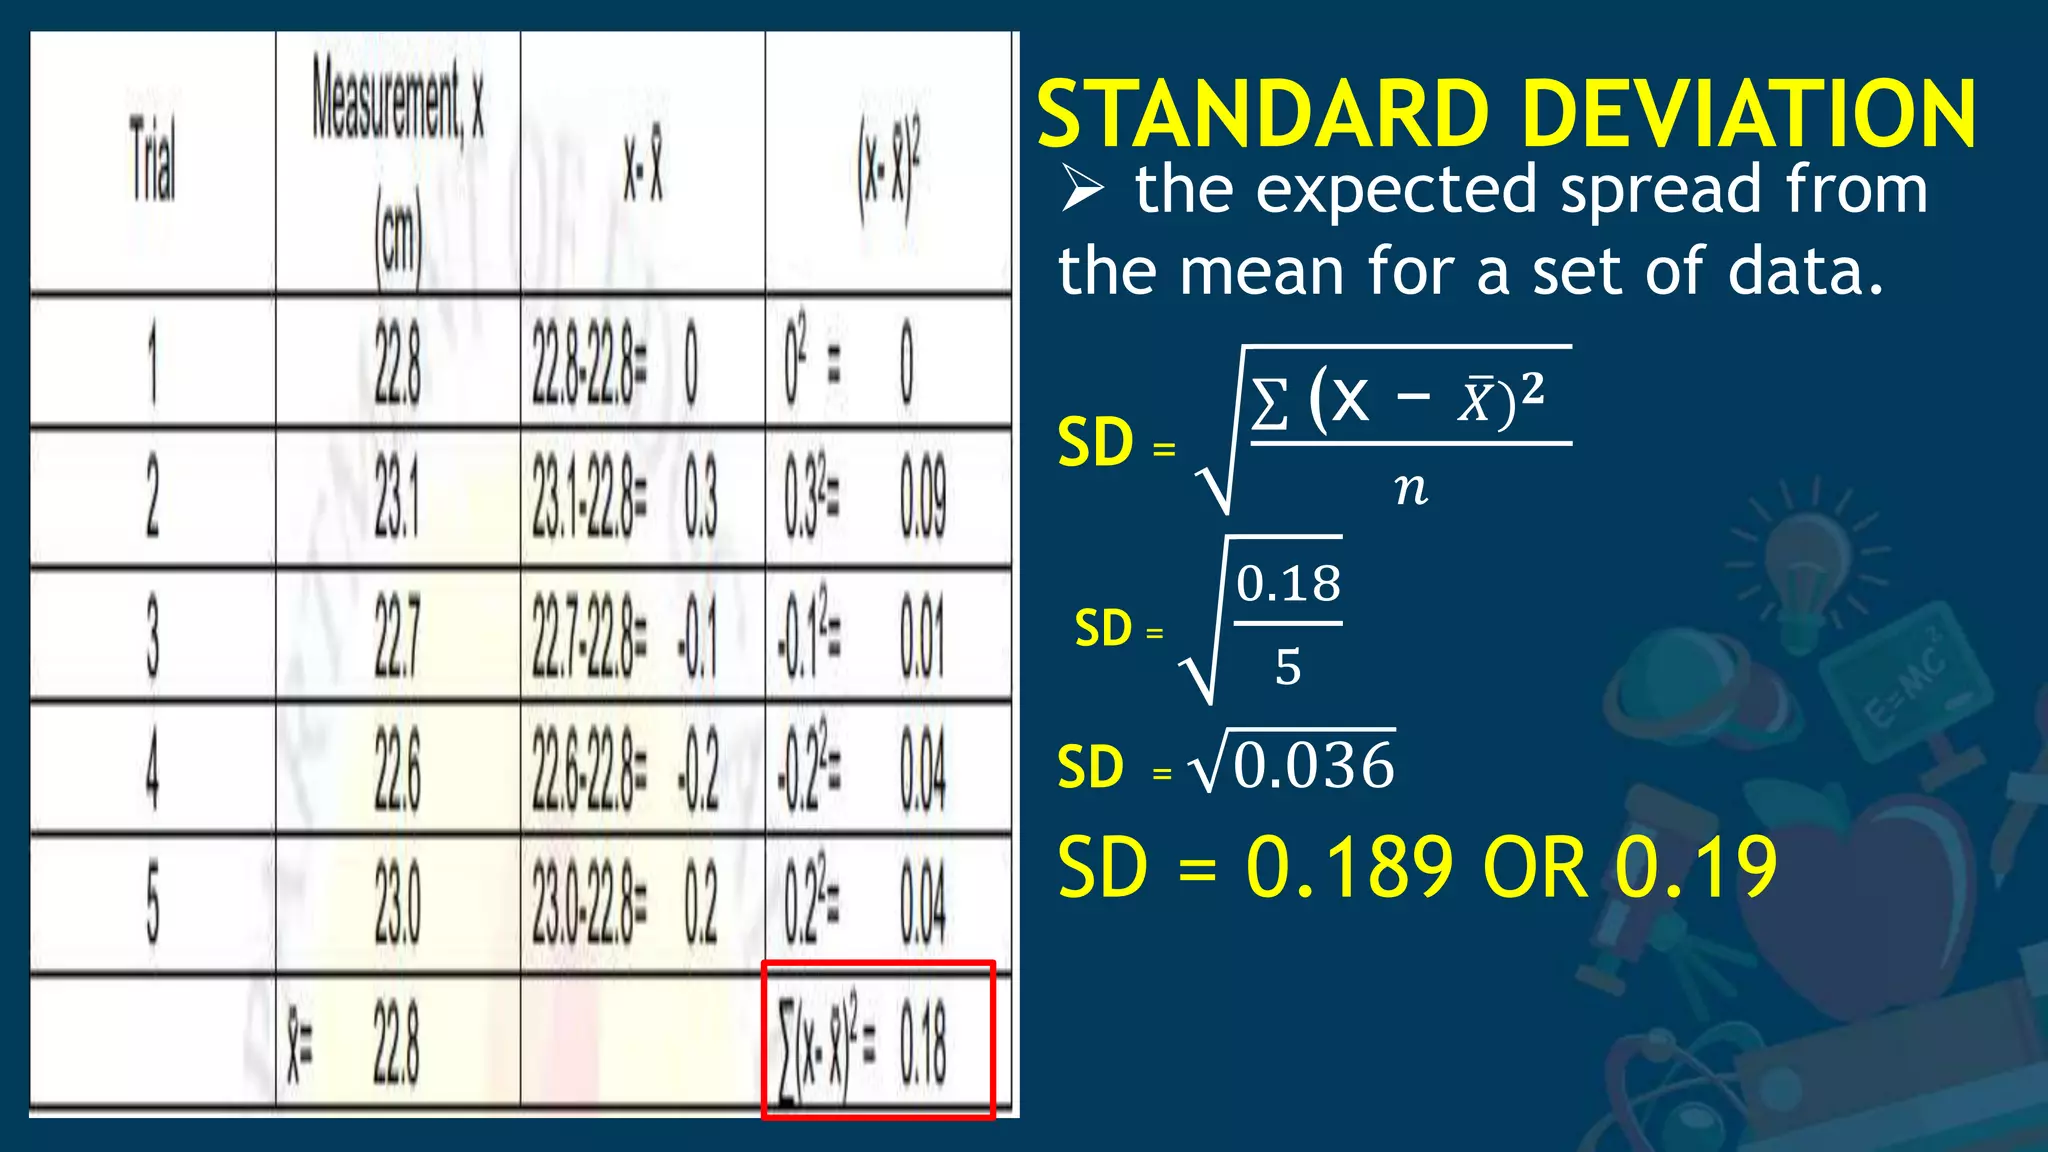
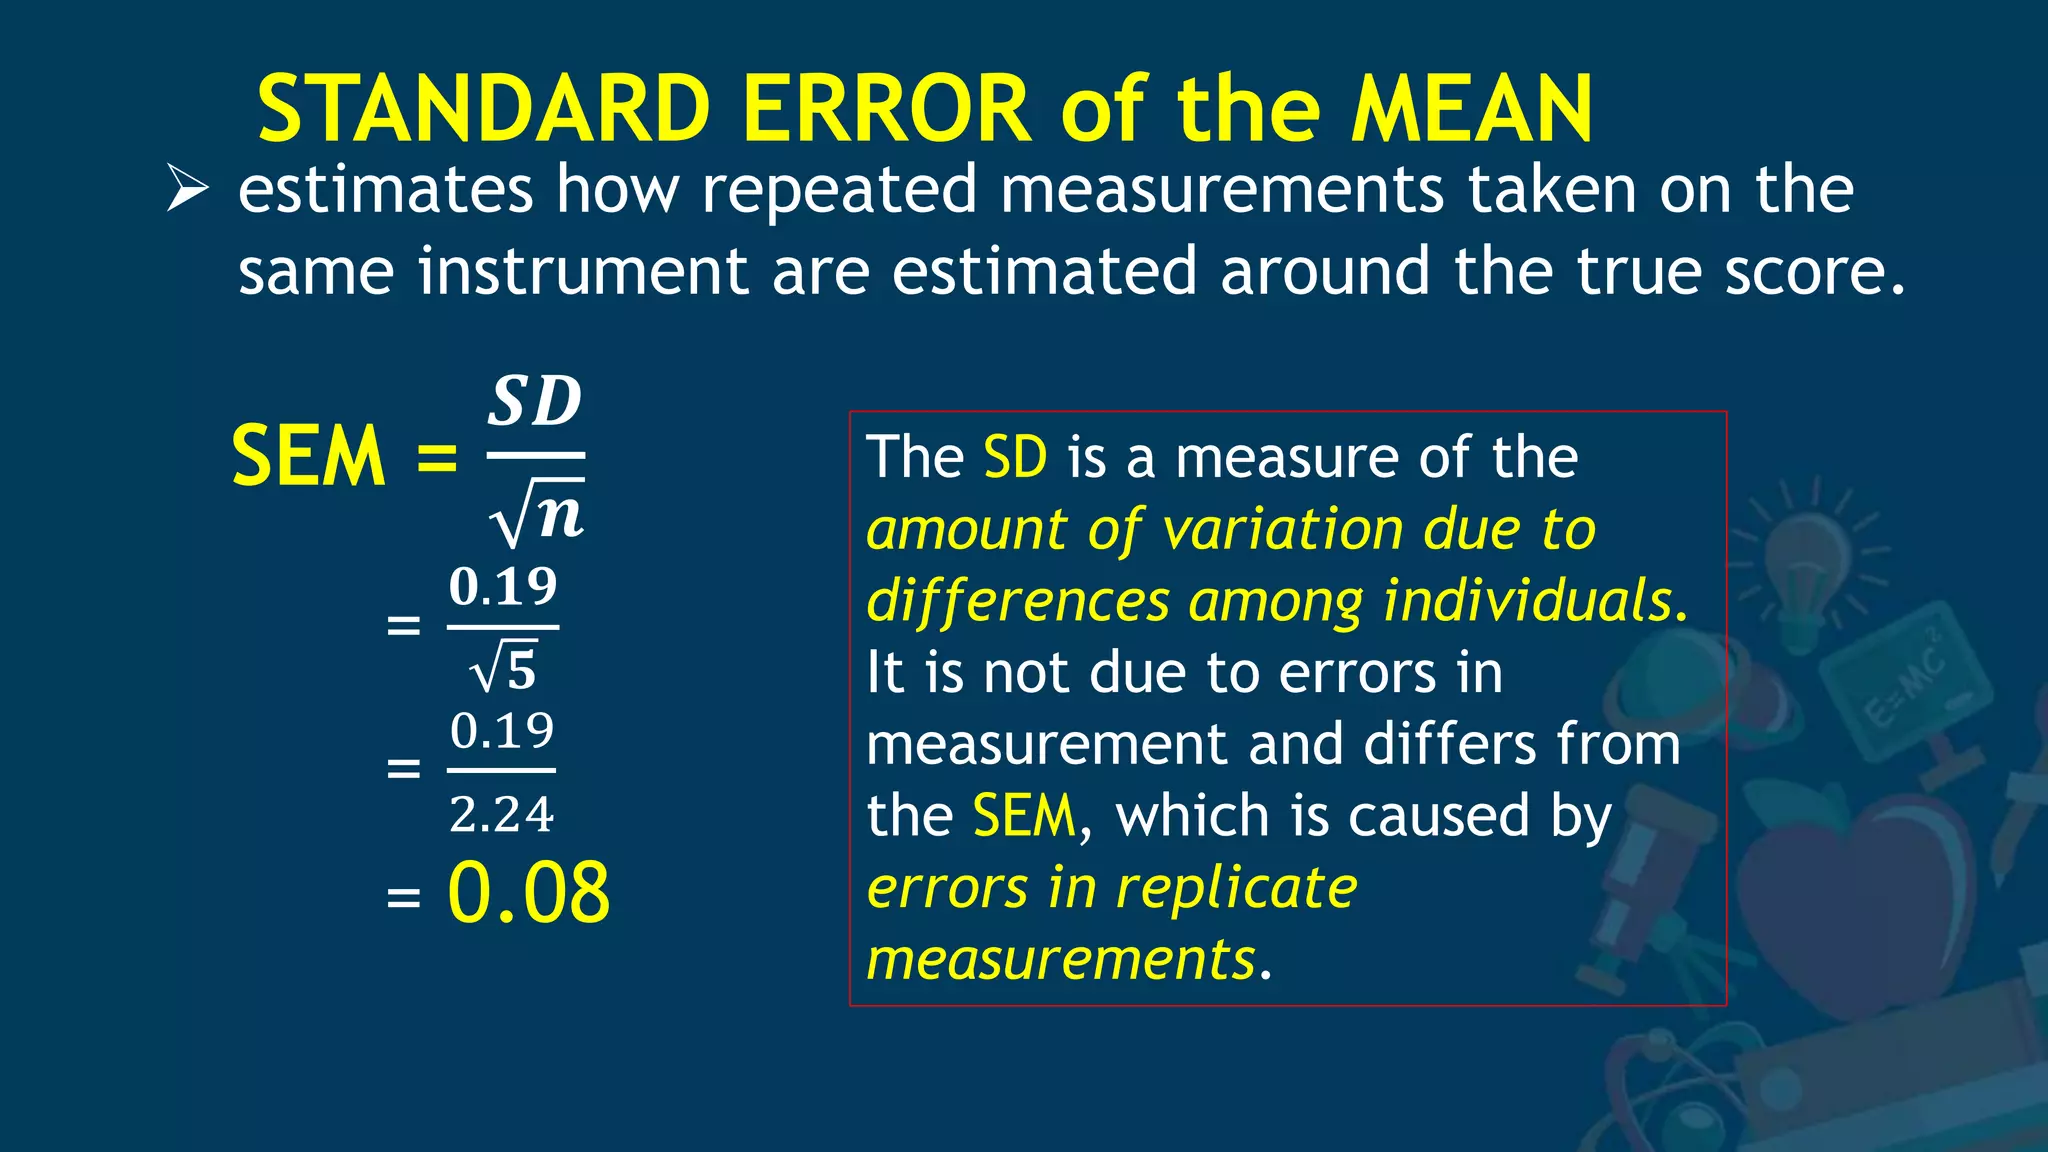
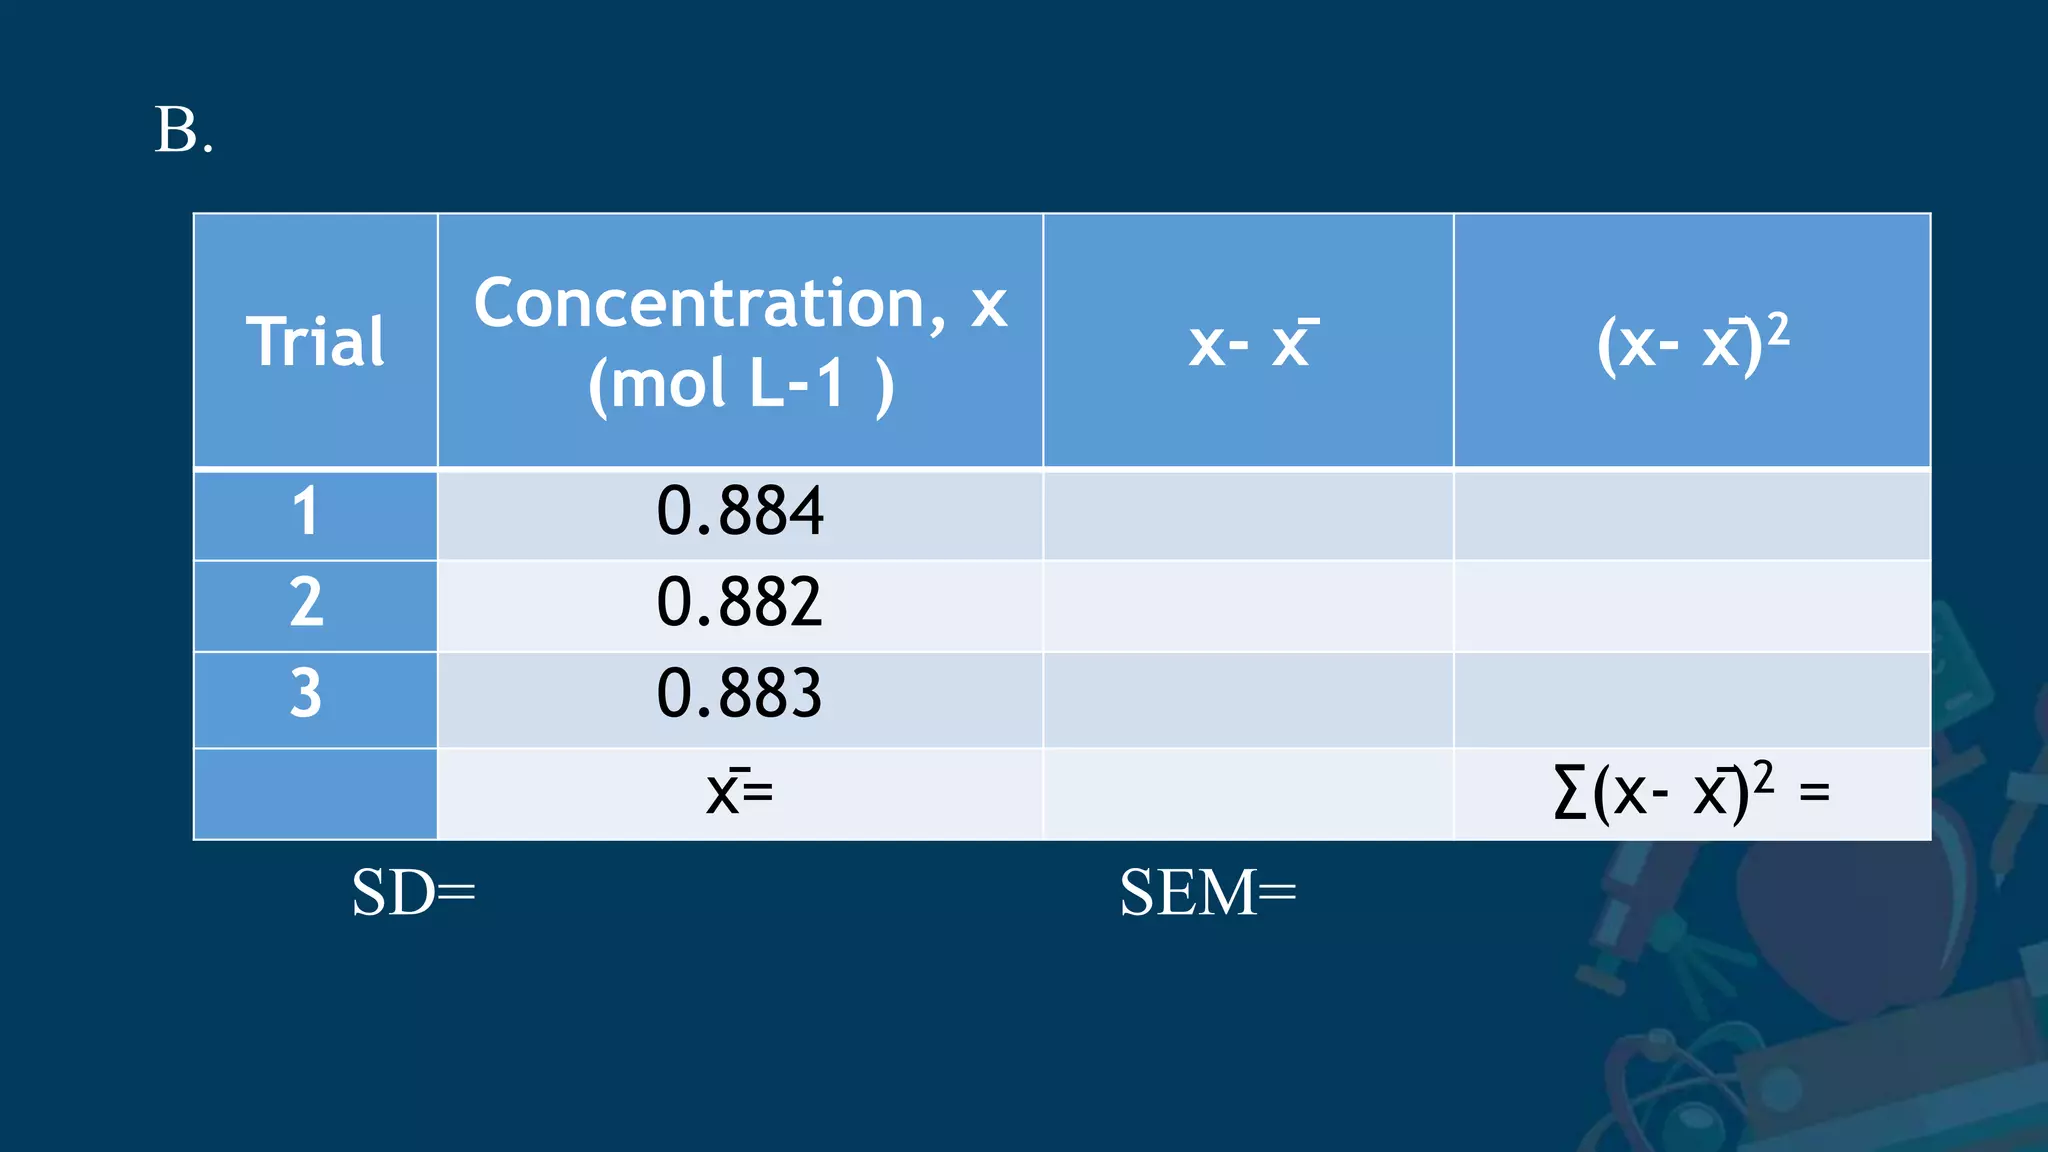
3. Formulas for mean, standard deviation, and standard error are provided to quantify errors from multiple measurements of a single quantity. The standard deviation measures variation in individual measurements while the standard error estimates uncertainty in the mean