gluent.com 1
Modern	Linux	Performance	Tools
Tanel	Poder
a	long	time	computer	performance	geek
gluent.com 2
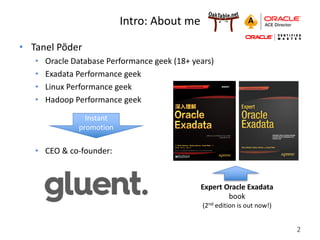
Intro:	About	me
• Tanel	Põder
• Oracle	Database	Performance	geek	(18+	years)
• Exadata	Performance	geek
• Linux	Performance	geek
• Hadoop	Performance	geek
• CEO	&	co-founder:
Expert	Oracle	Exadata	
book
(2nd edition	is	out	now!)
Instant	
promotion
gluent.com 3
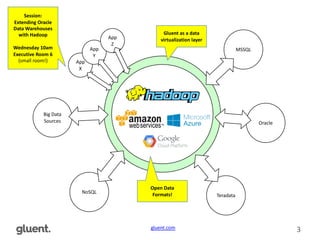
Gluent
Oracle
Teradata
NoSQL
Big	Data	
Sources
MSSQL
App	
X
App	
Y
App	
Z
Gluent	as	a	data	
virtualization	layer
Open	Data	
Formats!
Session:	
Extending	Oracle	
Data	Warehouses	
with	Hadoop
Wednesday	10am
Executive	Room	6
(small	room!)
gluent.com 4
Topics
• Not	much	about	basic	stuff	like	vmstat/iostat
• Also	nothing	about	SystemTap (or	Dtrace)
• Practical	stuff	that	you	can	(relatively)	safely	run	in	production
• Measuring	/	tracing	processes
• Measuring	IO
• Measuring	Memory
• Measuring	CPU
gluent.com 5
Measuring	Process	Activity	- 1
• Strace
• man strace
• strace -p <PID>
• https://fritshoogland.files.wordpress.com/2013/03/profiling_of_oracl
e_using_function_calls.pdf
• SysDig
• sysdig fd.name contains tnsnames
• sysdig -p "%evt.arg.name" proc.name=cat and
evt.type=open
• csysdig
• http://www.sysdig.org/wiki/sysdig-examples/
gluent.com 6
Measuring	Process	Activity	- 2
• /proc	filesystem
• Proc	filesystem	in	Linux	is	like	V$/X$	views	in	Oracle
• man proc
• https://www.kernel.org/doc/Documentation/filesystems/proc.txt
• http://blog.tanelpoder.com/2013/02/21/peeking-into-linux-kernel-
land-using-proc-filesystem-for-quickndirty-troubleshooting/
• psnapper (early	prototype!)
• ./psnapper <seconds> <pid>
• ./psnapper 5 1234
• http://blog.tanelpoder.com/files/scripts/tools/unix/psnapper
gluent.com 7
Measuring	IO
• iostat	in	RHEL	7
• /proc/<PID>/io
• iotop (or	htop,	atop)	
• blktrace /	blkparse (if	we	have	time)
• blktrace -d /dev/sda -o - | blkparse -i -
gluent.com 8
Measuring	Memory
• pmap -x	<PID>
• http://tech.e2sn.com/oracle/performance/unix-performance-
tools/process-memory-matrix (Solaris	example	but	roughly	the	same)
• cat	/proc/PID/smaps
• grep MMUPageSize: /proc/`pgrep dbw0`/smaps |
sort | uniq –c
• https://www.kernel.org/doc/Documentation/filesystems/proc.txt
• Smem
• sudo smem –u
• https://www.selenic.com/smem/
gluent.com 9
Measuring	CPU
• perf	top
• https://fritshoogland.wordpress.com/2012/07/10/the-linux-perf-
utility-with-el-6/
• perf	record	–g	&&	perf	report
• http://www.brendangregg.com/perf.html
• http://externaltable.blogspot.jp/2014/05/flame-graphs-for-
oracle.html
• perf	stat
• http://blog.tanelpoder.com/2015/08/09/ram-is-the-new-disk-and-
how-to-measure-its-performance-part-1/
gluent.com 10
Linux	performance	references
• Brendan	Gregg:
• http://www.brendangregg.com/linuxperf.html
• Luca	Canali’s articles:
• https://db-blog.web.cern.ch/blog/luca-canali/2015-12-extended-
stack-profiling-ideas-tools-and-comments
• Frits	Hoogland:
• https://fritshoogland.wordpress.com/
gluent.com 11
Thanks!
http://blog.tanelpoder.com
tanel@tanelpoder.com
@tanelpoder
We	are	hiring	developers	&	data	engineers!!!
http://gluent.com

Modern Linux Performance Tools for Application Troubleshooting