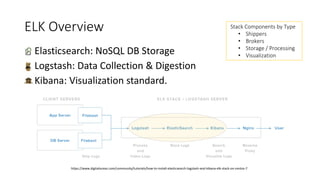
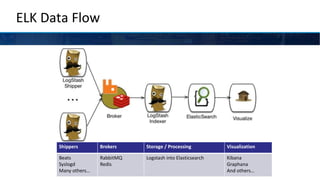
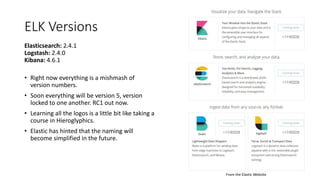
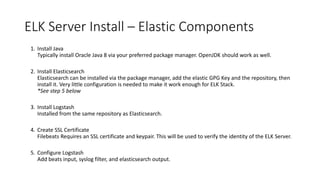
We're talking about serious log crunching and intelligence gathering with Elastic, Logstash, and Kibana.
ELK is an end-to-end stack for gathering structured and unstructured data from servers. It delivers insights in real time using the Kibana dashboard giving unprecedented horizontal visibility. The visualization and search tools will make your day-to-day hunting a breeze.
During this brief walkthrough of the setup, configuration, and use of the toolset, we will show you how to find the trees from the forest in today's modern cloud environments and beyond.
2. Mathew Beane
@aepod
Director of Systems Engineering - Robofirm
Magento Master and Certified Developer
Zend Z-Team Volunteer – Magento Division
Family member – 3 Kids and a Wife
Linux since 1994 (Slackware 1.0)
PHP since 1999
Life long programmer and sysamin
3. Todays Plan
• Stack Overview
• Installation
• Production Considerations
• Logstash
• Log Shipping
• Visualizations (Kibana)
5. ELK Overview
• Elasticsearch: NoSQL DB Storage
• Logstash: Data Collection & Digestion
• Kibana: Visualization standard.
https://www.digitalocean.com/community/tutorials/how-to-install-elasticsearch-logstash-and-kibana-elk-stack-on-centos-7
Stack Components by Type
• Shippers
• Brokers
• Storage / Processing
• Visualization
6. ELK Data Flow
Shippers Brokers Storage / Processing Visualization
Beats
Syslogd
Many others…
RabbitMQ
Redis
Logstash into Elasticsearch Kibana
Graphana
And others…
7. ELK Versions
Elasticsearch: 2.4.1
Logstash: 2.4.0
Kibana: 4.6.1
• Right now everything is a mishmash of
version numbers.
• Soon everything will be version 5, version
locked to one another. RC1 out now.
• Learning all the logos is a little bit like taking a
course in Hieroglyphics.
• Elastic has hinted that the naming will
become simplified in the future.
From the Elastic Website
9. ELK Components Stack
• Elasticsearch: Cluster ready, for nice horizontal and vertical
scaling.
• Logstash: Chain together multiple instances for super powered
log pipelines.
• Kibana: Stacking is typically not needed. Although you will
want to plug in other visualizers.
Other Stack Components
• Brokers: Redis, RabbitMQ
• Logshippers: Beats, rsyslogd and others.
• Visualization: Utilize Graphana or Kibana plugins, the sky is the
limit.
• X-Pack: Security, alerting, additional graphing and reporting
tools.
Elk are not known for their stack-ability.
10. • Open Source
• Search/Index Server
• Distributed Multitenant Full-Text Search
• Built on top of Apache Lucene
• Restful API
• Schema Free
• Highly Available / Clusters Easily
• json Query DSL exposes Lucene’s query
syntax
https://github.com/elastic/elasticsearch
11. Logstash
• Data Collection Engine
• Unifies Disparate Data
• Ingestion Workhorse for ELK
• Pluggable Pipeline:
• Inputs/Filters/Outputs
• Mix and Match as needed
• 100’s of Extensions and Integrations
• Consume web services
• Use Webhooks (Github,Jira,Slack)
• Capture HTTP Endpoints to monitor web
applications.
https://github.com/elastic/logstash
12. Beats
• Lightweight - Smaller CPU / memory footprint
• Suitable for system metrics and logs.
• Configuration is easy, one simple YAML
• Hook it into Elasticsearch Directly
• Use Logstash to enrich and transport
• libbeat and plugins are written entirely in
Golang
https://github.com/elastic/beats
Introducing Beats: P-Diddy and Dr. Dre
showing Kibana Dashboard
13. • Flexible visualization and exploration
tool
• Dashboards and widgets make
sharing visualizations possible
• Seamless integration with
Elasticsearch
• Learn Elasticsearch Rest API using the
visualizer
https://github.com/elastic/kibana
Typical Kabana Dashboard: Showing Nginx Proxy information
Nginx Response Visualization from:
http://logz.io/learn/complete-guide-elk-stack/
14. ELK Challenges
• Setup and architecture complexity
• Mapping and indexing
• Conflicts with naming
• Log types and integration
• Capacity issues
• Disk usage over time
• Latency on log parsing
• Issues with overburdened log servers
• Logging cluster health
• Cost of infrastructure and upkeep
15. • ELK as a Service
• 5 Minutes setup – Just plug in your shippers
• 14 day no strings attached trial
• Feature Rich Enterprise-Grade ELK
Alerts
S3 Archiving
Multi-User Support
Reporting
Cognitive Insights
Up and running in minutes
Sign up in and get insights into
your data in minutes
Production ready
Predefined and community designed
dashboard, visualization and alerts are
all bundled and ready to provide
insights
Infinitely scalable
Ship as much data as you want
whenever you want
Alerts
Unique Alerts system proprietary
built on top of open source ELK
transform the ELK into a proactive
system
Highly Available
Data and entire data ingestion pipeline
can sustain downtime in full datacenter
without losing data or service
Advanced Security
360 degrees security with role
based access and multi-layer
security
17. ELK Example Installation
https://www.digitalocean.com/community/tutorials/how-to-install-elasticsearch-logstash-and-kibana-elk-stack-on-centos-7
https://www.digitalocean.com/community/tutorials/how-to-install-elasticsearch-logstash-and-kibana-elk-stack-on-ubuntu-14-04
ELK Stack Server
• Java 8 (Prerequisite)
• Elasticsearch
• Logstash
• Kibana
• Nginx Fastcgi Proxy
1. Install Server Stack (30 Minutes)
1. Install Java
2. Install Elasticsearch
3. Install Logstash
4. Create SSL Certificate
5. Configure Logstash
2. Install Kabana (30 Minutes)
1. Install /Configure Elastic Kabana
2. Install / Configure Nginx Proxy
Client Servers
• Elastic Beats
• Filebeat
Time per Server (20 Minutes)
1. Add SSL Certificate
2. Install Elastic Beats
3. Configure Filebeats
4. Start Beats service
Kibana Config & Explore
1. Kibana Configuration (5 Minutes)
1. Configure Kabana Index
2. Add Filebeat Index Template
3. Start using Kabana
2. Kibana Explore
1. Using collected metrics create a search
2. Use the search to create visualizations
3. Use visualizations to create
dashboards
* Time to complete results may vary
18. ELK Server Install – Elastic Components
1. Install Java
Typically install Oracle Java 8 via your preferred package manager. OpenJDK should work as well.
2. Install Elasticsearch
Elasticsearch can be installed via the package manager, add the elastic GPG Key and the repository, then
install it. Very little configuration is needed to make it work enough for ELK Stack.
*See step 5 below
3. Install Logstash
Installed from the same repository as Elasticsearch.
4. Create SSL Certificate
Filebeats Requires an SSL certificate and keypair. This will be used to verify the identity of the ELK Server.
5. Configure Logstash
Add beats input, syslog filter, and elasticsearch output.
19. ELK Server - Logstash Configuration
Input
Filter
Output
20. ELK Server Install – Kibana Install
1. Install Kibana
The elastic GPG should have been added during the initial
install. Install from the package manager.
2. Configure and Start Kibana
In the kibana.yml change server.host to be localhost only,
because nginx will be connect to it via localhost.
3. Install Nginx
Typical Nginx install, you may want apache2-utils which
provides htpasswd.
4. Configure and Start Nginx
Basic Nginx proxy configuration, Kibana handles the
requests.
21. ELK Install – Client Stack
1. Copy SSL Certificate in from Server
You will want to place the crt file from the certificate you
generated in in /etc/pki/tls/certs/
2. Install Elastic Beats
As before, you will need to add the GPG Key and Repository
before installing any of the beats. Install the Filebeat package
and move onto the configuration.
3. Configure and Start Filebeat for logs
Take a look at the /etc/filebeat/filebeat.yml and modify the
sections according to the Digital Ocean blog article.
1. Modify Prospectors to include /var/log/secure and
/var/log/messages
2. Modify the document type for these to be syslog
*Matches Logstash type
3. Modify the logstash host to reflect your logstash server
4. Add your certificate path to the tls section
23. ELK Install – Kibana Config
1. Initialize Kabana Index
2. Install filebeat-index-template.json into Kabana
3. Start Using Kabana
• Using collected metrics create a search
• Use the search to create visualizations
• Use visualizations to create dashboards
25. Elasticsearch at Production Scale
• OS Level Optimization:
Required to run properly as it is not
performant out of the box.
• Index Management:
Index deletion is an expensive operation ,
leading to more complex log analytics
solutions.
• Shard Allocation:
Optimizing inserts and query times requires
attention.
• Cluster Topology and Health
Elastic search clusters require 3 Master
nodes, Data nodes and Client nodes. It
clusters nicely but it requires some finesse.
26. Elasticsearch at Production Scale
• Capacity Provisioning:
Log bursts, Elasticsearch catches fire. This can
also cause cost stampeding.
• Dealing with Mapping Conflicts:
Mapping conflicts, and other sync issues need
to be detected and addressed.
• Disaster Recovery:
Archiving data, allowing for a recovery in case
of a disaster or critical failure.
• Curation:
Even more complex index management,
creating, optimizing and sometimes just
removing old indices.
27. Logstash at Production Scale
• Data parsing:
Extracting values from text messages and enhancing it.
• Scalability:
Dealing with increase of load on the logstash servers.
• High Availability:
Running logstash in a cluster is less trivial than
Elasticsearch.
• Burst Protection:
Buffering using Redis, RabbitMQ, Kafka or other broker
is required in front of logstash.
• Configuration Management:
Changing configurations without data loss can be a
challenge.
More Reading: https://www.elastic.co/guide/en/logstash/current/deploying-and-scaling.html
28. Kibana at Production Scale
• Security:
Kibana has no protection by default. Elastic Shield
offers very robust options.
• Role Based Access:
Restricting users to roles is also supported via
Elastic Shield if you have Elastic Support.
• High Availability:
Kibana clustering for high availability or
deployments is not difficult.
• Monitoring:
Monitoring is offered free in the X-Pack, this allows
for detailed statistics on the ELK stack.
• Alerts:
Take monitoring and create alerts when things go
bad. This is part of the X-Pack.
• Dashboards:
Building Dashboards and visualizations is tricky,
will take a lot of time and will require special
knowledge.
• ELK Stack Health Status
This is not build into Kibana, there is a need for
basic anomaly detection.
30. Logstash Pipeline
Event processing pipeline has three stages:
• Input: These ingest data, many options exists for
different types
• Filter: Take raw data and makes sense of it, parsing it
into a new format
• Output: Sends data to a stream, file, database or other
places.
Input and output support codecs that allow you to
encode/decode data as it enters/exits the pipeline.
31. Logstash Processing Pipeline
https://www.elastic.co/guide/en/logstash/current/pipeline.html
Input Filter Output
Beats: The example uses beats to
bring in syslog messages from filebeat
on the clients in its native format.
Grok: Used to split up the messages into
fields
Date: Used to process the timestamp into a
date field
Elasticsearch: Stored data, able
picked up by Kabana using the
default json codec
33. Logstash Inputs
• Beats: Events from Elastic Beats framework
• Elasticsearch: Reads results from Elasticsearch
• Exec: Captures the output of a shell command
• File: Streams events from a file
• Github: Read events from a github webhook
• Heroku: Events from the logs of a Heroku app
• http: Events over HTTP or HTTPS
• irc: Read events from an IRC server
• pipe: Stream events from a command pipe
• Puppet_factor: Read puppet facts
• RabbitMQ: Pull from a RabbitMQ Exchange
• Redis: Read events from redis instance
• Syslog: Read syslog messages
• TCP: Read events from TCP socket
• Twitter: Read Twitter Steaming API events
• UDP: Read events over UDP
• Varnishlog: Read varnish shared memory log
https://www.elastic.co/guide/en/logstash/current/input-plugins.html
34. Logstash Filters
• Aggregate: Aggregate events from a single task
• Anonymize: Replace values with consistent hash
• Collate: Collate by time or count
• CSV: Convert csv data into fields
• cidr: Check IP against network blocks
• Clone: Duplicate events
• Date: Parse dates into timestamps
• DNS: Standard reverse DNS lookups
• Geoip: Adds Geographical information from IP
• Grok: Parse data using regular Expressions
• json: Parse JSON events
• Metaevent: Add fields to an event
• Multiline: Parse multiline events
• Mutate: Performs mutations
• Ruby: Parse ruby code
• Split: Split up events into distinct events
• urldecode: Decodes URL-encoded fields
• xml: Parse xml into fields
https://www.elastic.co/guide/en/logstash/current/filter-plugins.html
35. • CSV: Write lines in a delimited file.
• Cloudwatch: AWS monitoring integration.
• Email: Email with the output of the event.
• Elasticsearch: The most commonly used.
• Exec: Run a command based on the event data.
• File: Glob events into a file on the disk.
• http: Send events to an http endpoint.
• Jira: Create issues in jira based on events.
• MongoDB: Write events into MongoDB
• RabbitMQ: Send into a RabbitMQ exchange
• S3: Store as files in an AWS s3 bucket.
• Syslog: Sends event to a syslog server.
• Stdout: Use to debug your logstash chains.
• tcp/udp: Writes over socket, typically as json.
Logstash Outputs
https://www.elastic.co/guide/en/logstash/current/output-plugins.html
36. Enriching Data with Logstash Filters
• Grok: Uses regular expressions to parse strings into fields, this is
very powerful and easy to use. Stack grok filters to be able to do
some very advanced parsing.
Handy Grok Debugger: http://grokdebug.herokuapp.com/
• Drop: You can drop fields from an event, this can be very useful
if you are trying to focus your filters.
• Elasticsearch: Allows for previously logged data in logstash to be
copied into the current event.
• Translate: Powerful replacement tool based on dictionary
lookups from a yaml or regex.
38. Log Shipping Overview
Log shippers pipeline logs into logstash or directly into Elasticsearch. There are
many different options with overlapping functionality and coverage.
• Logstash: Logstash can be thought of as a log shipper and it is commonly used.
• Rsyslog: Standard logshipper, typically already installed on most linux boxes.
• Beats: Elastic’s newest addition to log shipping, lightweight and easy to use.
• Lumberjack: Elastic’s older log shipper, Beats has replaced this as the standard
Elastic solution.
• Apache Flume: Distributed log collector, less popular among the ELK community
39. Logstash - Brokers
• A must for production and larger environments.
• Rsyslog & Logstash built-in queuing is not enough
• Easy to setup, very high impact on performance
• Redis is a good choice with standard plugins
• RabbitMQ is also a great choice
• These function as INPUT/OUTPUT logstash plugins
http://www.nightbluefruit.com/blog/2014/03/managing-logstash-with-the-redis-client/
http://dopey.io/logstash-rabbitmq-tuning.html
40. Rsyslog
• Logstash Input Plugin for Syslog works well.
• Customize Interface, Ports, Labels
• Easy to setup
• Filters can be applied in logstash or in rsyslog
https://www.elastic.co/guide/en/logstash/current/plugins-inputs-syslog.html
Logstash Input Filter
Kibana view of syslog events.
41. Beats – A Closer Look
• Filebeat: Used to collect log files.
• Packetbeat: Collect Network Traffic
• Topbeat: Collect System Information
• Community Beats:
Repo of Community Beats:
https://github.com/elastic/beats/blob/master/libbeat/docs/communitybeats.asciidoc
Beats Developers Guide:
https://www.elastic.co/guide/en/beats/libbeat/current/new-beat.html
o Apachebeat
o Dockerbeat
o Execbeat
o Factbeat
o Nginxbeat
o Phpfpmbeat
o Pingbeat
o Redisbeat
44. Kibana Overview
Kibana Interface has 4 Main sections:
• Discover
• Visualize
• Dashboard
• Settings
Some sections have the following options:
• Time Filter: Uses relative or absolute time ranges
• Search Bar: Use this to search fields, entire messages. Its very powerful
• Additional save/load tools based on search or visualization.
45. Kibana Search Syntax
• Search provides an easy way to select groups of messages.
• Syntax allows for booleans, wildcards, field filtering, ranges,
parentheses and of course quotes
• https://www.elastic.co/guide/en/kibana/3.0/queries.html
• This just exposes Lucene Query Parser Syntax
Example:
type:“nginx-access” AND agent:“chrome”
46. Elasticsearch
Query Parser Syntax
• SOLR and Elasticsearch both use this
• Terms are the basic units, single terms and
phrase.
• Queries are broken down into terms and
phrases, these can be combined with Boolean
operators.
• Supports fielded data
• Grouping of terms or fields
• Wildcard searches using the ? Or * globs.
• Supports advanced searches
• Fuzzy Searches
• Proximity Searches
• Range Searches
• Term Boosting
https://lucene.apache.org/core/2_9_4/queryparsersyntax.html
48. Kibana Visualize
• These are widgets that can be used on the dashboards
• Based on the fieldsets in your index
• Complex subject, details are outside of the scope of
this presentation.
https://www.elastic.co/guide/en/kibana/current/visualize.html
49. Kibana Dashboard
• Built from visualizations and searches
• Can be filtered with time or search bar
• Easy to use, adequate tools to create nice dashboards
• Requires a good visualizations, start there first.
50. Grafana • Immensely Rich Graphing with lots more options compared to Kibana
• Mixed style graphs with easy templating, reusable and fast
• Built in authentication, allows for users, roles and organizations and LDAP support
• Annotations and Snapshot Capabilities.
• Kibana has better Discovery
51. •Easy to setup ELK initially
•Scaling presents some challenges, solutions exist and are well documented
•Using ELK in production requires several additional components.
•Kabana and other visualizations are easy to use but are a deep rabbit hole
•Setup ELK and start playing today
Recap
53. Thanks / QA
• Mathew Beane <mbeane@robofirm.com>
• Twitter: @aepod
• Blog: http://aepod.com/
Rate this talk:
https://joind.in/talk/6a7c8
Thanks to :
My Family
Robofirm
Midwest PHP
The Magento Community
Fabrizo Branca
Tegan Snyder
Logz.io
Digital Ocean
Last but not least: YOU, for attending.
ELK:
Ruminating On Logs
54. Attribution
• Adobe Stock Photos:
• Elk Battle
• Complex Pipes
• Old Logjam
• ELK simple flowchart
http://www.sixtree.com.au/articles/2014/intro-to-elk-
and-capturing-application-logs/
• Drawing in Logs
http://images.delcampe.com/img_large/auction/000/08
7/301/317_001.jpg
• Forest Fire
http://www.foresthistory.org/ASPNET/Policy/Fire/Suppr
ession/FHS5536_th.jpg
• Log Train
http://explorepahistory.com/kora/files/1/2/1-2-1323-
25-ExplorePAHistory-a0k9s1-a_349.jpg
• Docker Filebeat Fish
https://github.com/bargenson/docker-filebeat
• ELK Wrestling
http://www.slideshare.net/tegud/elk-wrestling-leeds-
devops
• Drawing in Logs
http://images.delcampe.com/img_large/auction/000/087/
301/317_001.jpg
• Log Flume Mill
http://historical.fresnobeehive.com/wp-
content/uploads/2012/02/JRW-SHAVER-HISTORY-MILL-
STACKS.jpg
• Log Shipping Pie Graph
https://sematext.files.wordpress.com/2014/10/log-
shipper-popularity-st.png
• Logging Big Load
https://michpics.files.wordpress.com/2010/07/logging-a-
big-load.jpg
Editor's Notes
1. think deeply about something.2. (of a ruminant) chew the cud
Life long computer geek
First computer build 1980’s
First linux install 1994 (slackware linux 1.0 days)
Learned solaris for video game industry work
Moved to Server Room work
PHP in 2000
Ecommerce in 2006
Magento 2008
Logstash and Log shippers!!!!
V5.0 is RC1 now, and in good shape.
Oh look, yet another round of new Logos.
Elastic Cloud starts at $45 / month, has most the x-pack features.
Pricing on x-pack pricing for gold or platinum upon request.
Enterprise features, nice looking gui and a 14 day free no strings attached trial.
Monitoring is the only free component.
Logstash is very flexible, you can do HA and other configurations easily.
DSL = Domain Specific Language
Go is an open source programming language that makes it easy to build simple, reliable, and efficient software.
Mention truck factor
Cognitive Insights is an example of one of the many benefits to using Logz.io
From beats, through the syslog filter into the elasticsearch output.
Input -> Filter -> output (come back to this in more detail later)
More about filters later, but these match to types that you can send from beats.
TLS = Transport Layer Security
We will go over a few of the pain points, and interesting parts of trying to build ELK out to production scale.
~4-6 weeks of work
~4-6 weeks of work
~4-6 weeks of workGiven all this, this is why something like logz.io has worked out well for us.
~4-6 weeks of work
Common mutations: join, lowercase/uppercase, remove_tag, remove_field, replace, split, strip
Typical output codec is jsonish
S3 bucket streaming in/out very handy!
You can chain together as many of these as you want.
We are only going to look briefly at rsyslog and Beats. Does anyone use lumberjack or flume still?
Rsyslog has its own filtering and abilities around that.
Beats is written in Golang, most are very well documented.
Typical Workflow: Create searches, make visualizations on them and add them to dashboards.
This is the key to figuring out the underlying search methods
Fuzzy: edit distance (Levenshtein Distance)
Proximity: within this many words from another word.
Range: dates, and alphabetical etc
Boosting: used to make a term more relavent
Build searches to use in your visualizations and dashboards
Learn more about the data structure quickly
Dig into fields that you have ingested using logstash
We will go over a few of the pain points, and interesting parts of trying to build ELK out to production scale.