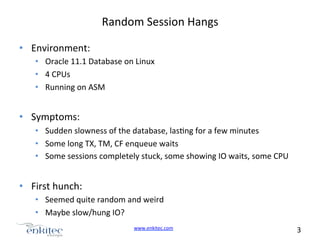
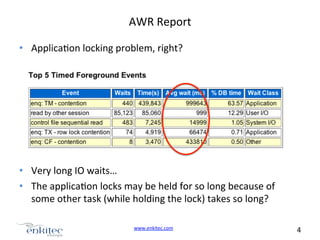
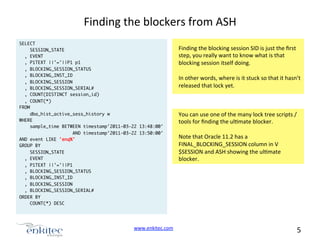
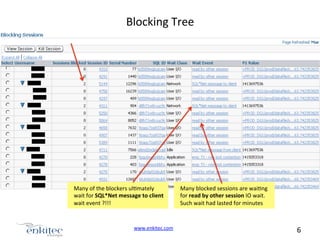
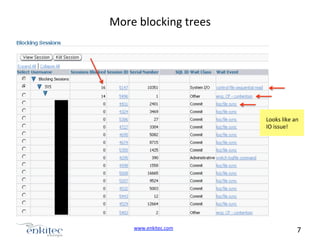
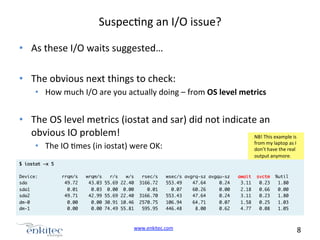
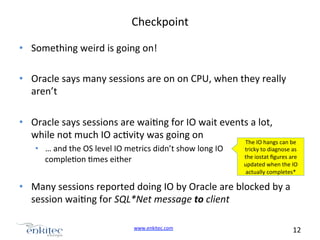
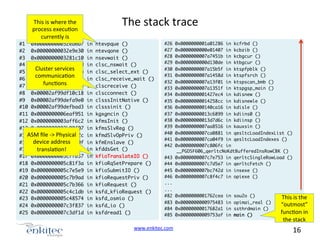
This document summarizes a series of performance issues seen by the author in their work with Oracle Exadata systems. It describes random session hangs occurring across several minutes, with long transaction locks and I/O waits seen. Analysis of AWR reports and blocking trees revealed that many sessions were blocked waiting on I/O, though initial I/O metrics from the OS did not show issues. Further analysis using ASH activity breakdowns and OS tools like sar and vmstat found high apparent CPU usage in ASH that was not reflected in actual low CPU load on the system. This discrepancy was due to the way ASH attributes non-waiting time to CPU. The root cause remained unclear.
This is a recording of my Advanced Oracle Troubleshooting seminar preparation session - where I showed how I set up my command line environment and some of the main performance scripts I use!
Any DBA from beginner to advanced level, who wants to fill in some gaps in his/her knowledge about Performance Tuning on an Oracle Database, will benefit from this workshop.
Troubleshooting Complex Oracle Performance Problems with Tanel PoderTanel Poder
Troubleshooting Complex Oracle Performance Problems hacking session & presentation by Tanel Poder.
This presentation is about a complex performance issue where the initial symptoms pointed somewhere else than the root cause. Only when systematically following through the troubleshooting drilldown method, we get to the root cause of the problem. This session aims to help you understand (and reason about) the Oracle’s multi-process & multi-layer system behavior, preparing you for independent troubleshooting of such complex performance issues in the future.
Video recordings of this presentation are in my YouTube channel:
1) Hacking Session: https://www.youtube.com/watch?v=INQewGJMdCI
2) Presentation: https://www.youtube.com/watch?v=aaHZ8A8Ygdg
Tanel's blog and training information: https://blog.tanelpoder.com/seminar
Session aims at introducing less familiar audience to the Oracle database statistics concept, why statistics are necessary and how the Oracle Cost-Based Optimizer uses them
This presentation talks about the different ways of getting SQL Monitoring reports, reading them correctly, common issues with SQL Monitoring reports - and plenty of Oracle 12c-specific improvements!
Tanel Poder - Performance stories from Exadata MigrationsTanel Poder
Tanel Poder has been involved in a number of Exadata migration projects since its introduction, mostly in the area of performance ensurance, troubleshooting and capacity planning.
These slides, originally presented at UKOUG in 2010, cover some of the most interesting challenges, surprises and lessons learnt from planning and executing large Oracle database migrations to Exadata v2 platform.
This material is not just repeating the marketing material or Oracle's official whitepapers.
Stop the Chaos! Get Real Oracle Performance by Query Tuning Part 1SolarWinds
In this 2 part webinar series, Janis Griffin, Database Performance Evangelist, SolarWinds, first discusses how to quickly identify the performance disruptors in the database, find which queries to focus on, and show how to examine the execution plan for costly steps.
Understanding my database through SQL*Plus using the free tool eDB360Carlos Sierra
This session introduces eDB360 - a free tool that is executed from SQL*Plus and generates a set of reports providing a 360-degree view of an Oracle database; all without installing anything on the database.
If using Oracle Enterprise Manager (OEM) is off-limits for you or your team, and you can only access the database thorough a SQL*Plus connection with no direct access to the database server, then this tool is a perfect fit to provide you with a broad overview of the database configuration, performance, top SQL and much more. You only need a SQL*Plus account with read access to the data dictionary, and common Oracle licenses like the Diagnostics or the Tuning Pack.
Typical uses of this eDB360 tool include: databases health-checks, performance assessments, pre or post upgrade verifications, snapshots of the environment for later use, compare between two similar environments, documenting the state of a database when taking ownership of it, etc.
Once you learn how to use eDB360 and get to appreciate its value, you may want to execute this tool on all your databases on a regular basis, so you can keep track of things for long periods of time. This tool is becoming part of a large collection of goodies many DBAs use today.
During this session you will learn the basics about the free eDB360 tool, plus some cool tricks. The target audience is: DBAs, developers and consultants (some managers could also benefit).
SQLd360 is a free tool designed to help collecting and analyzing SQL Tuning-related info from an Oracle database.
Available for free on GitHub, just google "sqld360"
Troubleshooting Complex Performance issues - Oracle SEG$ contentionTanel Poder
From Tanel Poder's Troubleshooting Complex Performance Issues series - an example of Oracle SEG$ internal segment contention due to some direct path insert activity.
Understanding How is that Adaptive Cursor Sharing (ACS) produces multiple Opt...Carlos Sierra
Adaptive Cursor Sharing (ACS) is a feature available since 11g. It is enabled by default. ACS can help to generate multiple non-persistent Optimal Execution Plans for a given SQL. But it requires a sequence of events for it to get truly activated. This presentation describes what is ACS, when it is used and when it is not. Then it demonstrates ACS capabilities and limitations with a live demo.
This session is about: How Adaptive Cursor Sharing (ACS) actually works. How a bind sensitive cursor becomes bind aware. What are those "ACS buckets". How the "Selectivity Profile" works. Why sometimes your SQL becomes bind aware and why sometimes it does not. How is that ACS interacts with SQL Plan Management (SPM). These and other questions about ACS are answered in detail.
Some live demonstrations are used to illustrate the ramp-up process on ACS and how some child cursors are created then flagged as non-shareable. You will also "see" how the ACS Selectivity Profile is adapted as new executions make use of predicates with new Selectivities. ACS promotes Plan Flexibility while SPM promotes Plan Stability. Understanding how these duo interacts becomes of great value when some gentle intervention is needed to restore this delicate balance.
This session is for those Developers and DBAs that "need" to understand how things work. ACS can be seen as a back-box; or you can "look" inside and understand how it actually works. If you are curious about the ACS functionality, then this Session brings some light. Consider this session only if you are pretty familiar with Cursor Sharing, Binds, Plan Stability and Plan Flexibility.
Oracle Database Performance Tuning Advanced Features and Best Practices for DBAsZohar Elkayam
Oracle Week 2017 slides.
Agenda:
Basics: How and What To Tune?
Using the Automatic Workload Repository (AWR)
Using AWR-Based Tools: ASH, ADDM
Real-Time Database Operation Monitoring (12c)
Identifying Problem SQL Statements
Using SQL Performance Analyzer
Tuning Memory (SGA and PGA)
Parallel Execution and Compression
Oracle Database 12c Performance New Features
Understanding SQL Trace, TKPROF and Execution Plan for beginnersCarlos Sierra
The three fundamental steps of SQL Tuning are: 1) Diagnostics Collection; 2) Root Cause Analysis (RCA); and 3) Remediation. This introductory session on SQL Tuning is for novice DBAs and Developers that are required to investigate a piece of an application performing poorly.
On this session participants will learn about producing a SQL Trace then a summary TKPROF report. A sample TKPROF is navigated with the audience, where the trivial and the no so trivial is exposed and explain. Execution Plans are also navigated and explained, so participants can later untangle complex Execution Plans and start diagnosing SQL performing badly.
This session encourages participants to ask all kind of questions that could be potential road-blocks for deeper understanding of how to address a SQL performing poorly.
Spencer Christensen
There are many aspects to managing an RDBMS. Some of these are handled by an experienced DBA, but there are a good many things that any sys admin should be able to take care of if they know what to look for.
This presentation will cover basics of managing Postgres, including creating database clusters, overview of configuration, and logging. We will also look at tools to help monitor Postgres and keep an eye on what is going on. Some of the tools we will review are:
* pgtop
* pg_top
* pgfouine
* check_postgres.pl.
Check_postgres.pl is a great tool that can plug into your Nagios or Cacti monitoring systems, giving you even better visibility into your databases.
LinuxCon Europe, 2014. Video: https://www.youtube.com/watch?v=SN7Z0eCn0VY . There are many performance tools nowadays for Linux, but how do they all fit together, and when do we use them? This talk summarizes the three types of performance tools: observability, benchmarking, and tuning, providing a tour of what exists and why they exist. Advanced tools including those based on tracepoints, kprobes, and uprobes are also included: perf_events, ktap, SystemTap, LTTng, and sysdig. You'll gain a good understanding of the performance tools landscape, knowing what to reach for to get the most out of your systems.
Talk for PerconaLive 2016 by Brendan Gregg. Video: https://www.youtube.com/watch?v=CbmEDXq7es0 . "Systems performance provides a different perspective for analysis and tuning, and can help you find performance wins for your databases, applications, and the kernel. However, most of us are not performance or kernel engineers, and have limited time to study this topic. This talk summarizes six important areas of Linux systems performance in 50 minutes: observability tools, methodologies, benchmarking, profiling, tracing, and tuning. Included are recipes for Linux performance analysis and tuning (using vmstat, mpstat, iostat, etc), overviews of complex areas including profiling (perf_events), static tracing (tracepoints), and dynamic tracing (kprobes, uprobes), and much advice about what is and isn't important to learn. This talk is aimed at everyone: DBAs, developers, operations, etc, and in any environment running Linux, bare-metal or the cloud."
Beyond PHP - it's not (just) about the codeWim Godden
Most PHP developers focus on writing code. But creating Web applications is about much more than just writing PHP. Take a step outside the PHP cocoon and into the big PHP ecosphere to find out how small code changes can make a world of difference on servers and network. This talk is an eye-opener for developers who spend over 80% of their time coding, debugging and testing.
Video: https://www.youtube.com/watch?v=FJW8nGV4jxY and https://www.youtube.com/watch?v=zrr2nUln9Kk . Tutorial slides for O'Reilly Velocity SC 2015, by Brendan Gregg.
There are many performance tools nowadays for Linux, but how do they all fit together, and when do we use them? This tutorial explains methodologies for using these tools, and provides a tour of four tool types: observability, benchmarking, tuning, and static tuning. Many tools will be discussed, including top, iostat, tcpdump, sar, perf_events, ftrace, SystemTap, sysdig, and others, as well observability frameworks in the Linux kernel: PMCs, tracepoints, kprobes, and uprobes.
This tutorial is updated and extended on an earlier talk that summarizes the Linux performance tool landscape. The value of this tutorial is not just learning that these tools exist and what they do, but hearing when and how they are used by a performance engineer to solve real world problems — important context that is typically not included in the standard documentation.
Modern operating systems are complex beasts, responsible for sharing hardware resources between many competing programs. For low-latency systems, sometimes it's necessary to subvert the OS to grab back the resources your program needs. In this talk, we will explore what is actually going on when you run a program, how much time it actually gets on CPU, and strategies to help make your code run as fast as possible. By the end of this talk, you will know how to tune your software and the linux kernel to get the most from your hardware, and more importantly, how to validate that your changes have worked.
Modern Linux Performance Tools for Application TroubleshootingTanel Poder
Modern Linux Performance Tools for Application Troubleshooting.
Mostly demos and focused on application/process troubleshooting, not systemwide summaries.
This is a high level presentation I delivered at BIWA Summit. It's just some high level thoughts related to today's NoSQL and Hadoop SQL engines (not deeply technical).
Tanel Poder Oracle Scripts and Tools (2010)Tanel Poder
Tanel Poder's Oracle Performance and Troubleshooting Scripts & Tools presentation initially presented at Hotsos Symposium Training Day back in year 2010
Oracle Latch and Mutex Contention TroubleshootingTanel Poder
This is an intro to latch & mutex contention troubleshooting which I've delivered at Hotsos Symposium, UKOUG Conference etc... It's also the starting point of my Latch & Mutex contention sections in my Advanced Oracle Troubleshooting online seminar - but we go much deeper there :-)
Kubernetes & AI - Beauty and the Beast !?! @KCD Istanbul 2024Tobias Schneck
As AI technology is pushing into IT I was wondering myself, as an “infrastructure container kubernetes guy”, how get this fancy AI technology get managed from an infrastructure operational view? Is it possible to apply our lovely cloud native principals as well? What benefit’s both technologies could bring to each other?
Let me take this questions and provide you a short journey through existing deployment models and use cases for AI software. On practical examples, we discuss what cloud/on-premise strategy we may need for applying it to our own infrastructure to get it to work from an enterprise perspective. I want to give an overview about infrastructure requirements and technologies, what could be beneficial or limiting your AI use cases in an enterprise environment. An interactive Demo will give you some insides, what approaches I got already working for real.
Let's dive deeper into the world of ODC! Ricardo Alves (OutSystems) will join us to tell all about the new Data Fabric. After that, Sezen de Bruijn (OutSystems) will get into the details on how to best design a sturdy architecture within ODC.
Key Trends Shaping the Future of Infrastructure.pdfCheryl Hung
Keynote at DIGIT West Expo, Glasgow on 29 May 2024.
Cheryl Hung, ochery.com
Sr Director, Infrastructure Ecosystem, Arm.
The key trends across hardware, cloud and open-source; exploring how these areas are likely to mature and develop over the short and long-term, and then considering how organisations can position themselves to adapt and thrive.
Smart TV Buyer Insights Survey 2024 by 91mobiles.pdf91mobiles
91mobiles recently conducted a Smart TV Buyer Insights Survey in which we asked over 3,000 respondents about the TV they own, aspects they look at on a new TV, and their TV buying preferences.
Builder.ai Founder Sachin Dev Duggal's Strategic Approach to Create an Innova...Ramesh Iyer
In today's fast-changing business world, Companies that adapt and embrace new ideas often need help to keep up with the competition. However, fostering a culture of innovation takes much work. It takes vision, leadership and willingness to take risks in the right proportion. Sachin Dev Duggal, co-founder of Builder.ai, has perfected the art of this balance, creating a company culture where creativity and growth are nurtured at each stage.
Essentials of Automations: Optimizing FME Workflows with ParametersSafe Software
Are you looking to streamline your workflows and boost your projects’ efficiency? Do you find yourself searching for ways to add flexibility and control over your FME workflows? If so, you’re in the right place.
Join us for an insightful dive into the world of FME parameters, a critical element in optimizing workflow efficiency. This webinar marks the beginning of our three-part “Essentials of Automation” series. This first webinar is designed to equip you with the knowledge and skills to utilize parameters effectively: enhancing the flexibility, maintainability, and user control of your FME projects.
Here’s what you’ll gain:
- Essentials of FME Parameters: Understand the pivotal role of parameters, including Reader/Writer, Transformer, User, and FME Flow categories. Discover how they are the key to unlocking automation and optimization within your workflows.
- Practical Applications in FME Form: Delve into key user parameter types including choice, connections, and file URLs. Allow users to control how a workflow runs, making your workflows more reusable. Learn to import values and deliver the best user experience for your workflows while enhancing accuracy.
- Optimization Strategies in FME Flow: Explore the creation and strategic deployment of parameters in FME Flow, including the use of deployment and geometry parameters, to maximize workflow efficiency.
- Pro Tips for Success: Gain insights on parameterizing connections and leveraging new features like Conditional Visibility for clarity and simplicity.
We’ll wrap up with a glimpse into future webinars, followed by a Q&A session to address your specific questions surrounding this topic.
Don’t miss this opportunity to elevate your FME expertise and drive your projects to new heights of efficiency.
Connector Corner: Automate dynamic content and events by pushing a buttonDianaGray10
Here is something new! In our next Connector Corner webinar, we will demonstrate how you can use a single workflow to:
Create a campaign using Mailchimp with merge tags/fields
Send an interactive Slack channel message (using buttons)
Have the message received by managers and peers along with a test email for review
But there’s more:
In a second workflow supporting the same use case, you’ll see:
Your campaign sent to target colleagues for approval
If the “Approve” button is clicked, a Jira/Zendesk ticket is created for the marketing design team
But—if the “Reject” button is pushed, colleagues will be alerted via Slack message
Join us to learn more about this new, human-in-the-loop capability, brought to you by Integration Service connectors.
And...
Speakers:
Akshay Agnihotri, Product Manager
Charlie Greenberg, Host
Neuro-symbolic is not enough, we need neuro-*semantic*Frank van Harmelen
Neuro-symbolic (NeSy) AI is on the rise. However, simply machine learning on just any symbolic structure is not sufficient to really harvest the gains of NeSy. These will only be gained when the symbolic structures have an actual semantics. I give an operational definition of semantics as “predictable inference”.
All of this illustrated with link prediction over knowledge graphs, but the argument is general.
UiPath Test Automation using UiPath Test Suite series, part 3DianaGray10
Welcome to UiPath Test Automation using UiPath Test Suite series part 3. In this session, we will cover desktop automation along with UI automation.
Topics covered:
UI automation Introduction,
UI automation Sample
Desktop automation flow
Pradeep Chinnala, Senior Consultant Automation Developer @WonderBotz and UiPath MVP
Deepak Rai, Automation Practice Lead, Boundaryless Group and UiPath MVP
Transcript: Selling digital books in 2024: Insights from industry leaders - T...BookNet Canada
The publishing industry has been selling digital audiobooks and ebooks for over a decade and has found its groove. What’s changed? What has stayed the same? Where do we go from here? Join a group of leading sales peers from across the industry for a conversation about the lessons learned since the popularization of digital books, best practices, digital book supply chain management, and more.
Link to video recording: https://bnctechforum.ca/sessions/selling-digital-books-in-2024-insights-from-industry-leaders/
Presented by BookNet Canada on May 28, 2024, with support from the Department of Canadian Heritage.
The Art of the Pitch: WordPress Relationships and SalesLaura Byrne
Clients don’t know what they don’t know. What web solutions are right for them? How does WordPress come into the picture? How do you make sure you understand scope and timeline? What do you do if sometime changes?
All these questions and more will be explored as we talk about matching clients’ needs with what your agency offers without pulling teeth or pulling your hair out. Practical tips, and strategies for successful relationship building that leads to closing the deal.
Search and Society: Reimagining Information Access for Radical FuturesBhaskar Mitra
The field of Information retrieval (IR) is currently undergoing a transformative shift, at least partly due to the emerging applications of generative AI to information access. In this talk, we will deliberate on the sociotechnical implications of generative AI for information access. We will argue that there is both a critical necessity and an exciting opportunity for the IR community to re-center our research agendas on societal needs while dismantling the artificial separation between the work on fairness, accountability, transparency, and ethics in IR and the rest of IR research. Instead of adopting a reactionary strategy of trying to mitigate potential social harms from emerging technologies, the community should aim to proactively set the research agenda for the kinds of systems we should build inspired by diverse explicitly stated sociotechnical imaginaries. The sociotechnical imaginaries that underpin the design and development of information access technologies needs to be explicitly articulated, and we need to develop theories of change in context of these diverse perspectives. Our guiding future imaginaries must be informed by other academic fields, such as democratic theory and critical theory, and should be co-developed with social science scholars, legal scholars, civil rights and social justice activists, and artists, among others.
Search and Society: Reimagining Information Access for Radical Futures
Tanel Poder - Troubleshooting Complex Oracle Performance Issues - Part 2
1. More
Complex
Performance
Issues
I’ve
seen
(Part
2)
Tanel
Põder
Enkitec
h.p://www.enkitec.com
h.p://blog.tanelpoder.com
www.enkitec.com
1
2. Intro:
About
me
• Tanel
Põder
• Former
Oracle
Database
Performance
geek
• Present
Exadata
Performance
geek
;-‐)
• My
Exadata
experience
• …
in
the
last
couple
of
years…
• …
I
have
had
the
luck
to
work
with
all
possible
Exadata
configuraNons
out
there
• Exadata
V1
…
X2-‐8
• MulN-‐rack
Exadatas
…
• Even
a
mixed
rack
Exadata
(V2
<-‐>
X2-‐2
:)
Expert
Oracle
Exadata
book
(with
Kerry
Osborne
and
Randy
Johnson)
www.enkitec.com
2
3. Random
Session
Hangs
• Environment:
• Oracle
11.1
Database
on
Linux
• 4
CPUs
• Running
on
ASM
• Symptoms:
• Sudden
slowness
of
the
database,
lasNng
for
a
few
minutes
• Some
long
TX,
TM,
CF
enqueue
waits
• Some
sessions
completely
stuck,
some
showing
IO
waits,
some
CPU
• First
hunch:
• Seemed
quite
random
and
weird
• Maybe
slow/hung
IO?
www.enkitec.com
3
4. AWR
Report
• ApplicaNon
locking
problem,
right?
• Very
long
IO
waits…
• The
applicaNon
locks
may
be
held
for
so
long
because
of
some
other
task
(while
holding
the
lock)
takes
so
long?
www.enkitec.com
4
5. Finding
the
blockers
from
ASH
SELECT
SESSION_STATE
, EVENT
, P1TEXT ||'='||P1 p1
, BLOCKING_SESSION_STATUS
, BLOCKING_INST_ID
, BLOCKING_SESSION
, BLOCKING_SESSION_SERIAL#
, COUNT(DISTINCT session_id)
, COUNT(*)
FROM
dba_hist_active_sess_history w
WHERE
sample_time BETWEEN timestamp'2011-03-22 13:48:00'
AND timestamp'2011-03-22 13:50:00'
AND event LIKE 'enq%'
GROUP BY
SESSION_STATE
, EVENT
, P1TEXT ||'='||P1
, BLOCKING_SESSION_STATUS
, BLOCKING_INST_ID
, BLOCKING_SESSION
, BLOCKING_SESSION_SERIAL#
ORDER BY
COUNT(*) DESC
www.enkitec.com
Finding
the
blocking
session
SID
is
just
the
first
step,
you
really
want
to
know
what
is
that
blocking
session
itself
doing.
In
other
words,
where
is
it
stuck
so
that
it
hasn’t
released
that
lock
yet.
You
can
use
one
of
the
many
lock
tree
scripts
/
tools
for
finding
the
ulNmate
blocker.
Note
that
Oracle
11.2
has
a
FINAL_BLOCKING_SESSION
column
in
V
$SESSION
and
ASH
showing
the
ulNmate
blocker.
5
6. Blocking
Tree
Many
of
the
blockers
ulNmately
wait
for
SQL*Net
message
to
client
wait
event
?!!!
www.enkitec.com
Many
blocked
sessions
are
waiNng
for
read
by
other
session
IO
wait.
Such
wait
had
lasted
for
minutes
6
8. SuspecNng
an
I/O
issue?
• As
these
I/O
waits
suggested…
• The
obvious
next
things
to
check:
• How
much
I/O
are
you
actually
doing
–
from
OS
level
metrics
• The
OS
level
metrics
(iostat
and
sar)
did
not
indicate
an
obvious
IO
problem!
NB!
This
example
is
from
my
laptop
as
I
don’t
have
the
real
output
anymore.
• The
IO
Nmes
(in
iostat)
were
OK:
$ iostat –x 5
Device:
sda
sda1
sda2
dm-0
dm-1
rrqm/s
49.72
0.01
49.71
wrqm/s
r/s
w/s
43.03 55.69 22.40
0.03 0.00 0.00
42.99 55.69 22.40
rsec/s
3166.72
0.01
3166.70
wsec/s avgrq-sz avgqu-sz
553.49
47.64
0.24
0.07
60.26
0.00
553.43
47.64
0.24
0.00
0.00
0.00 30.91 10.46
0.00 74.49 55.81
2570.75
595.95
106.94
446.48
www.enkitec.com
64.71
8.00
0.07
0.62
await
3.11
2.18
3.11
svctm
0.23
0.66
0.23
%util
1.80
0.00
1.80
1.58
4.77
0.25
0.08
1.03
1.05
8
9. OEM
ASH
AcNvity
breakdown
• We
know
that
many
of
the
sessions
were
hung
waiNng
for
IO
related
wait
events
• …but
some
were
ulNmately
blocked
by
SQL*Net
message
to
client
• Let’s
peek
around
further
in
the
database:
www.enkitec.com
What,
CPU
load
over
50
on
a
4
CPU
machine?!
9
10. OEM
Performance
page
• No
CPU
problem.
User
I/O,
Commit
and
ApplicaNon
waits
This
data
comes
from
OS
(v$osstat)
so
should
be
reliable
www.enkitec.com
But
the
Performance
Page
doesn’t
show
CPU
load
that
we
saw
on
the
(ASH)
AcNvity
Detail?
10
11. Go
to
the
source
(OS)
• Sar
&
vmstat
data:
No
CPU
starvaNon!
procs
r b
5 0
0 0
0 0
-----------memory---------- ---swap-- -----io---- --system-swpd
free
buff cache
si
so
bi
bo
in
cs
143272 264980 261616 6970896
0
0 3164
319
3
1
143272 257376 261616 6970568
0
0
840
23 6351 8484
143272 261748 261616 6970952
0
0
0 3535 5303 7740
-----cpu------
us sy id wa st
14 3 77 6 0
11 8 73 8 0
7 1 89 2 0
• Whom
to
trust?
• OS
tools,
V$OSSTAT
and
Load
figures
in
EM
Performance
Page
ask
for
the
CPU
usage
figures
from
OS
–
so
are
ok
• The
ASH
data
(and
EM
AcNvity
page)
assume
that
any
session
not
marked
as
“waiNng”
in
V$SESSION
is
on
CPU!
• h.p://blog.tanelpoder.com/2007/06/18/advanced-‐oracle-‐troubleshooNng-‐guide-‐
when-‐the-‐wait-‐interface-‐is-‐not-‐enough-‐part-‐1/
• h.p://oracledoug.com/serendipity/index.php?/archives/1432-‐Time-‐Ma.ers-‐DB-‐
CPU.html
www.enkitec.com
11
12. Checkpoint
• Something
weird
is
going
on!
• Oracle
says
many
sessions
are
on
on
CPU,
when
they
really
aren’t
• Oracle
says
sessions
are
waiNng
for
IO
wait
events
a
lot,
while
not
much
IO
acNvity
was
going
on
• …
and
the
OS
level
IO
metrics
didn’t
show
long
IO
compleNon
Nmes
either
The
IO
hangs
can
be
tricky
to
diagnose
as
the
iostat
figures
are
updated
when
the
IO
actually
completes*
• Many
sessions
reported
doing
IO
by
Oracle
are
blocked
by
a
session
waiNng
for
SQL*Net
message
to
client
www.enkitec.com
12
13. Time
to
get
systemaNc
• …
and
see
what
these
hung
processes
are
really
doing!
• Did
I
hear
someone
saying
process
stack?!
;-‐)
• Reminder:
Oracle
is
just
another
program
wri.en
in
C
• The
process
stack
will
show
in
which
of
those
C
funcNons
the
problemaNc
process
execuNon
(hang)
currently
is!
• All
major
Unix
plavorms
have
pstack
(procstack
on
AIX)
• Oradebug
short_stack
/
dump
errorstack
would
also
do
it
*
• However
the
hangs
were
sporadic…
www.enkitec.com
I
prefer
OS
pstack
as
it’s
cleaner
13
14. @mon_stack.sql
for
waiNng
for
lisNng
the
blocker
• When
the
Nme
is
right:
-- STEP 1
DEFINE threshold=&1
-- First sleep and monitor V$SESSION to find long waits
-- in the database
-- STEP 2
SELECT 'ULTIMATE_BLOCKER_'||TRIM(s.type)
||'= '||TRIM(osid) blocking_spid
, w.in_wait_secs
-- This PL/SQL block will just keep running until a
-- long enough wait is seen
DECLARE
l_threshold NUMBER := &threshold;
l_max_wait NUMBER;
BEGIN
WHILE TRUE LOOP
, w.pid
, w.sid
, w.in_wait
, w.wait_event
, w.p1
, w.p2
, w.p3
FROM
SELECT MAX(seconds_in_wait) INTO l_max_wait
FROM v$session WHERE state = 'WAITING' AND
wait_class != 'Idle';
IF l_max_wait > l_threshold THEN
EXIT;
END IF;
DBMS_LOCK.SLEEP(30);
END LOOP;
END;
/
v$wait_chains w
, v$session s
WHERE
w.sid
= s.sid
AND w.sess_serial# = s.serial#
AND w.blocker_sid IS NULL
AND w.num_waiters > 0
/
-- Exit script
EXIT
www.enkitec.com
14
15. Wait
unNl
the
hang
happens
mon_hang_stack.sh
sqlplus -s $ORA_LOGON @mon_stack $THRESHOLD > $TMPFILE
ULTIMATE_BLOCKERS=`grep ULTIMATE_BLOCKER_USER $TMPFILE | awk '{ print $2 }'`
echo >> $LOGFILE
cat $TMPFILE >> $LOGFILE
echo >> $LOGFILE
echo DATE=`date +"%Y-%d-%m %H:%M:%S"` ULTIMATE_BLOCKERS=$ULTIMATE_BLOCKERS >> $LOGFILE
for i in $ULTIMATE_BLOCKERS ; do
echo >> $LOGFILE
echo DATE=`date +"%Y-%d-%m %H:%M:%S"` running pstack on PID=$i >> $LOGFILE
echo >> $LOGFILE
echo Stack trace 1 >> $LOGFILE
echo >> $LOGFILE
pstack $i >> $LOGFILE
sleep 1
echo >> $LOGFILE
echo Stack trace 2 >> $LOGFILE
echo >> $LOGFILE
Wait
unNl
the
hang
happens
(the
mon_stack
script
exits
only
when
it
detects
a
long
enough
wait
and
then
proceed
to
pstack’ing
the
ulNmate
blocker
PIDs
pstack $i >> $LOGFILE
sleep 1
echo >> $LOGFILE
echo Stack trace 3 >> $LOGFILE
echo >> $LOGFILE
pstack $i >> $LOGFILE
done
www.enkitec.com
15
16. The
stack
trace
This
is
where
the
process
execuNon
currently
is
#1 0x00000000032ed6d7
#2 0x00000000032e9e30
#3 0x0000000003281c10
#4 0x00002af99df1758d
Cluster
services
#5 0x00002af99df13daa
communicaNon
#6 0x00002af99df124e6
funcNons
#7 0x00002af99df120a3
#8 0x00002af99df10c18
#9 0x00002af99defa9e0
#10 0x00002af99defbad3
#11 0x0000000006eaf951
#12 0x0000000003aff6c2
#13 0x0000000003b00f07
#14ASM
file
-‐>
Physical
0x0000000003ae342c
device
address
#15 0x0000000003adcf9f
#16 0x0000000003a0f19b
translaNon!
#17 0x0000000005c7fb57
#18 0x0000000005c81f3a
#19 0x0000000005c7e5e9
#20 0x0000000005c7b9ad
#21 0x0000000005c7b366
#22 0x0000000005c4c1db
#23 0x0000000005c48574
#24 0x0000000007c3f837
#25 0x0000000007c3df1d
in
in
in
in
in
in
in
in
in
in
in
in
in
in
in
in
in
in
in
in
in
in
in
in
in
#26 0x0000000001a01286 in kcfrbd ()
ntevpque ()
#27 0x0000000000e01407 in kcbzib ()
ntevqone ()
#28 0x0000000007a7451b in kcbgcur ()
nsevwait ()
#29 0x0000000000d130de in ktbgcur ()
clsc_nswait ()
#30 0x0000000007a15b5f in ktspfpblk ()
clsc_select_ext ()
#31 0x0000000007a1458d in ktspfsrch ()
clsc_receive_wait ()
#32 0x0000000007a13f01 in ktspscan_bmb ()
clscreceive ()
#33 0x0000000007a1351f in ktspgsp_main ()
clscconnect ()
#34 0x0000000001427ec4 in kdisnew ()
clsssInitNative ()
#35 0x00000000014258cc in kdisnewle ()
clsssinit ()
#36 0x000000000140ca16 in kdisle ()
#37 0x00000000013c6899 in kdiins0 ()
kgxgncin ()
#38 0x00000000013d7d6c in kdiinsp ()
kfmsInit ()
#39 0x0000000007aa8516 in kauxsin ()
kfmsSlvReg ()
#40 0x0000000007ca0881 in qesltcLoadIndexList ()
kfmdSlvOpPriv ()
#41 0x0000000007ca04f9 in qesltcLoadIndexes ()
kfmEnslave ()
#42 0x0000000007c806fc in
kfddsGet ()
__PGOSF606_qerltcNoKdtBufferedInsRowCBK ()
kfioTranslateIO ()
#43 0x0000000007c7e753 in qerltcSingleRowLoad ()
kfioRqSetPrepare ()
#44 0x0000000007c7d5e7 in qerltcFetch ()
#45 0x0000000007bc742d in insexe ()
kfioSubmitIO ()
#46 0x0000000007c8f4c7 in opiexe ()
kfioRequestPriv ()
...
kfioRequest ()
...
ksfd_kfioRequest ()
#82 0x0000000001762cea in sou2o ()
This
is
the
ksfd_osmio ()
#83 0x0000000000975483 in opimai_real ()
“outmost”
ksfd_io ()
#84 0x00000000017682a1 in ssthrdmain ()
funcNon
in
ksfdread1 ()
#85 0x00000000009753af in main ()
the
stack
www.enkitec.com
16
17. Intermission:
How
ASM
works
2.
Check
ASM
extent
pointer
cache
in
the
DB
instance
1.
“Read
ASM
datafile
X
block
Y”
DB
Server
Process
DATABASE
INSTANCE
ASM
Server
Process
ASM
INSTANCE
4.
Read
the
block
from
disk
device
DISK
DEVICE
/dev/rdsk/xyz
3.
Fetch
ASM
-‐>
Physical
disk
block
mapping
from
ASM
instance!
(IPC
call!)
DISK
DEVICE
/dev/rdsk/xyz
www.enkitec.com
SQL> @sgastat asm
POOL
NAME
BYTES
------------ -------------------------- ----------
shared pool ASM KFFD SO
2648
shared pool ASM extent pointer array
1784672
shared pool ASM generic network state
2584
shared pool ASM kfk state object
31544
shared pool ASM map operations
30368
large pool
ASM map operations hashta
393216
shared pool ASM rollback operations
2648
shared pool ASM scan context
3544
17
18. A
bug!
Oyen
the
already
diagnosed
bugs
have
a
relevant
stack
trace
listed
in
the
note!
www.enkitec.com
18
19. A
bug!
• Bug
8429716
Clusteware
process
(ocssd/crsd/etc)
may
get
too
low
file
descriptor
limit
(hangs
etc..)
# ls –l /proc/`pgrep cssd.bin`/fd
…
lrwx------ 1 root root 64 Mar 29 04:11
…
96
97
98
99
->
->
->
->
socket:[55795]
socket:[55802]
socket:[55835]
socket:[55842]
Number
of
fds
in
use
reached
1024!
• 11gR2
Grid
Infrastructure
Does
not
Use
ulimit
Sezng
Appropriately
[ID
983715.1]
Even
though
the
file
descriptor
array
and
maximum
limits
for
user
processes
had
been
configured
correctly
(/etc/sysctl.conf
and
/etc/security/limits.conf),
thanks
to
the
Oracle
bug,
the
cssd
daemon
didn't
pick
up
such
a
limit
(as
it's
scheduled
via
rc
startup
scripts
as
root,
not
regular
users
logging
on).
Thus
the
fix
would
have
to
be
applied
into
cssd
startup
script
to
bump
up
the
file
descriptor
limit
for
itself.
www.enkitec.com
19
20. Unistrumented
Wait
events?!
• None
of
these
wait
events
exist
in
Oracle
11.1:
SQL> @sed css
Show wait event descriptions matching %css%..
EVENT# EVENT_NAME
------ ------------------------------------------------------848 CSS Xgrp shared operation
845 CSS group membership query
844 CSS group registration
843 CSS initialization
850 CSS operation: action
846 CSS operation: data query
847 CSS operation: data update
851 CSS operation: diagnostic
849 CSS operation: query
571 GCR CSS join retry
572 GCR member Data from CSS
565 IMR CSS join retry
SQL> @sed crs
Show wait event descriptions matching %crs%..
EVENT# EVENT_NAME
WAIT_CLASS
-------------------Other
Other
Other
Other
Other
Other
Other
Other
Other
Other
Other
Other
PARAMETER1
-----------
function_id
group_name1
group_name1
WAIT_CLASS
PARAMETER1
function_id
function_id
function_id
function_id
function_id
retry count
retry count
retry count
------ ------------------------------------------------------- -------------------- -----------
861 CRS call completion
Other
clsrrestype
www.enkitec.com
20
21. Thank
you
–
and
oh,
wait!
• New
seminars
in
2013
• Advanced
Oracle
TroubleshooNng
v2.1
(Feb-‐March)
• Advanced
Oracle
SQL
Tuning
v2.0
(March-‐April)
• Advanced
Exadata
Performance:
TroubleshooNng
and
OpNmizaNon
• h.p://blog.tanelpoder.com/seminar/
• QuesNons:
tanel@tanelpoder.com
• Blog:
h.p://blog.tanelpoder.com
• ConsulNng:
h.p://www.enkitec.com
www.enkitec.com
21