Econometrics combines economic theory, mathematics, and statistical methods to analyze economic data and test hypotheses. It allows economists to quantify economic relationships and forecast future trends. Some key points covered in the document include:
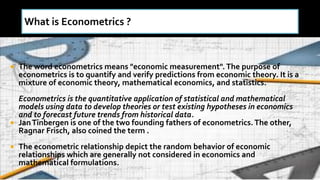
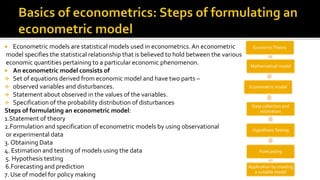
- Econometrics uses statistical methods and economic theory to develop and test economic models and hypotheses about economic relationships using real-world data.
- Important founders of econometrics include Jan Tinbergen and Ragnar Frisch.
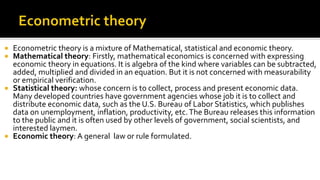
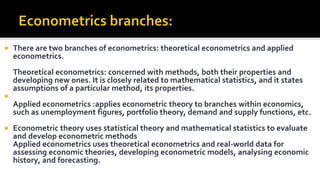
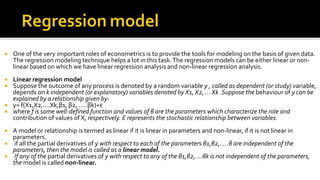
- Econometric models specify statistical relationships between economic variables based on economic theory and allow testing of theories and forecasting.
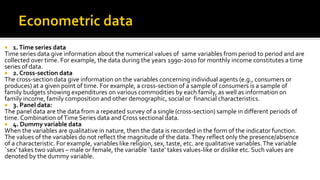
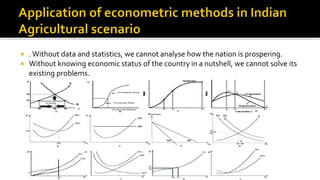
- Data sources include time series data, cross-sectional data, and panel data. Econometrics is useful for