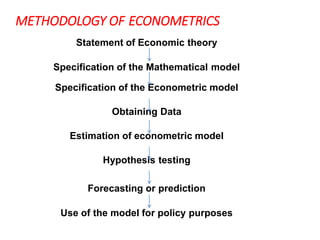
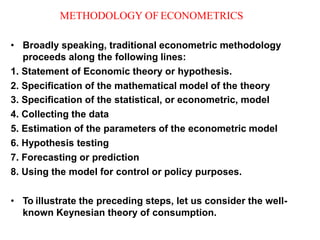
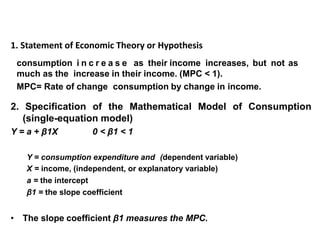
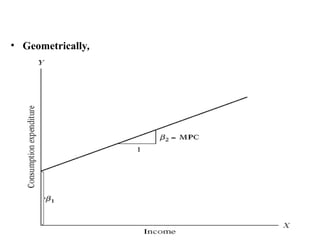
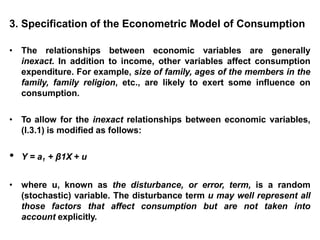
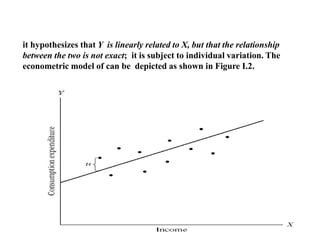
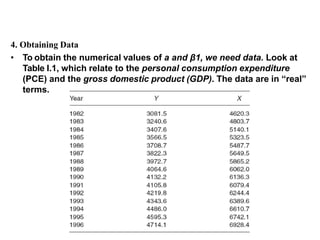
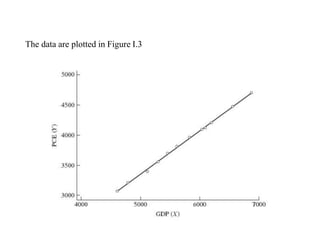
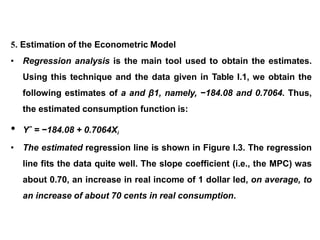
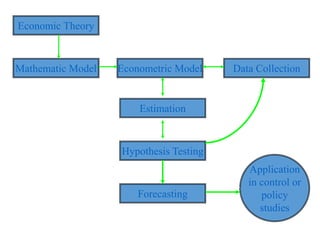
SlideShare a Scribd company logo
INTRODUCTION TO ECONOMETRICS
nternational Journal of Science
Engineering and Management
nternational Journal of Science
Engineering and Management
Outcomes of lecture
• Develop basic understanding of econometrics
• Analyze the methodology used in economic model
METHODOLOGY OF ECONOMETRICS
Statement of Economic theory
Specification of the Mathematical model
Specification of the Econometric model
Obtaining Data
Estimation of econometric model
Hypothesis testing
Forecasting or prediction
Use of the model for policy purposes
METHODOLOGY OF ECONOMETRICS
• Broadly speaking, traditional econometric methodology
proceeds along the following lines:
1. Statement of Economic theory or hypothesis.
2. Specification of the mathematical model of the theory
3. Specification of the statistical, or econometric, model
4. Collecting the data
5. Estimation of the parameters of the econometric model
6. Hypothesis testing
7. Forecasting or prediction
8. Using the model for control or policy purposes.
• To illustrate the preceding steps, let us consider the well-
known Keynesian theory of consumption.
1. Statement of Economic Theory or Hypothesis
• Keynes states that on average, consumers increase their
•
consumption i n c r e a s e as their income increases, but not as
much as the increase in their income. (MPC < 1).
MPC= Rate of change consumption by change in income.
2. Specification of the Mathematical Model of Consumption
(single-equation model)
Y = a + β1X 0 < β1 < 1
Y = consumption expenditure and (dependent variable)
X = income, (independent, or explanatory variable)
a = the intercept
β1 = the slope coefficient
• The slope coefficient β1 measures the MPC.
• Geometrically,
3. Specification of the Econometric Model of Consumption
• The relationships between economic variables are generally
inexact. In addition to income, other variables affect consumption
expenditure. For example, size of family, ages of the members in the
family, family religion, etc., are likely to exert some influence on
consumption.
• To allow for the inexact relationships between economic variables,
(I.3.1) is modified as follows:
• Y = a1 + β1X + u
• where u, known as the disturbance, or error, term, is a random
(stochastic) variable. The disturbance term u may well represent all
those factors that affect consumption but are not taken into
account explicitly.
• it hypothesizes that Y is linearly related to X, but that the relationship
between the two is not exact; it is subject to individual variation. The
econometric model of can be depicted as shown in Figure I.2.
MCQ
• Consider the following simple regression model of
house prices: house_price = b0+ b1*land_size + u.
What is b1 ?
• (a) land_size.
• (b) the distance to the city.
• (c) slope parameter.
• (d) intercept parameter.
MCQ
• In the equation, y=β0+β1x1+β2x2+u
β0 is a(n) _____.
• (a) independent variable
• (b) dependent variable
• (c) slope parameter
• (d) intercept parameter
4. Obtaining Data
• To obtain the numerical values of a and β1, we need data. Look at
Table I.1, which relate to the personal consumption expenditure
(PCE) and the gross domestic product (GDP). The data are in “real”
terms.
The data are plotted in Figure I.3
5. Estimation of the Econometric Model
• Regression analysis is the main tool used to obtain the estimates.
Using this technique and the data given in Table I.1, we obtain the
following estimates of a and β1, namely, −184.08 and 0.7064. Thus,
the estimated consumption function is:
• Yˆ = −184.08 + 0.7064Xi
• The estimated regression line is shown in Figure I.3. The regression
line fits the data quite well. The slope coefficient (i.e., the MPC) was
about 0.70, an increase in real income of 1 dollar led, on average, to
an increase of about 70 cents in real consumption.
6. Hypothesis Testing
• That is to find out whether the estimates obtained in, Eq. (I.3.3) are
in accord with the expectations of the theory that is being tested.
Keynes expected the MPC to be positive but less than 1.
• In our example we found the MPC to be about 0.70.
• But before we accept this finding as confirmation of Keynesian
consumption theory, we must enquire whether this estimate is
sufficiently below unity.
• In other words, is 0.70 statistically less than 1? If it is, it may
support Keynes’ theory.
7. Forecasting or Prediction
• To illustrate, suppose we want to predict the mean consumption
expenditure for 1997. The GDP value for 1997 was 7269.8 billion
dollars consumption would be:
Yˆ1997 = −184.0779 + 0.7064 (7269.8) = 4951.3
• Now suppose the government decides to propose a reduction in the
income tax. What will be the effect of such a policy on income and
thereby on consumption expenditure and ultimately on
employment?
8. Use of models for control or policy
purpose-
As the estimated model is used to make
policies by appropriate mix of fiscal and
monetary the government can manipulate the
control variable X to produce a desired level of
the target variable Y.
Economic Theory
Mathematic Model Econometric Model Data Collection
Estimation
Hypothesis Testing
Forecasting
Application
in control or
policy
studies
Scope of Econometrics
• Developing statistical methods for the estimation of
economic relationships,
• Testing economic theories and hypothesis,
• Evaluating and applying economic policies,
• Forecasting,
• Collecting and analyzing non-experimental or
observational data
Goals of Econometrics
• The three main aims econometrics are as follows:
1. Formulation and specification of econometric
models
2. Estimation and testing of models
3. Use of models
Division of Econometrics
• Two types of Econometrics:
1. Theoretical Econometrics- statistical methods
2. Applied Econometrics- empirical analysis
RELATIONSHIPS
 Statistical versus deterministic- In statistical
relationships among variables we essentially deal
with random variables, in deterministic relationships
it also deals with variables
 Regression versus causation- there is no
statistical reason to assume that rainfall doesn’t
depend on crop yield. commonsense says that
inverse relationship in itself cannot logically imply
causation.
 Regression versus correlation- the strength of
association between two variables is correlation ,it
is measured by correlation coefficient.
 To estimate or predict the average value of one
variable on the basis of the fixed variable.
 In regression analysis there is an symmetry in the
way the dependent and explanatory variables are
treated. in correlation, variables are symmetrically.
 Explained variable
 Predictand
 Regressand
 Response
 Endogenous
 Outcome
 Controlled variable
 Independent variable
 Predictor
 Regressor
 Stimulus
 Exogenous
 Covariate
 Control variable
Dependent variable Explanatory variable
TYPES OF DATA IN ECONOMETRICS
 Time series data-
 consists of observations on a variable or several
variables over time.
 Chronological ordering
 Frequency of time series data: hour, day, week, month,
year
 Time length between observations is generally equal
 Examples of time series data include stock prices,
money supply, consumer price index, gross domestic
product, annual homicide rates, and automobile sales
figures.
Cross sectional Data
• Data collected at the same point of time
• consists of a sample of individuals, households, firms,
cities, states, countries, or a variety of other units,
taken at a given point in time
• Significant feature: random sampling from a target
population
• Generally obtained through official records of individual
units, surveys, questionnaires (data collection
instrument that contains a series of questions designed
for a specific purpose)
• For example, household income, consumption and
employment surveys conducted by the Turkish
Statistical Institute (TUIK/TURKSTAT)
Pooled data
 it is combined ,data are elements of both time series
and cross section data
 consists of cross-sectional data sets that are observed in
different time periods and combined together
 At each time period (e.g., year) a different random sample is
chosen from population
 Individual units are not the same
 For example if we choose a random sample 400 firms in
2002 and choose another sample in 2010 and combine
these cross-sectional data sets we obtain a pooled cross-
section data set.
 Cross-sectional observations are pooled together over time.
Panel Data (longitudinal data)
• Also known as Micropanel data.
• it is a special type of pooled data inwhich the
same cross sectional unit is surveyed over time
• consists of a time series for each cross-sectional
member in the data set.
• The same cross-sectional units (firms, households, etc.)
are followed over time.
• For example: wage, education, and employment history
for a set of individuals followed over a ten-year period.
• Another example: cross-country data set for a 20 year
period containing life expectancy, income inequality,
real GDP per capita and other country characteristics
• Simple regression model
Significance of error term
• Vagueness of theory
• Unavailability of data
• Randomness in human behavior
• Poor proxy variable
• Principle of parsimony (extreme unwillingness)
• Wrong functional form

More Related Content

Similar to 2U1.pptx

1.introduction
1.introduction1.introduction
1.introduction
Regmi Milan
 
Econometrics.pptx
Econometrics.pptxEconometrics.pptx
Econometrics.pptx
SandeepSingh286037
 
Econometrics lecture 1st
Econometrics lecture 1stEconometrics lecture 1st
Econometrics lecture 1stIshaq Ahmad
 
Unit 01 - Consolidated.pptx
Unit 01 - Consolidated.pptxUnit 01 - Consolidated.pptx
Unit 01 - Consolidated.pptx
ChristopherDevakumar1
 
Econometrics
EconometricsEconometrics
Econometrics
Pawan Kawan
 
Introduction to Macroeconomics_2021.pptx
Introduction to Macroeconomics_2021.pptxIntroduction to Macroeconomics_2021.pptx
Introduction to Macroeconomics_2021.pptx
MomoreoluwaFanegan
 
Economic NotesLipsey ppt ch02
Economic NotesLipsey ppt ch02Economic NotesLipsey ppt ch02
Economic NotesLipsey ppt ch02
Thangarajah Kopiram
 
Econometrics and economic data
Econometrics and economic dataEconometrics and economic data
Econometrics and economic data
AdilMohsunov1
 
Basic stat
Basic statBasic stat
Basic stat
kula jilo
 
Advanced Econometrics by Sajid Ali Khan Rawalakot: 0334-5439066
Advanced Econometrics by Sajid Ali Khan Rawalakot: 0334-5439066Advanced Econometrics by Sajid Ali Khan Rawalakot: 0334-5439066
Advanced Econometrics by Sajid Ali Khan Rawalakot: 0334-5439066
Sajid Ali Khan
 
Econometrics_1.pptx
Econometrics_1.pptxEconometrics_1.pptx
Econometrics_1.pptx
SoumiliBera2
 
Statistics for management
Statistics for managementStatistics for management
Statistics for managementVinay Aradhya
 
Statistics online lecture 01.pptx
Statistics online lecture  01.pptxStatistics online lecture  01.pptx
Statistics online lecture 01.pptx
IkramUlhaq93
 
Stats LECTURE 1.pptx
Stats LECTURE 1.pptxStats LECTURE 1.pptx
Stats LECTURE 1.pptx
KEHKASHANNIZAM
 
Econometrics1,2,3,4,5,6,7,8_ChaptersALL.pdf
Econometrics1,2,3,4,5,6,7,8_ChaptersALL.pdfEconometrics1,2,3,4,5,6,7,8_ChaptersALL.pdf
Econometrics1,2,3,4,5,6,7,8_ChaptersALL.pdf
nazerjibril
 
The dangers of macro-prudential policy experiments: initial beliefs under ada...
The dangers of macro-prudential policy experiments: initial beliefs under ada...The dangers of macro-prudential policy experiments: initial beliefs under ada...
The dangers of macro-prudential policy experiments: initial beliefs under ada...
GRAPE
 
Persistent Slowdowns, Expectations and Macroeconomic Policy
Persistent Slowdowns, Expectations and Macroeconomic PolicyPersistent Slowdowns, Expectations and Macroeconomic Policy
Persistent Slowdowns, Expectations and Macroeconomic Policy
Suomen Pankki
 

Similar to 2U1.pptx (20)

1.introduction
1.introduction1.introduction
1.introduction
 
Econometrics.pptx
Econometrics.pptxEconometrics.pptx
Econometrics.pptx
 
Econometrics lecture 1st
Econometrics lecture 1stEconometrics lecture 1st
Econometrics lecture 1st
 
Unit 01 - Consolidated.pptx
Unit 01 - Consolidated.pptxUnit 01 - Consolidated.pptx
Unit 01 - Consolidated.pptx
 
Class 1.1 (1).pptx
Class 1.1 (1).pptxClass 1.1 (1).pptx
Class 1.1 (1).pptx
 
Econometrics
EconometricsEconometrics
Econometrics
 
Introduction to Macroeconomics_2021.pptx
Introduction to Macroeconomics_2021.pptxIntroduction to Macroeconomics_2021.pptx
Introduction to Macroeconomics_2021.pptx
 
Economic NotesLipsey ppt ch02
Economic NotesLipsey ppt ch02Economic NotesLipsey ppt ch02
Economic NotesLipsey ppt ch02
 
Econometrics and economic data
Econometrics and economic dataEconometrics and economic data
Econometrics and economic data
 
Principles of Econometrics
Principles of Econometrics Principles of Econometrics
Principles of Econometrics
 
Basic stat
Basic statBasic stat
Basic stat
 
Advanced Econometrics by Sajid Ali Khan Rawalakot: 0334-5439066
Advanced Econometrics by Sajid Ali Khan Rawalakot: 0334-5439066Advanced Econometrics by Sajid Ali Khan Rawalakot: 0334-5439066
Advanced Econometrics by Sajid Ali Khan Rawalakot: 0334-5439066
 
ECONOMIC DATA
ECONOMIC DATAECONOMIC DATA
ECONOMIC DATA
 
Econometrics_1.pptx
Econometrics_1.pptxEconometrics_1.pptx
Econometrics_1.pptx
 
Statistics for management
Statistics for managementStatistics for management
Statistics for management
 
Statistics online lecture 01.pptx
Statistics online lecture  01.pptxStatistics online lecture  01.pptx
Statistics online lecture 01.pptx
 
Stats LECTURE 1.pptx
Stats LECTURE 1.pptxStats LECTURE 1.pptx
Stats LECTURE 1.pptx
 
Econometrics1,2,3,4,5,6,7,8_ChaptersALL.pdf
Econometrics1,2,3,4,5,6,7,8_ChaptersALL.pdfEconometrics1,2,3,4,5,6,7,8_ChaptersALL.pdf
Econometrics1,2,3,4,5,6,7,8_ChaptersALL.pdf
 
The dangers of macro-prudential policy experiments: initial beliefs under ada...
The dangers of macro-prudential policy experiments: initial beliefs under ada...The dangers of macro-prudential policy experiments: initial beliefs under ada...
The dangers of macro-prudential policy experiments: initial beliefs under ada...
 
Persistent Slowdowns, Expectations and Macroeconomic Policy
Persistent Slowdowns, Expectations and Macroeconomic PolicyPersistent Slowdowns, Expectations and Macroeconomic Policy
Persistent Slowdowns, Expectations and Macroeconomic Policy
 

Recently uploaded

Designing Great Products: The Power of Design and Leadership by Chief Designe...
Designing Great Products: The Power of Design and Leadership by Chief Designe...Designing Great Products: The Power of Design and Leadership by Chief Designe...
Designing Great Products: The Power of Design and Leadership by Chief Designe...
Product School
 
Elevating Tactical DDD Patterns Through Object Calisthenics
Elevating Tactical DDD Patterns Through Object CalisthenicsElevating Tactical DDD Patterns Through Object Calisthenics
Elevating Tactical DDD Patterns Through Object Calisthenics
Dorra BARTAGUIZ
 
Monitoring Java Application Security with JDK Tools and JFR Events
Monitoring Java Application Security with JDK Tools and JFR EventsMonitoring Java Application Security with JDK Tools and JFR Events
Monitoring Java Application Security with JDK Tools and JFR Events
Ana-Maria Mihalceanu
 
Assuring Contact Center Experiences for Your Customers With ThousandEyes
Assuring Contact Center Experiences for Your Customers With ThousandEyesAssuring Contact Center Experiences for Your Customers With ThousandEyes
Assuring Contact Center Experiences for Your Customers With ThousandEyes
ThousandEyes
 
Generating a custom Ruby SDK for your web service or Rails API using Smithy
Generating a custom Ruby SDK for your web service or Rails API using SmithyGenerating a custom Ruby SDK for your web service or Rails API using Smithy
Generating a custom Ruby SDK for your web service or Rails API using Smithy
g2nightmarescribd
 
UiPath Test Automation using UiPath Test Suite series, part 3
UiPath Test Automation using UiPath Test Suite series, part 3UiPath Test Automation using UiPath Test Suite series, part 3
UiPath Test Automation using UiPath Test Suite series, part 3
DianaGray10
 
Securing your Kubernetes cluster_ a step-by-step guide to success !
Securing your Kubernetes cluster_ a step-by-step guide to success !Securing your Kubernetes cluster_ a step-by-step guide to success !
Securing your Kubernetes cluster_ a step-by-step guide to success !
KatiaHIMEUR1
 
Slack (or Teams) Automation for Bonterra Impact Management (fka Social Soluti...
Slack (or Teams) Automation for Bonterra Impact Management (fka Social Soluti...Slack (or Teams) Automation for Bonterra Impact Management (fka Social Soluti...
Slack (or Teams) Automation for Bonterra Impact Management (fka Social Soluti...
Jeffrey Haguewood
 
Mission to Decommission: Importance of Decommissioning Products to Increase E...
Mission to Decommission: Importance of Decommissioning Products to Increase E...Mission to Decommission: Importance of Decommissioning Products to Increase E...
Mission to Decommission: Importance of Decommissioning Products to Increase E...
Product School
 
The Art of the Pitch: WordPress Relationships and Sales
The Art of the Pitch: WordPress Relationships and SalesThe Art of the Pitch: WordPress Relationships and Sales
The Art of the Pitch: WordPress Relationships and Sales
Laura Byrne
 
From Siloed Products to Connected Ecosystem: Building a Sustainable and Scala...
From Siloed Products to Connected Ecosystem: Building a Sustainable and Scala...From Siloed Products to Connected Ecosystem: Building a Sustainable and Scala...
From Siloed Products to Connected Ecosystem: Building a Sustainable and Scala...
Product School
 
DevOps and Testing slides at DASA Connect
DevOps and Testing slides at DASA ConnectDevOps and Testing slides at DASA Connect
DevOps and Testing slides at DASA Connect
Kari Kakkonen
 
LF Energy Webinar: Electrical Grid Modelling and Simulation Through PowSyBl -...
LF Energy Webinar: Electrical Grid Modelling and Simulation Through PowSyBl -...LF Energy Webinar: Electrical Grid Modelling and Simulation Through PowSyBl -...
LF Energy Webinar: Electrical Grid Modelling and Simulation Through PowSyBl -...
DanBrown980551
 
State of ICS and IoT Cyber Threat Landscape Report 2024 preview
State of ICS and IoT Cyber Threat Landscape Report 2024 previewState of ICS and IoT Cyber Threat Landscape Report 2024 preview
State of ICS and IoT Cyber Threat Landscape Report 2024 preview
Prayukth K V
 
Essentials of Automations: Optimizing FME Workflows with Parameters
Essentials of Automations: Optimizing FME Workflows with ParametersEssentials of Automations: Optimizing FME Workflows with Parameters
Essentials of Automations: Optimizing FME Workflows with Parameters
Safe Software
 
Dev Dives: Train smarter, not harder – active learning and UiPath LLMs for do...
Dev Dives: Train smarter, not harder – active learning and UiPath LLMs for do...Dev Dives: Train smarter, not harder – active learning and UiPath LLMs for do...
Dev Dives: Train smarter, not harder – active learning and UiPath LLMs for do...
UiPathCommunity
 
Leading Change strategies and insights for effective change management pdf 1.pdf
Leading Change strategies and insights for effective change management pdf 1.pdfLeading Change strategies and insights for effective change management pdf 1.pdf
Leading Change strategies and insights for effective change management pdf 1.pdf
OnBoard
 
Builder.ai Founder Sachin Dev Duggal's Strategic Approach to Create an Innova...
Builder.ai Founder Sachin Dev Duggal's Strategic Approach to Create an Innova...Builder.ai Founder Sachin Dev Duggal's Strategic Approach to Create an Innova...
Builder.ai Founder Sachin Dev Duggal's Strategic Approach to Create an Innova...
Ramesh Iyer
 
Connector Corner: Automate dynamic content and events by pushing a button
Connector Corner: Automate dynamic content and events by pushing a buttonConnector Corner: Automate dynamic content and events by pushing a button
Connector Corner: Automate dynamic content and events by pushing a button
DianaGray10
 
Transcript: Selling digital books in 2024: Insights from industry leaders - T...
Transcript: Selling digital books in 2024: Insights from industry leaders - T...Transcript: Selling digital books in 2024: Insights from industry leaders - T...
Transcript: Selling digital books in 2024: Insights from industry leaders - T...
BookNet Canada
 

Recently uploaded (20)

Designing Great Products: The Power of Design and Leadership by Chief Designe...
Designing Great Products: The Power of Design and Leadership by Chief Designe...Designing Great Products: The Power of Design and Leadership by Chief Designe...
Designing Great Products: The Power of Design and Leadership by Chief Designe...
 
Elevating Tactical DDD Patterns Through Object Calisthenics
Elevating Tactical DDD Patterns Through Object CalisthenicsElevating Tactical DDD Patterns Through Object Calisthenics
Elevating Tactical DDD Patterns Through Object Calisthenics
 
Monitoring Java Application Security with JDK Tools and JFR Events
Monitoring Java Application Security with JDK Tools and JFR EventsMonitoring Java Application Security with JDK Tools and JFR Events
Monitoring Java Application Security with JDK Tools and JFR Events
 
Assuring Contact Center Experiences for Your Customers With ThousandEyes
Assuring Contact Center Experiences for Your Customers With ThousandEyesAssuring Contact Center Experiences for Your Customers With ThousandEyes
Assuring Contact Center Experiences for Your Customers With ThousandEyes
 
Generating a custom Ruby SDK for your web service or Rails API using Smithy
Generating a custom Ruby SDK for your web service or Rails API using SmithyGenerating a custom Ruby SDK for your web service or Rails API using Smithy
Generating a custom Ruby SDK for your web service or Rails API using Smithy
 
UiPath Test Automation using UiPath Test Suite series, part 3
UiPath Test Automation using UiPath Test Suite series, part 3UiPath Test Automation using UiPath Test Suite series, part 3
UiPath Test Automation using UiPath Test Suite series, part 3
 
Securing your Kubernetes cluster_ a step-by-step guide to success !
Securing your Kubernetes cluster_ a step-by-step guide to success !Securing your Kubernetes cluster_ a step-by-step guide to success !
Securing your Kubernetes cluster_ a step-by-step guide to success !
 
Slack (or Teams) Automation for Bonterra Impact Management (fka Social Soluti...
Slack (or Teams) Automation for Bonterra Impact Management (fka Social Soluti...Slack (or Teams) Automation for Bonterra Impact Management (fka Social Soluti...
Slack (or Teams) Automation for Bonterra Impact Management (fka Social Soluti...
 
Mission to Decommission: Importance of Decommissioning Products to Increase E...
Mission to Decommission: Importance of Decommissioning Products to Increase E...Mission to Decommission: Importance of Decommissioning Products to Increase E...
Mission to Decommission: Importance of Decommissioning Products to Increase E...
 
The Art of the Pitch: WordPress Relationships and Sales
The Art of the Pitch: WordPress Relationships and SalesThe Art of the Pitch: WordPress Relationships and Sales
The Art of the Pitch: WordPress Relationships and Sales
 
From Siloed Products to Connected Ecosystem: Building a Sustainable and Scala...
From Siloed Products to Connected Ecosystem: Building a Sustainable and Scala...From Siloed Products to Connected Ecosystem: Building a Sustainable and Scala...
From Siloed Products to Connected Ecosystem: Building a Sustainable and Scala...
 
DevOps and Testing slides at DASA Connect
DevOps and Testing slides at DASA ConnectDevOps and Testing slides at DASA Connect
DevOps and Testing slides at DASA Connect
 
LF Energy Webinar: Electrical Grid Modelling and Simulation Through PowSyBl -...
LF Energy Webinar: Electrical Grid Modelling and Simulation Through PowSyBl -...LF Energy Webinar: Electrical Grid Modelling and Simulation Through PowSyBl -...
LF Energy Webinar: Electrical Grid Modelling and Simulation Through PowSyBl -...
 
State of ICS and IoT Cyber Threat Landscape Report 2024 preview
State of ICS and IoT Cyber Threat Landscape Report 2024 previewState of ICS and IoT Cyber Threat Landscape Report 2024 preview
State of ICS and IoT Cyber Threat Landscape Report 2024 preview
 
Essentials of Automations: Optimizing FME Workflows with Parameters
Essentials of Automations: Optimizing FME Workflows with ParametersEssentials of Automations: Optimizing FME Workflows with Parameters
Essentials of Automations: Optimizing FME Workflows with Parameters
 
Dev Dives: Train smarter, not harder – active learning and UiPath LLMs for do...
Dev Dives: Train smarter, not harder – active learning and UiPath LLMs for do...Dev Dives: Train smarter, not harder – active learning and UiPath LLMs for do...
Dev Dives: Train smarter, not harder – active learning and UiPath LLMs for do...
 
Leading Change strategies and insights for effective change management pdf 1.pdf
Leading Change strategies and insights for effective change management pdf 1.pdfLeading Change strategies and insights for effective change management pdf 1.pdf
Leading Change strategies and insights for effective change management pdf 1.pdf
 
Builder.ai Founder Sachin Dev Duggal's Strategic Approach to Create an Innova...
Builder.ai Founder Sachin Dev Duggal's Strategic Approach to Create an Innova...Builder.ai Founder Sachin Dev Duggal's Strategic Approach to Create an Innova...
Builder.ai Founder Sachin Dev Duggal's Strategic Approach to Create an Innova...
 
Connector Corner: Automate dynamic content and events by pushing a button
Connector Corner: Automate dynamic content and events by pushing a buttonConnector Corner: Automate dynamic content and events by pushing a button
Connector Corner: Automate dynamic content and events by pushing a button
 
Transcript: Selling digital books in 2024: Insights from industry leaders - T...
Transcript: Selling digital books in 2024: Insights from industry leaders - T...Transcript: Selling digital books in 2024: Insights from industry leaders - T...
Transcript: Selling digital books in 2024: Insights from industry leaders - T...
 

2U1.pptx

  • 2. nternational Journal of Science Engineering and Management nternational Journal of Science Engineering and Management
  • 3.
  • 4. Outcomes of lecture • Develop basic understanding of econometrics • Analyze the methodology used in economic model
  • 5. METHODOLOGY OF ECONOMETRICS Statement of Economic theory Specification of the Mathematical model Specification of the Econometric model Obtaining Data Estimation of econometric model Hypothesis testing Forecasting or prediction Use of the model for policy purposes
  • 6. METHODOLOGY OF ECONOMETRICS • Broadly speaking, traditional econometric methodology proceeds along the following lines: 1. Statement of Economic theory or hypothesis. 2. Specification of the mathematical model of the theory 3. Specification of the statistical, or econometric, model 4. Collecting the data 5. Estimation of the parameters of the econometric model 6. Hypothesis testing 7. Forecasting or prediction 8. Using the model for control or policy purposes. • To illustrate the preceding steps, let us consider the well- known Keynesian theory of consumption.
  • 7. 1. Statement of Economic Theory or Hypothesis • Keynes states that on average, consumers increase their • consumption i n c r e a s e as their income increases, but not as much as the increase in their income. (MPC < 1). MPC= Rate of change consumption by change in income. 2. Specification of the Mathematical Model of Consumption (single-equation model) Y = a + β1X 0 < β1 < 1 Y = consumption expenditure and (dependent variable) X = income, (independent, or explanatory variable) a = the intercept β1 = the slope coefficient • The slope coefficient β1 measures the MPC.
  • 9. 3. Specification of the Econometric Model of Consumption • The relationships between economic variables are generally inexact. In addition to income, other variables affect consumption expenditure. For example, size of family, ages of the members in the family, family religion, etc., are likely to exert some influence on consumption. • To allow for the inexact relationships between economic variables, (I.3.1) is modified as follows: • Y = a1 + β1X + u • where u, known as the disturbance, or error, term, is a random (stochastic) variable. The disturbance term u may well represent all those factors that affect consumption but are not taken into account explicitly.
  • 10. • it hypothesizes that Y is linearly related to X, but that the relationship between the two is not exact; it is subject to individual variation. The econometric model of can be depicted as shown in Figure I.2.
  • 11. MCQ • Consider the following simple regression model of house prices: house_price = b0+ b1*land_size + u. What is b1 ? • (a) land_size. • (b) the distance to the city. • (c) slope parameter. • (d) intercept parameter.
  • 12. MCQ • In the equation, y=β0+β1x1+β2x2+u β0 is a(n) _____. • (a) independent variable • (b) dependent variable • (c) slope parameter • (d) intercept parameter
  • 13. 4. Obtaining Data • To obtain the numerical values of a and β1, we need data. Look at Table I.1, which relate to the personal consumption expenditure (PCE) and the gross domestic product (GDP). The data are in “real” terms.
  • 14. The data are plotted in Figure I.3
  • 15.
  • 16. 5. Estimation of the Econometric Model • Regression analysis is the main tool used to obtain the estimates. Using this technique and the data given in Table I.1, we obtain the following estimates of a and β1, namely, −184.08 and 0.7064. Thus, the estimated consumption function is: • Yˆ = −184.08 + 0.7064Xi • The estimated regression line is shown in Figure I.3. The regression line fits the data quite well. The slope coefficient (i.e., the MPC) was about 0.70, an increase in real income of 1 dollar led, on average, to an increase of about 70 cents in real consumption.
  • 17. 6. Hypothesis Testing • That is to find out whether the estimates obtained in, Eq. (I.3.3) are in accord with the expectations of the theory that is being tested. Keynes expected the MPC to be positive but less than 1. • In our example we found the MPC to be about 0.70. • But before we accept this finding as confirmation of Keynesian consumption theory, we must enquire whether this estimate is sufficiently below unity. • In other words, is 0.70 statistically less than 1? If it is, it may support Keynes’ theory.
  • 18. 7. Forecasting or Prediction • To illustrate, suppose we want to predict the mean consumption expenditure for 1997. The GDP value for 1997 was 7269.8 billion dollars consumption would be: Yˆ1997 = −184.0779 + 0.7064 (7269.8) = 4951.3 • Now suppose the government decides to propose a reduction in the income tax. What will be the effect of such a policy on income and thereby on consumption expenditure and ultimately on employment?
  • 19. 8. Use of models for control or policy purpose- As the estimated model is used to make policies by appropriate mix of fiscal and monetary the government can manipulate the control variable X to produce a desired level of the target variable Y.
  • 20. Economic Theory Mathematic Model Econometric Model Data Collection Estimation Hypothesis Testing Forecasting Application in control or policy studies
  • 21. Scope of Econometrics • Developing statistical methods for the estimation of economic relationships, • Testing economic theories and hypothesis, • Evaluating and applying economic policies, • Forecasting, • Collecting and analyzing non-experimental or observational data
  • 22. Goals of Econometrics • The three main aims econometrics are as follows: 1. Formulation and specification of econometric models 2. Estimation and testing of models 3. Use of models
  • 23. Division of Econometrics • Two types of Econometrics: 1. Theoretical Econometrics- statistical methods 2. Applied Econometrics- empirical analysis
  • 24. RELATIONSHIPS  Statistical versus deterministic- In statistical relationships among variables we essentially deal with random variables, in deterministic relationships it also deals with variables  Regression versus causation- there is no statistical reason to assume that rainfall doesn’t depend on crop yield. commonsense says that inverse relationship in itself cannot logically imply causation.
  • 25.  Regression versus correlation- the strength of association between two variables is correlation ,it is measured by correlation coefficient.  To estimate or predict the average value of one variable on the basis of the fixed variable.  In regression analysis there is an symmetry in the way the dependent and explanatory variables are treated. in correlation, variables are symmetrically.
  • 26.  Explained variable  Predictand  Regressand  Response  Endogenous  Outcome  Controlled variable  Independent variable  Predictor  Regressor  Stimulus  Exogenous  Covariate  Control variable Dependent variable Explanatory variable
  • 27. TYPES OF DATA IN ECONOMETRICS  Time series data-  consists of observations on a variable or several variables over time.  Chronological ordering  Frequency of time series data: hour, day, week, month, year  Time length between observations is generally equal  Examples of time series data include stock prices, money supply, consumer price index, gross domestic product, annual homicide rates, and automobile sales figures.
  • 28.
  • 29. Cross sectional Data • Data collected at the same point of time • consists of a sample of individuals, households, firms, cities, states, countries, or a variety of other units, taken at a given point in time • Significant feature: random sampling from a target population • Generally obtained through official records of individual units, surveys, questionnaires (data collection instrument that contains a series of questions designed for a specific purpose) • For example, household income, consumption and employment surveys conducted by the Turkish Statistical Institute (TUIK/TURKSTAT)
  • 30.
  • 31. Pooled data  it is combined ,data are elements of both time series and cross section data  consists of cross-sectional data sets that are observed in different time periods and combined together  At each time period (e.g., year) a different random sample is chosen from population  Individual units are not the same  For example if we choose a random sample 400 firms in 2002 and choose another sample in 2010 and combine these cross-sectional data sets we obtain a pooled cross- section data set.  Cross-sectional observations are pooled together over time.
  • 32.
  • 33. Panel Data (longitudinal data) • Also known as Micropanel data. • it is a special type of pooled data inwhich the same cross sectional unit is surveyed over time • consists of a time series for each cross-sectional member in the data set. • The same cross-sectional units (firms, households, etc.) are followed over time. • For example: wage, education, and employment history for a set of individuals followed over a ten-year period. • Another example: cross-country data set for a 20 year period containing life expectancy, income inequality, real GDP per capita and other country characteristics
  • 34.
  • 36. Significance of error term • Vagueness of theory • Unavailability of data • Randomness in human behavior • Poor proxy variable • Principle of parsimony (extreme unwillingness) • Wrong functional form