Downloaded 131 times
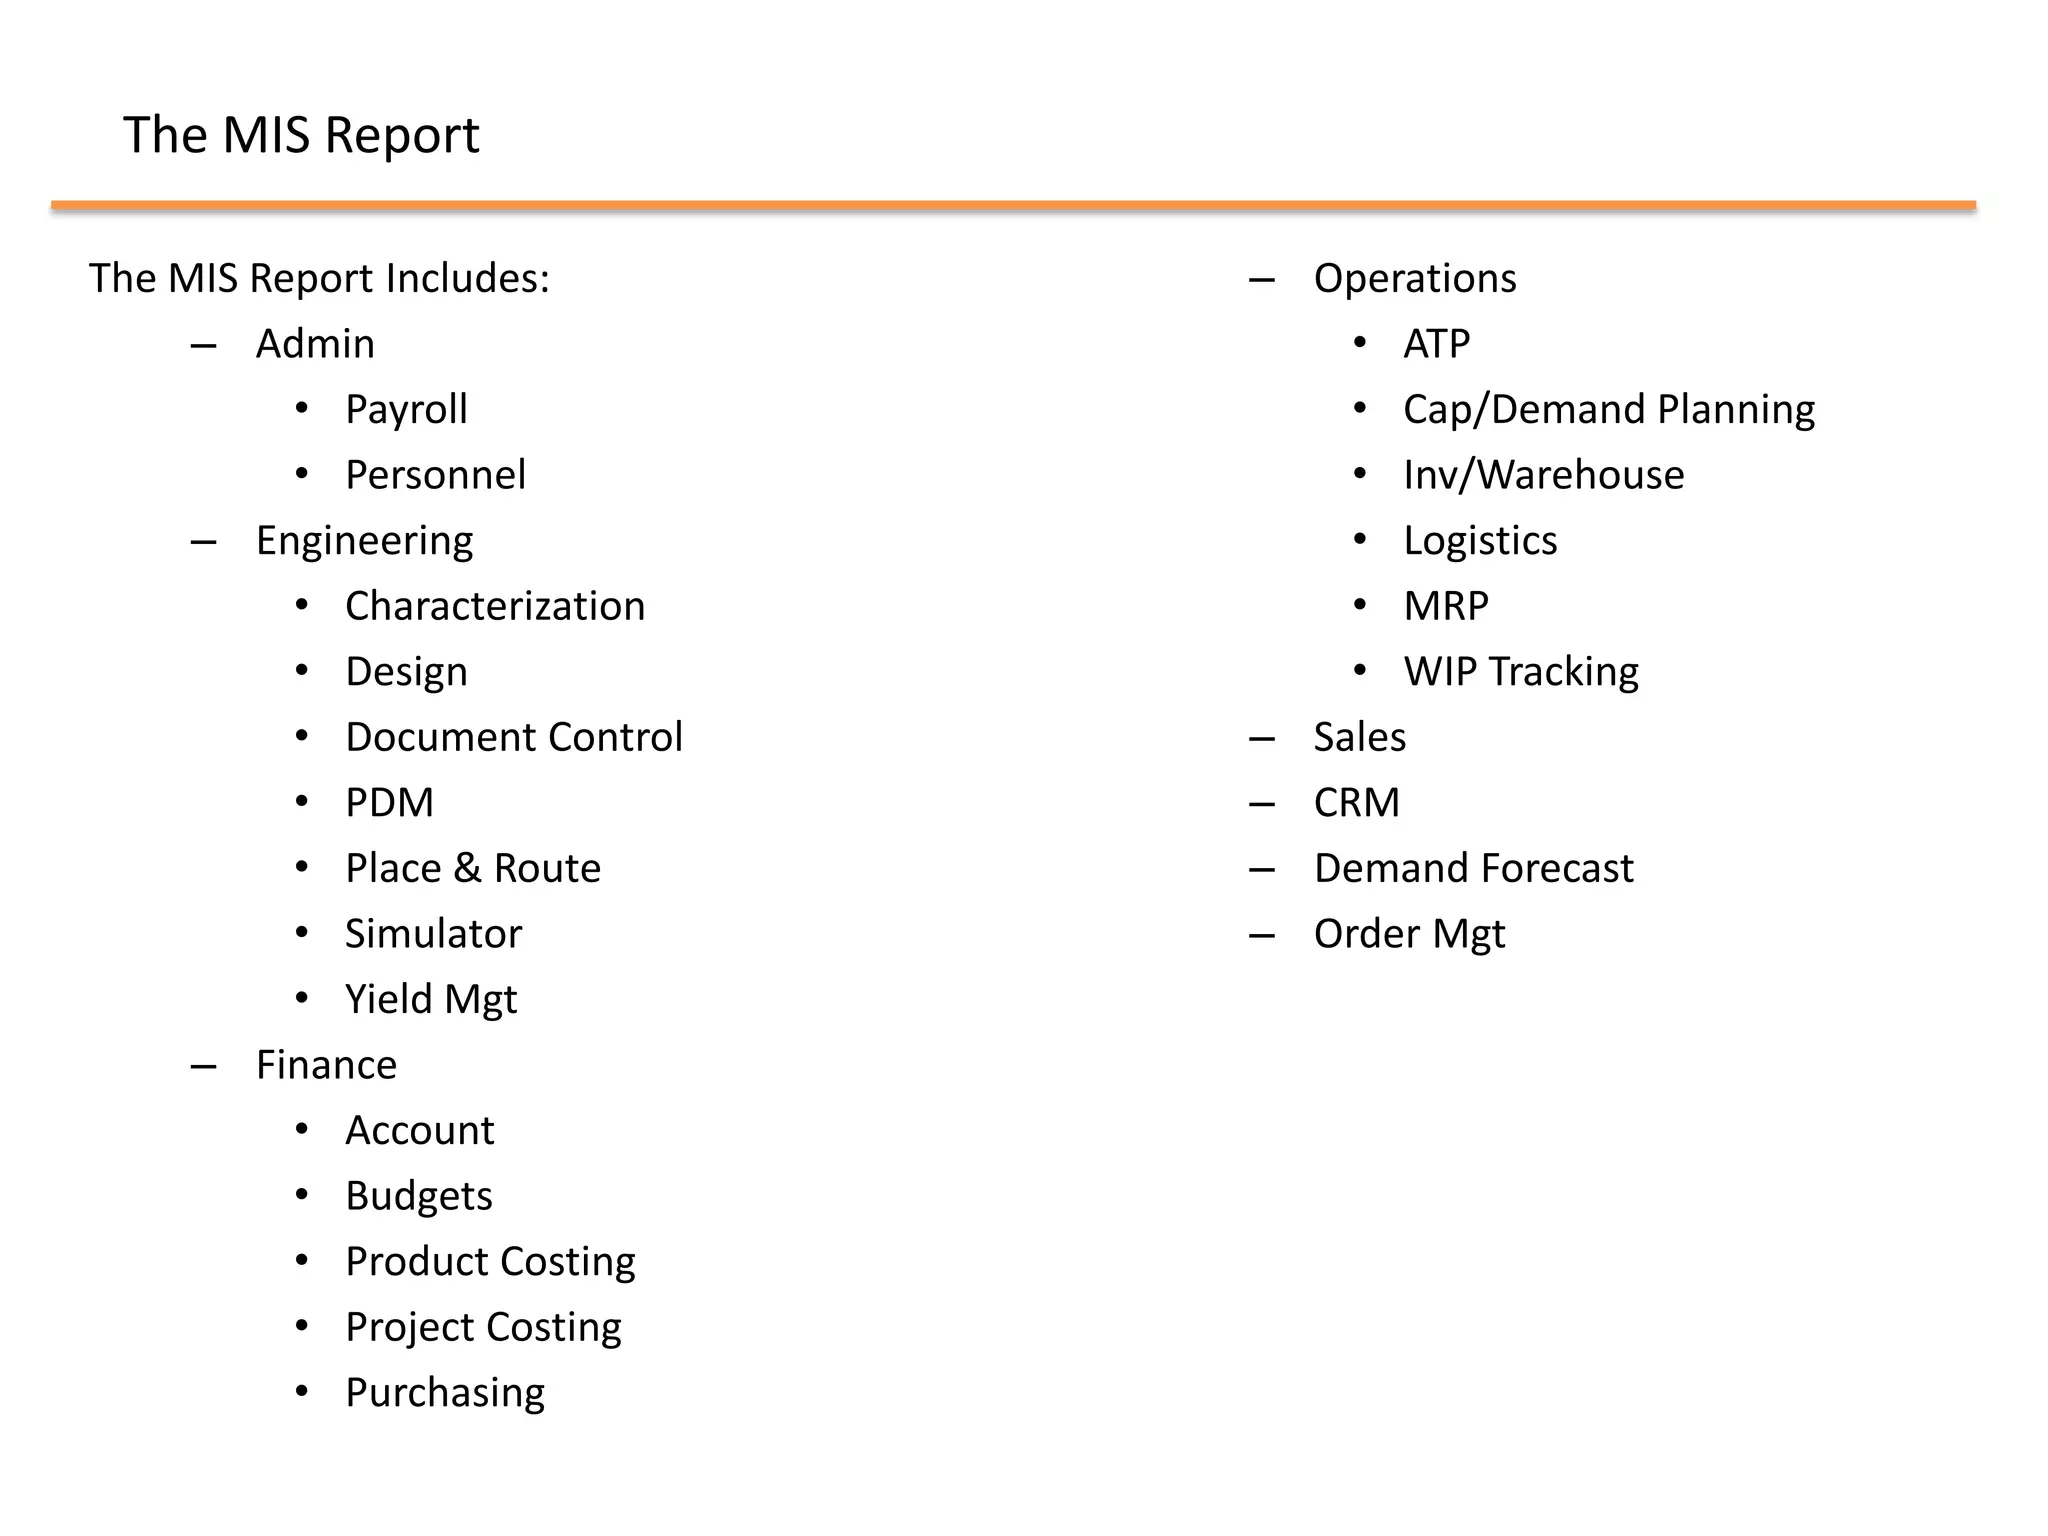
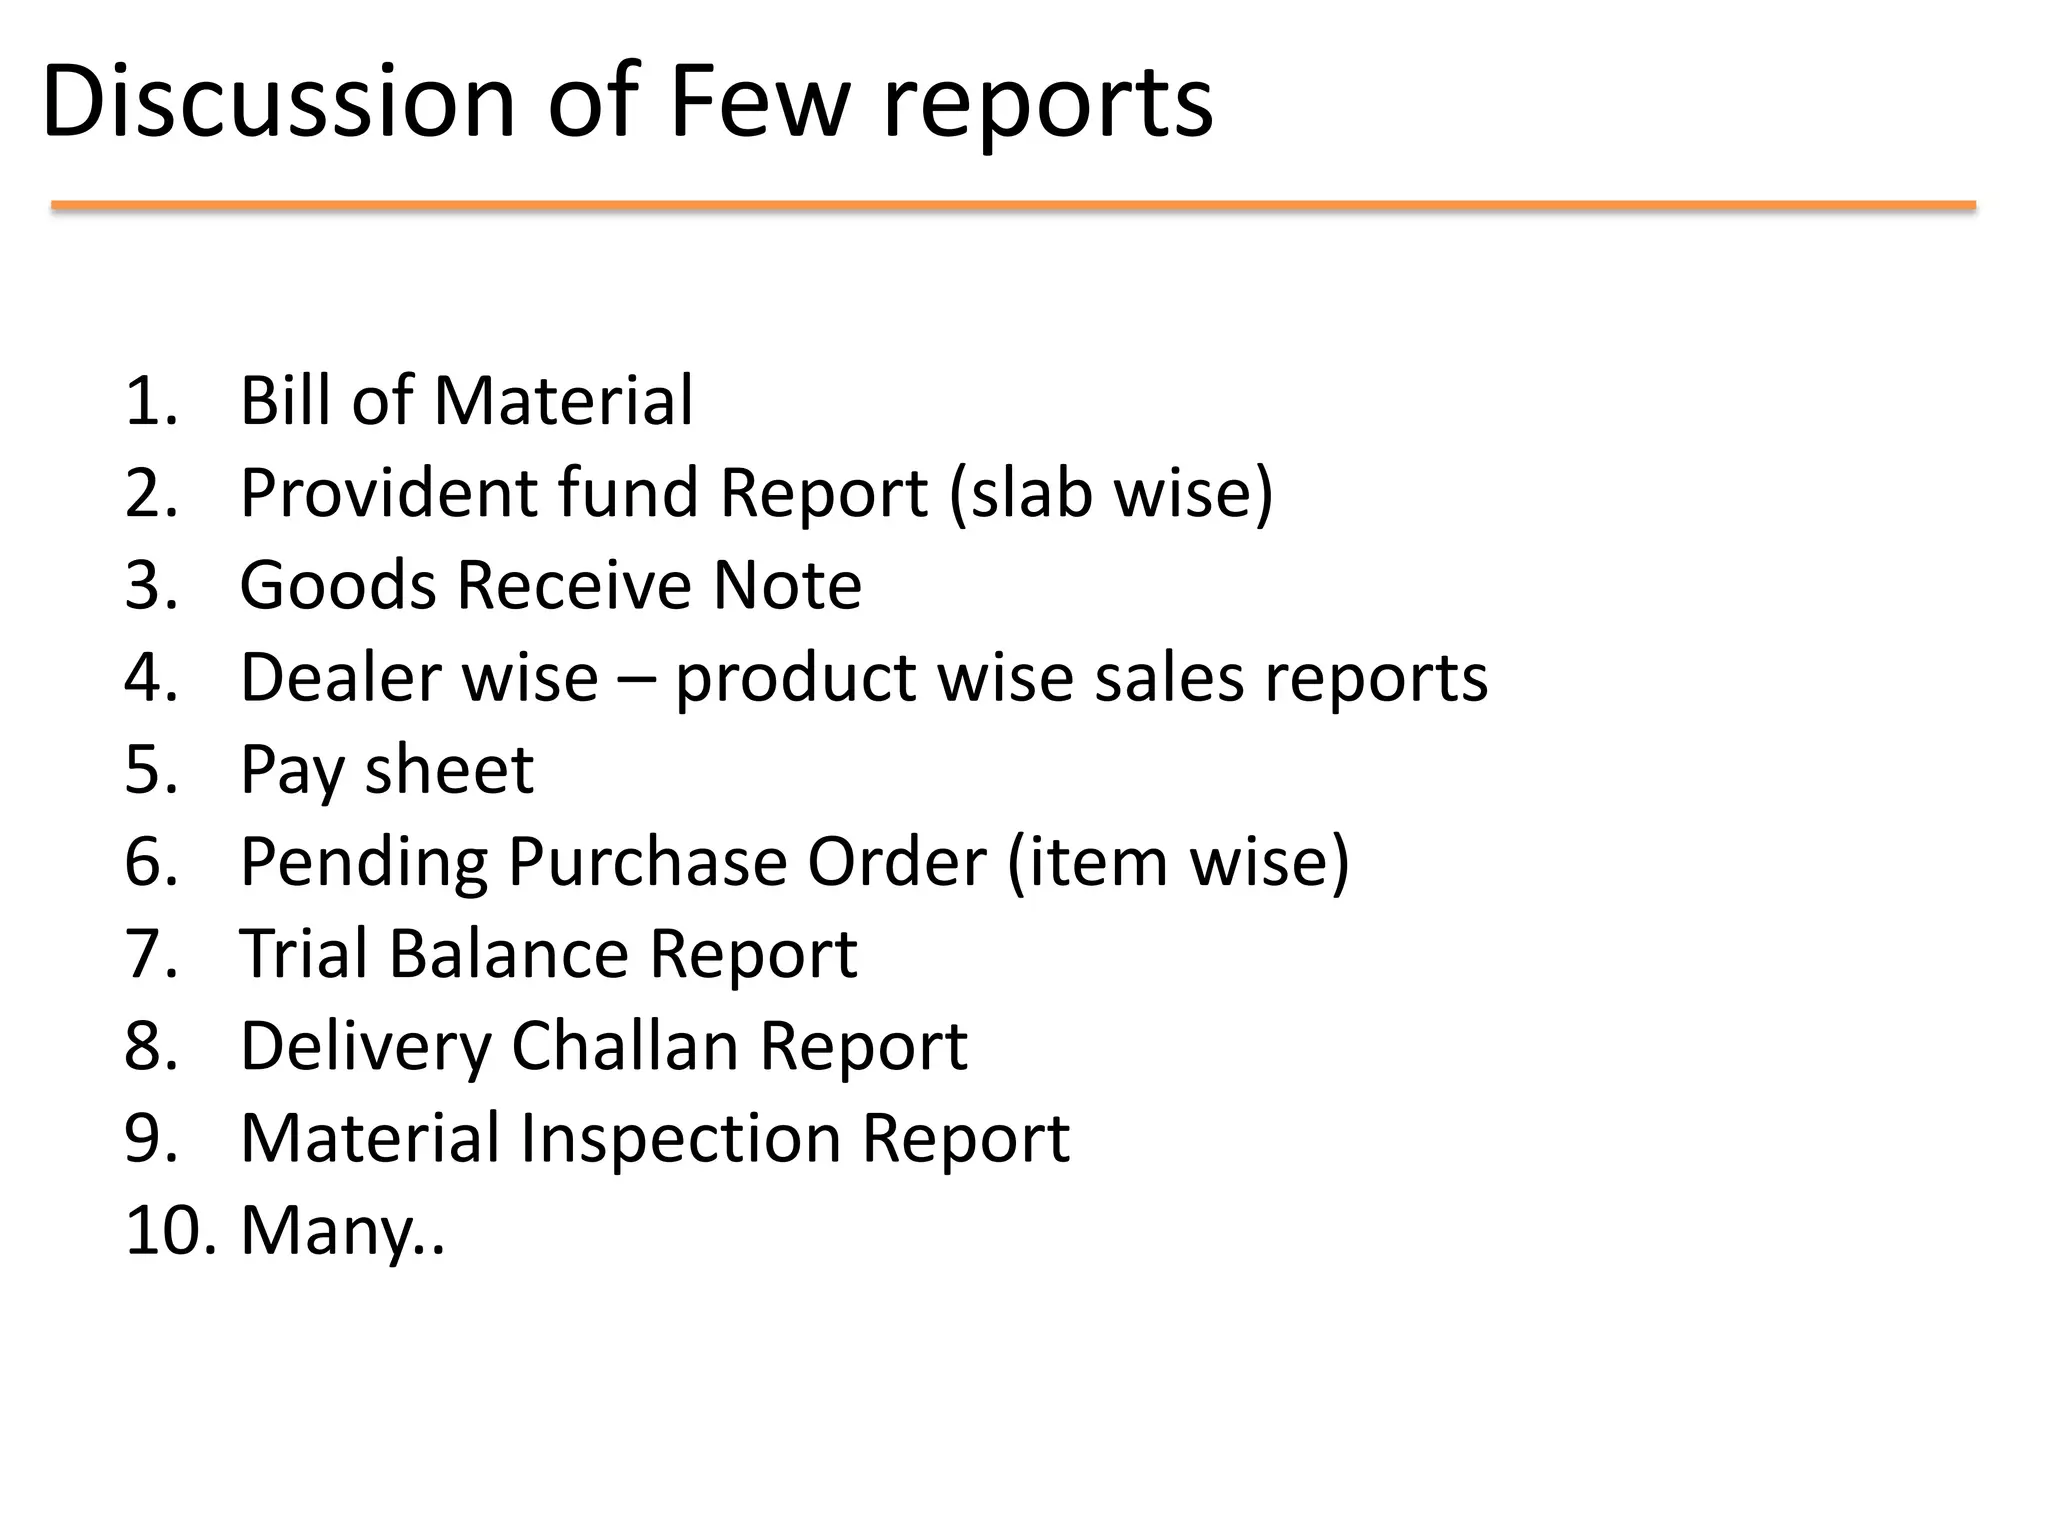
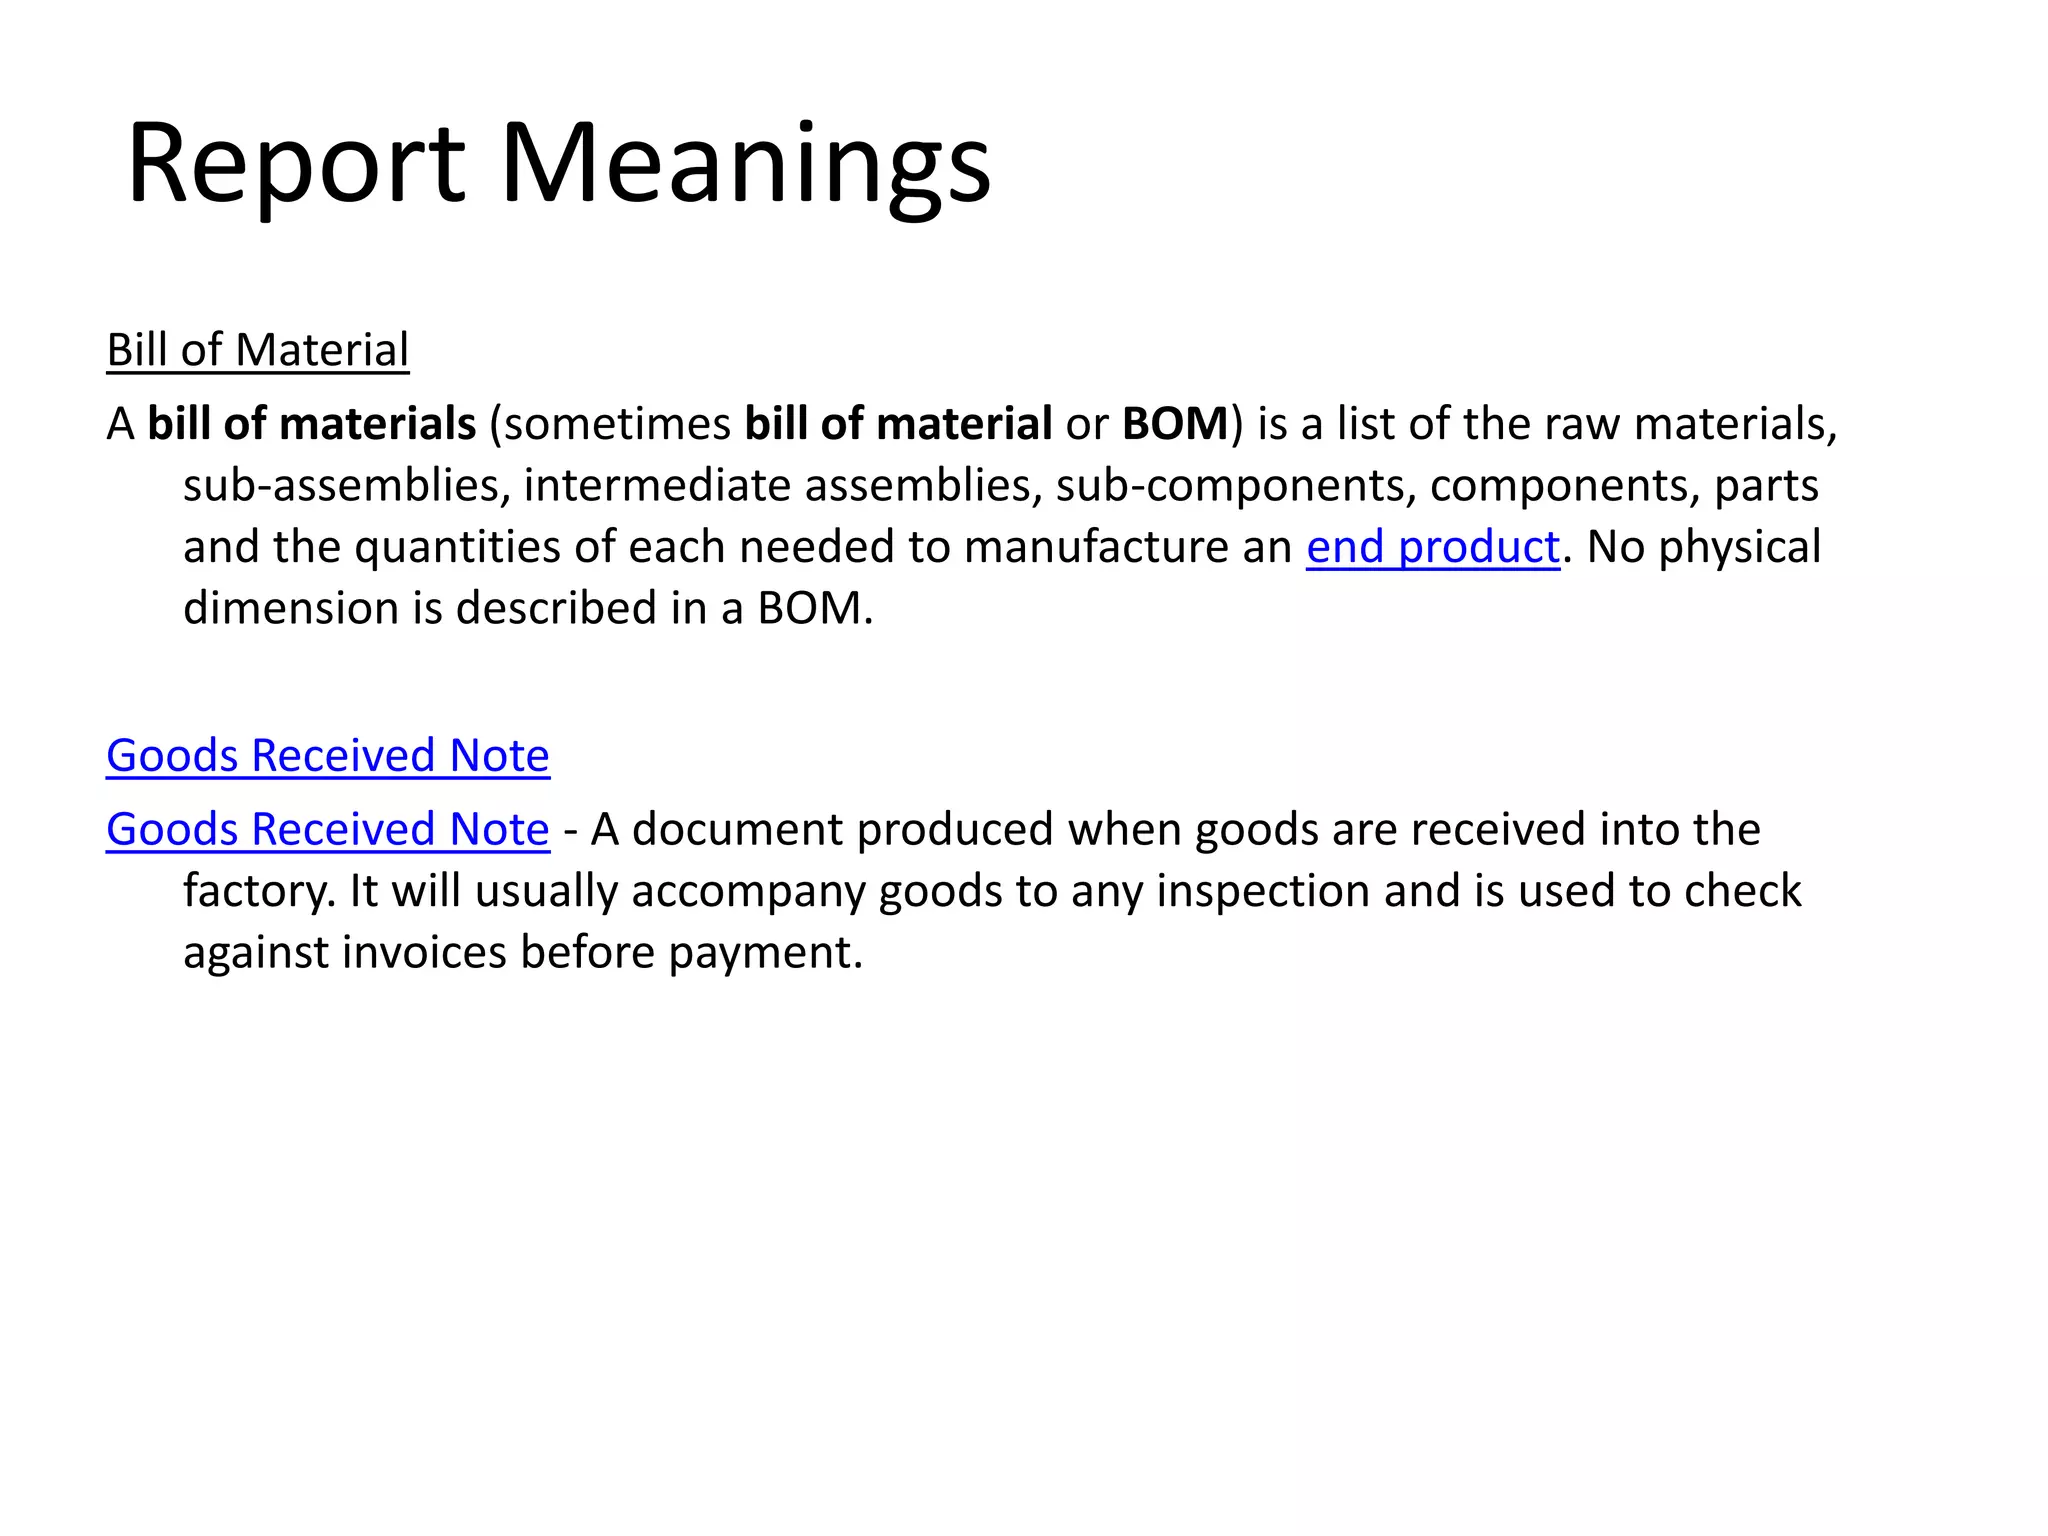
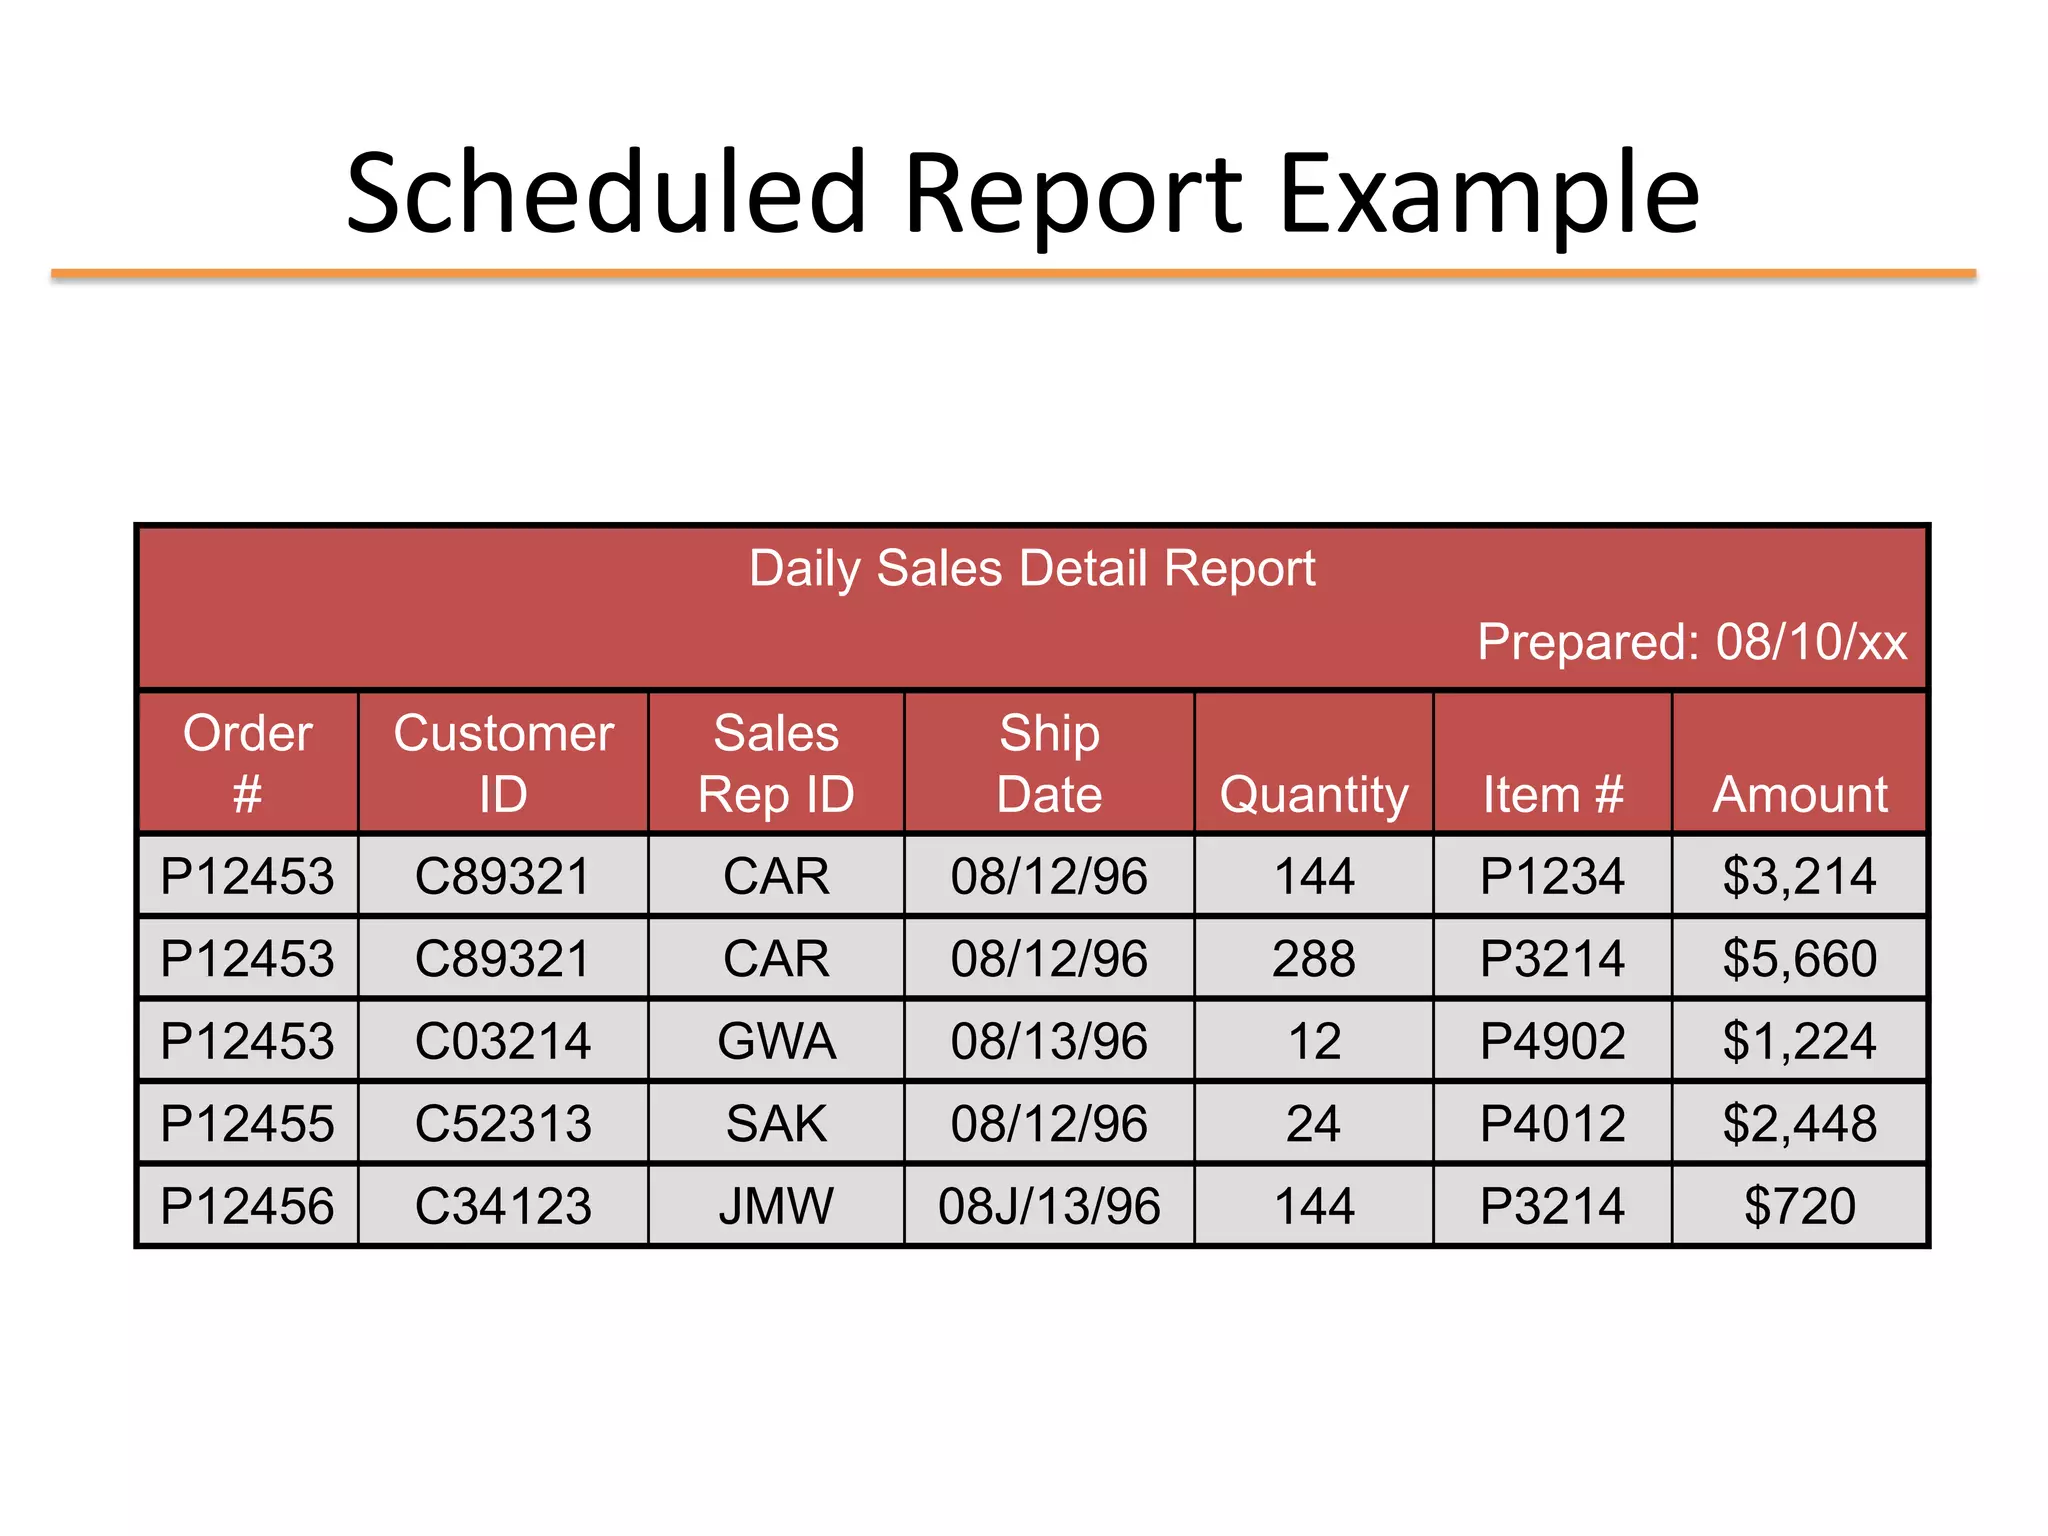
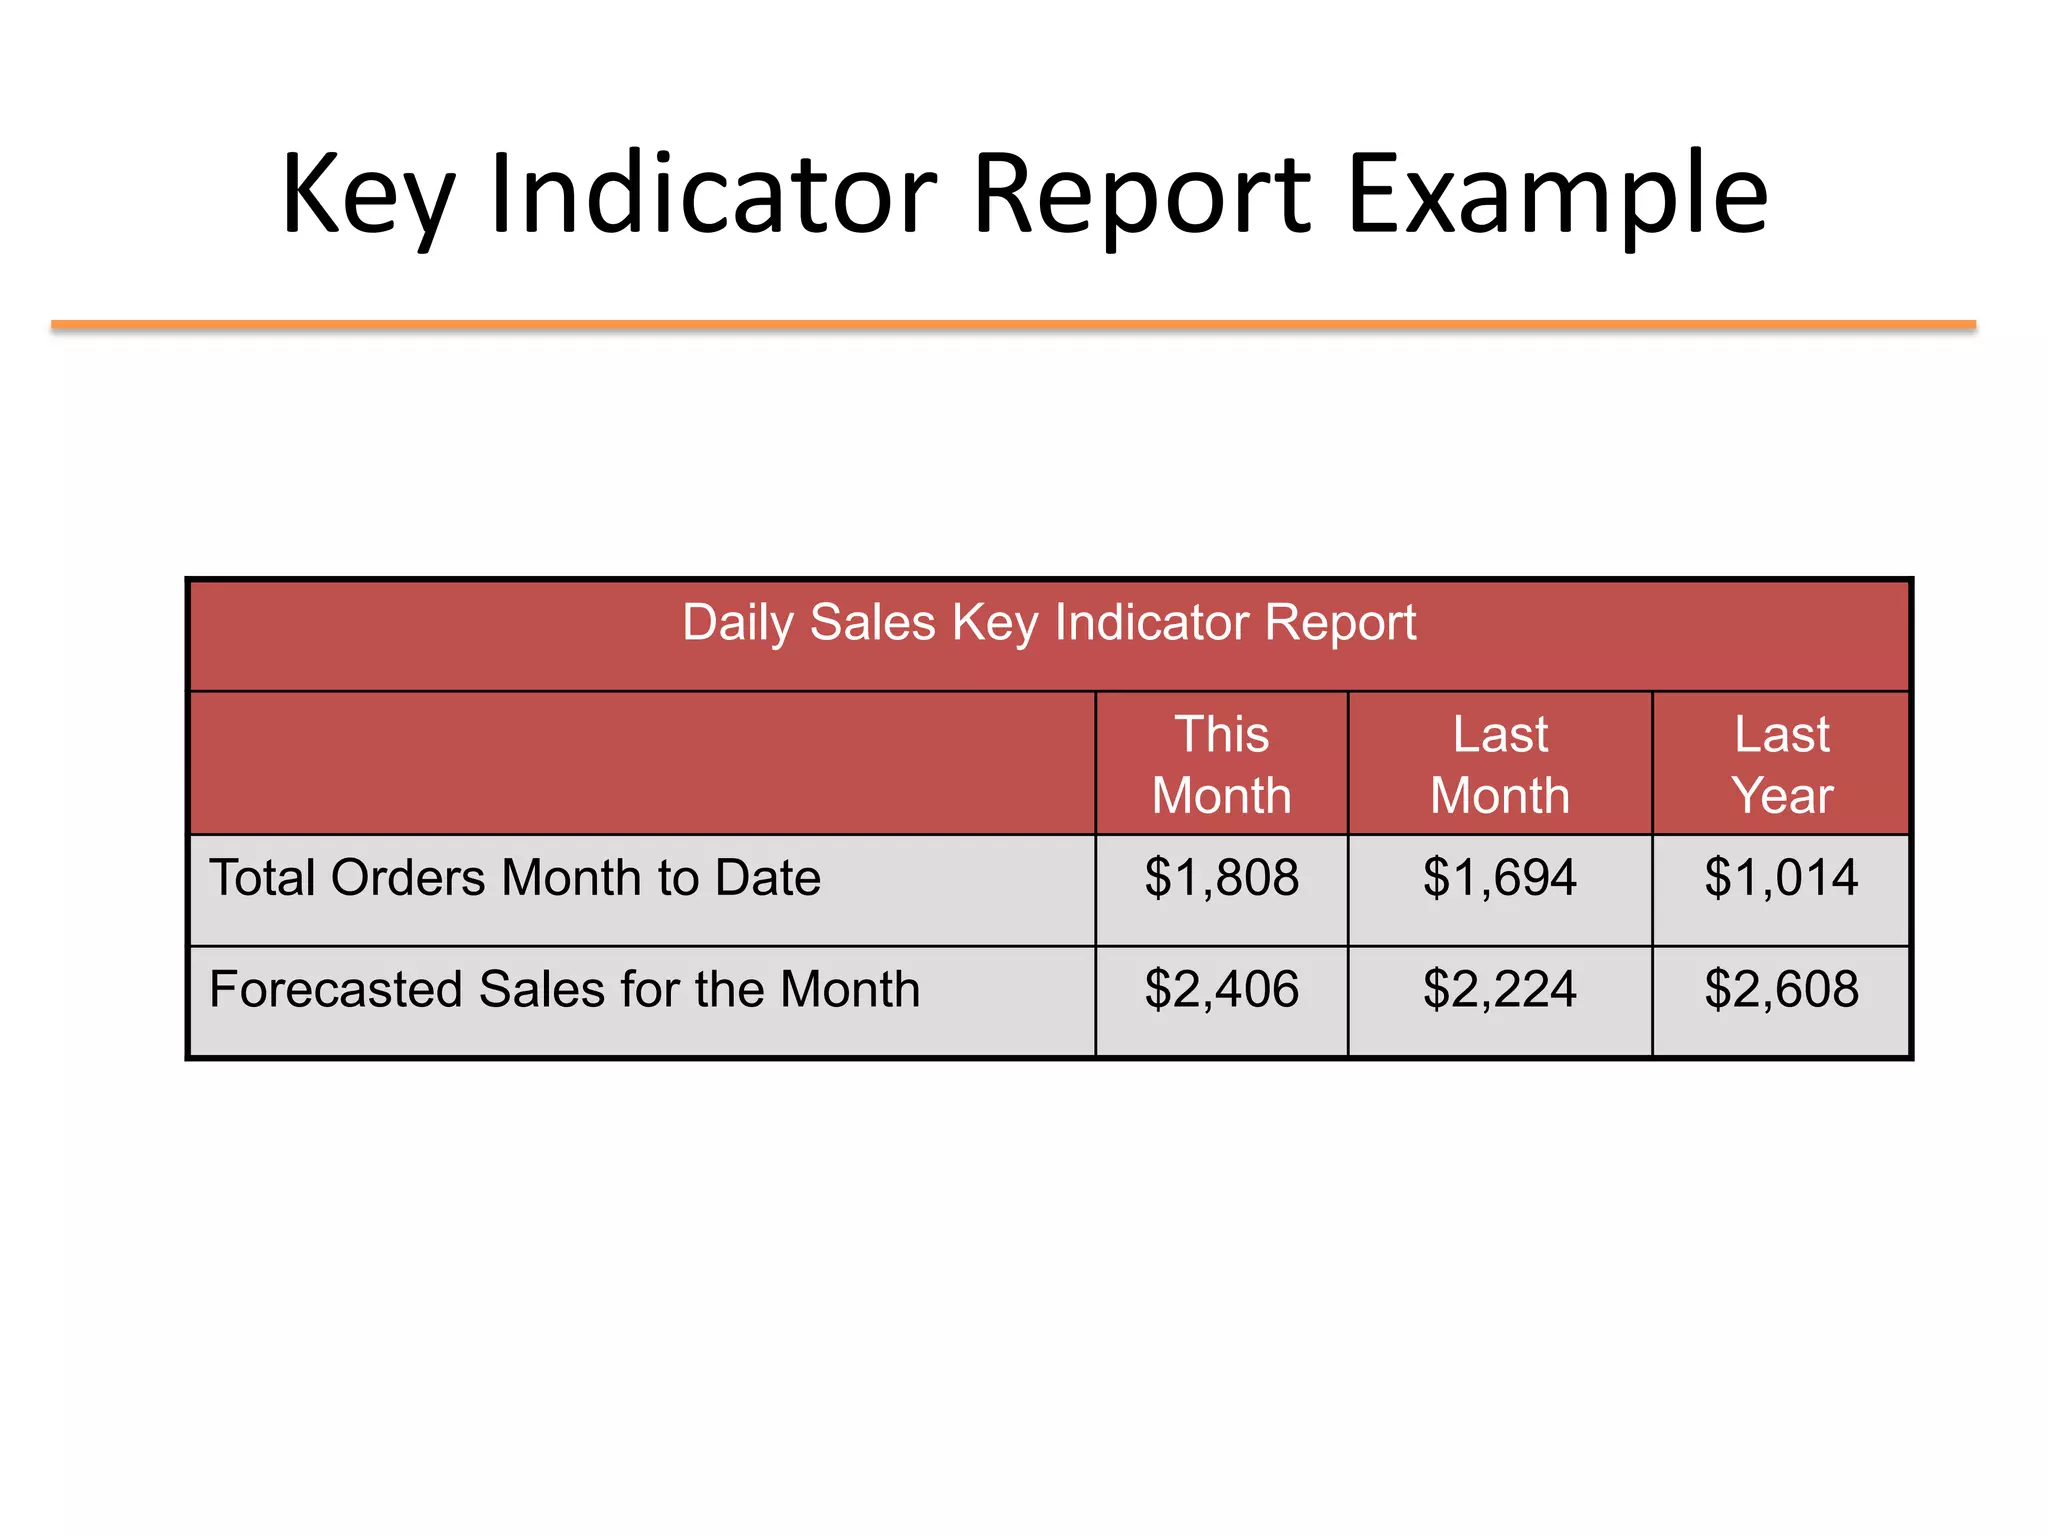
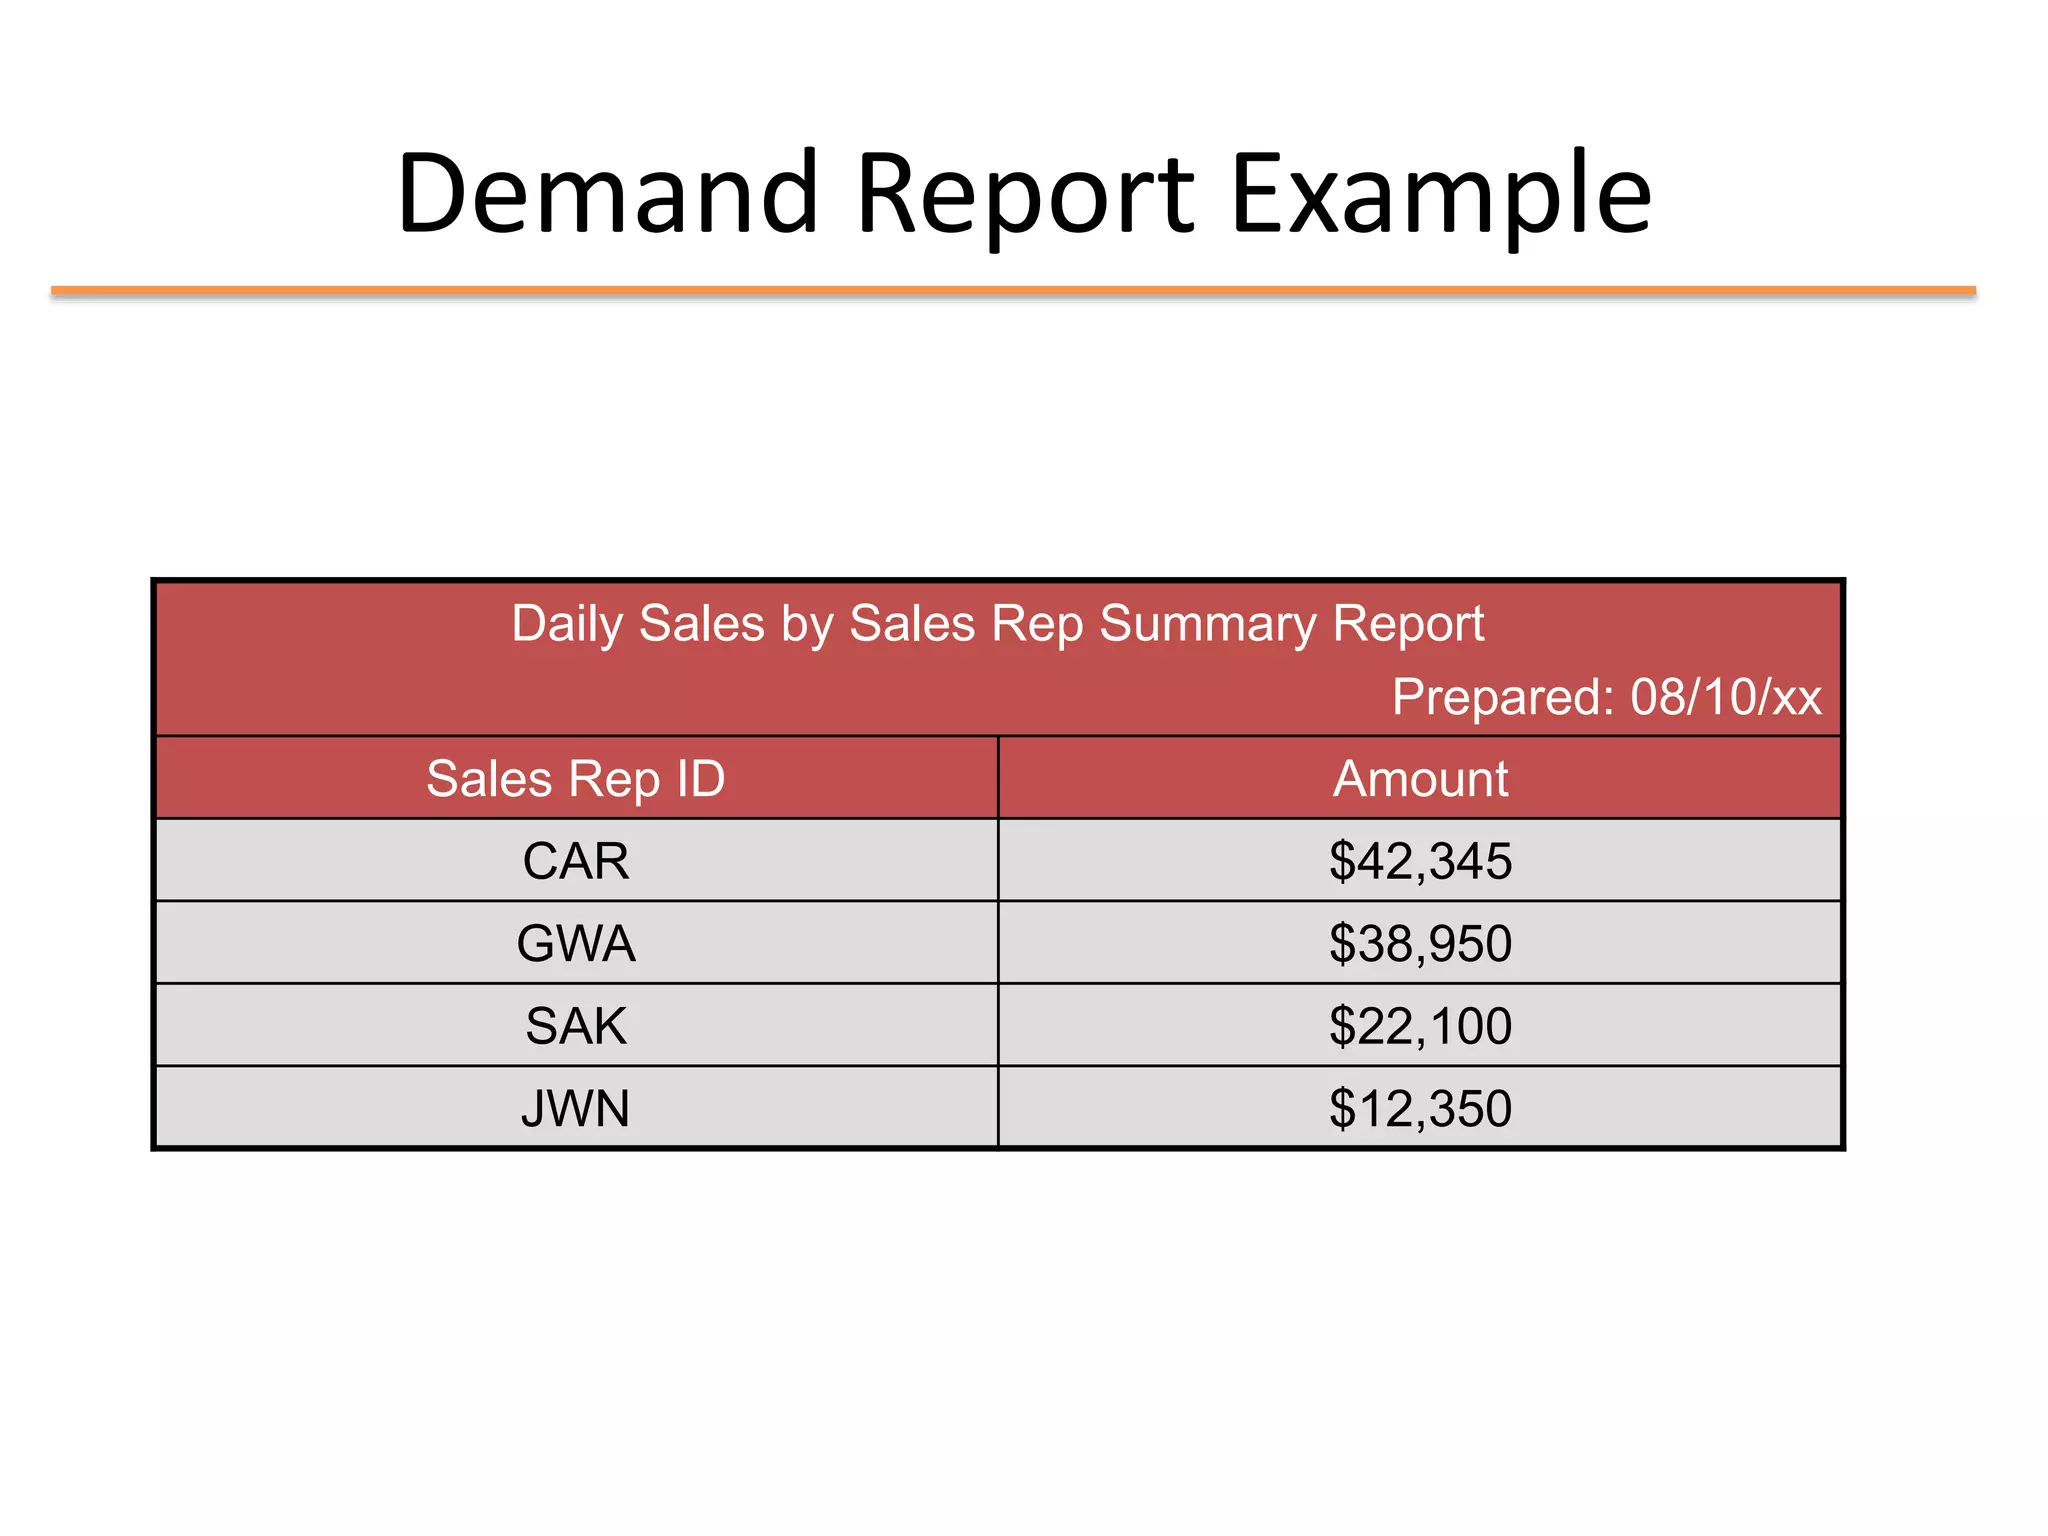
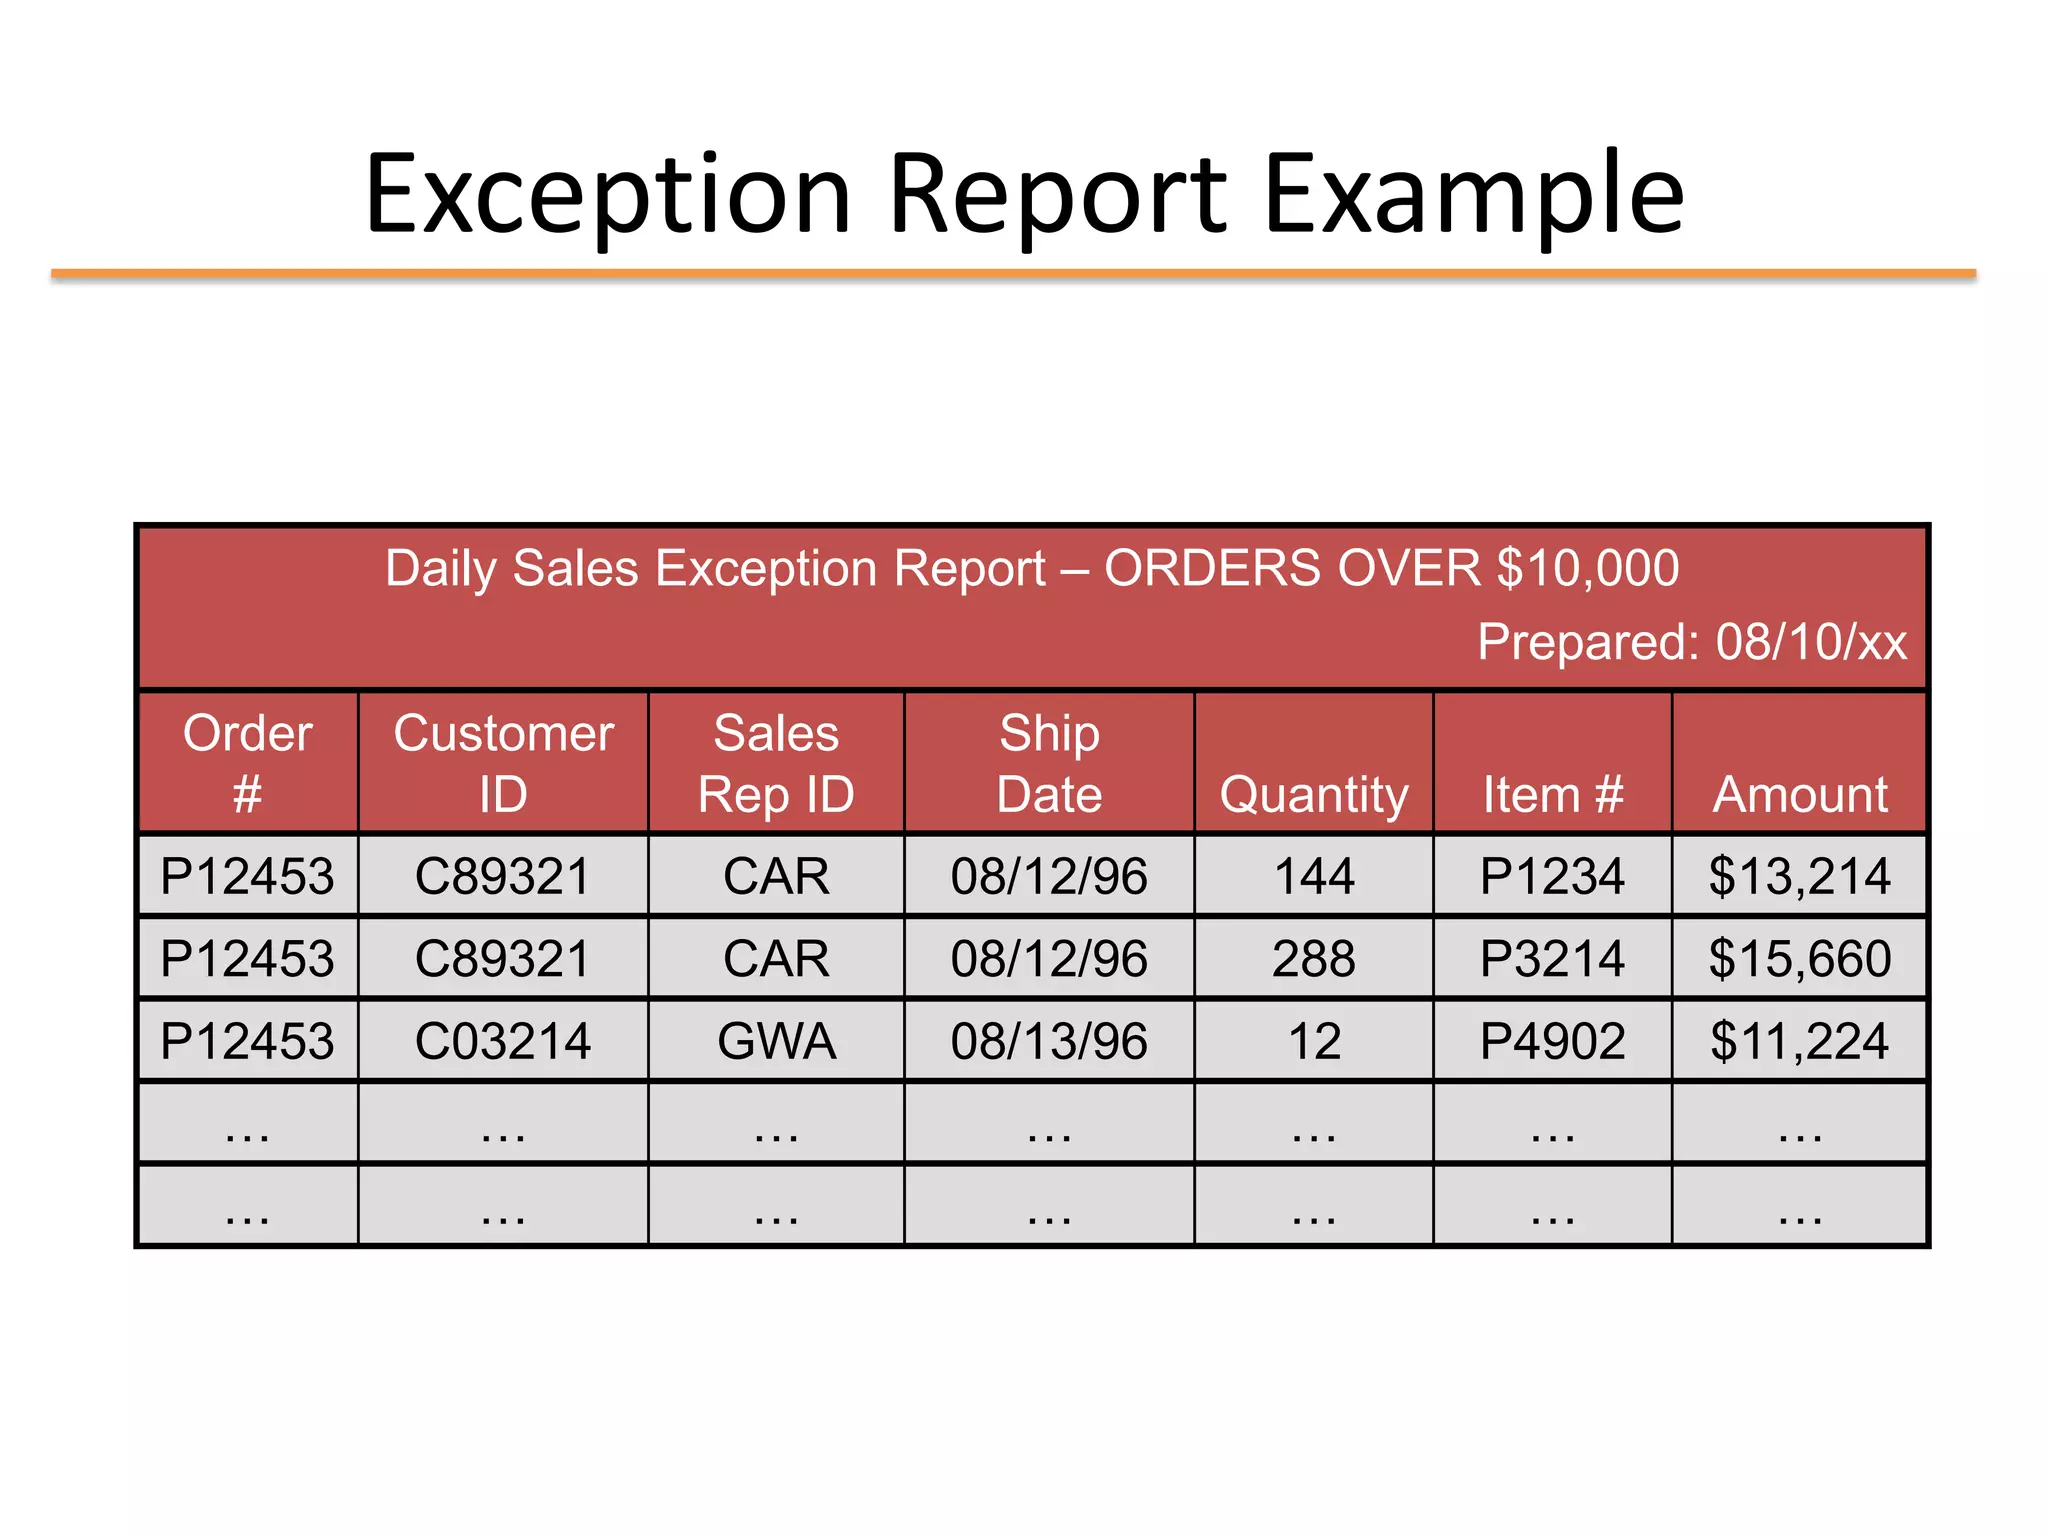
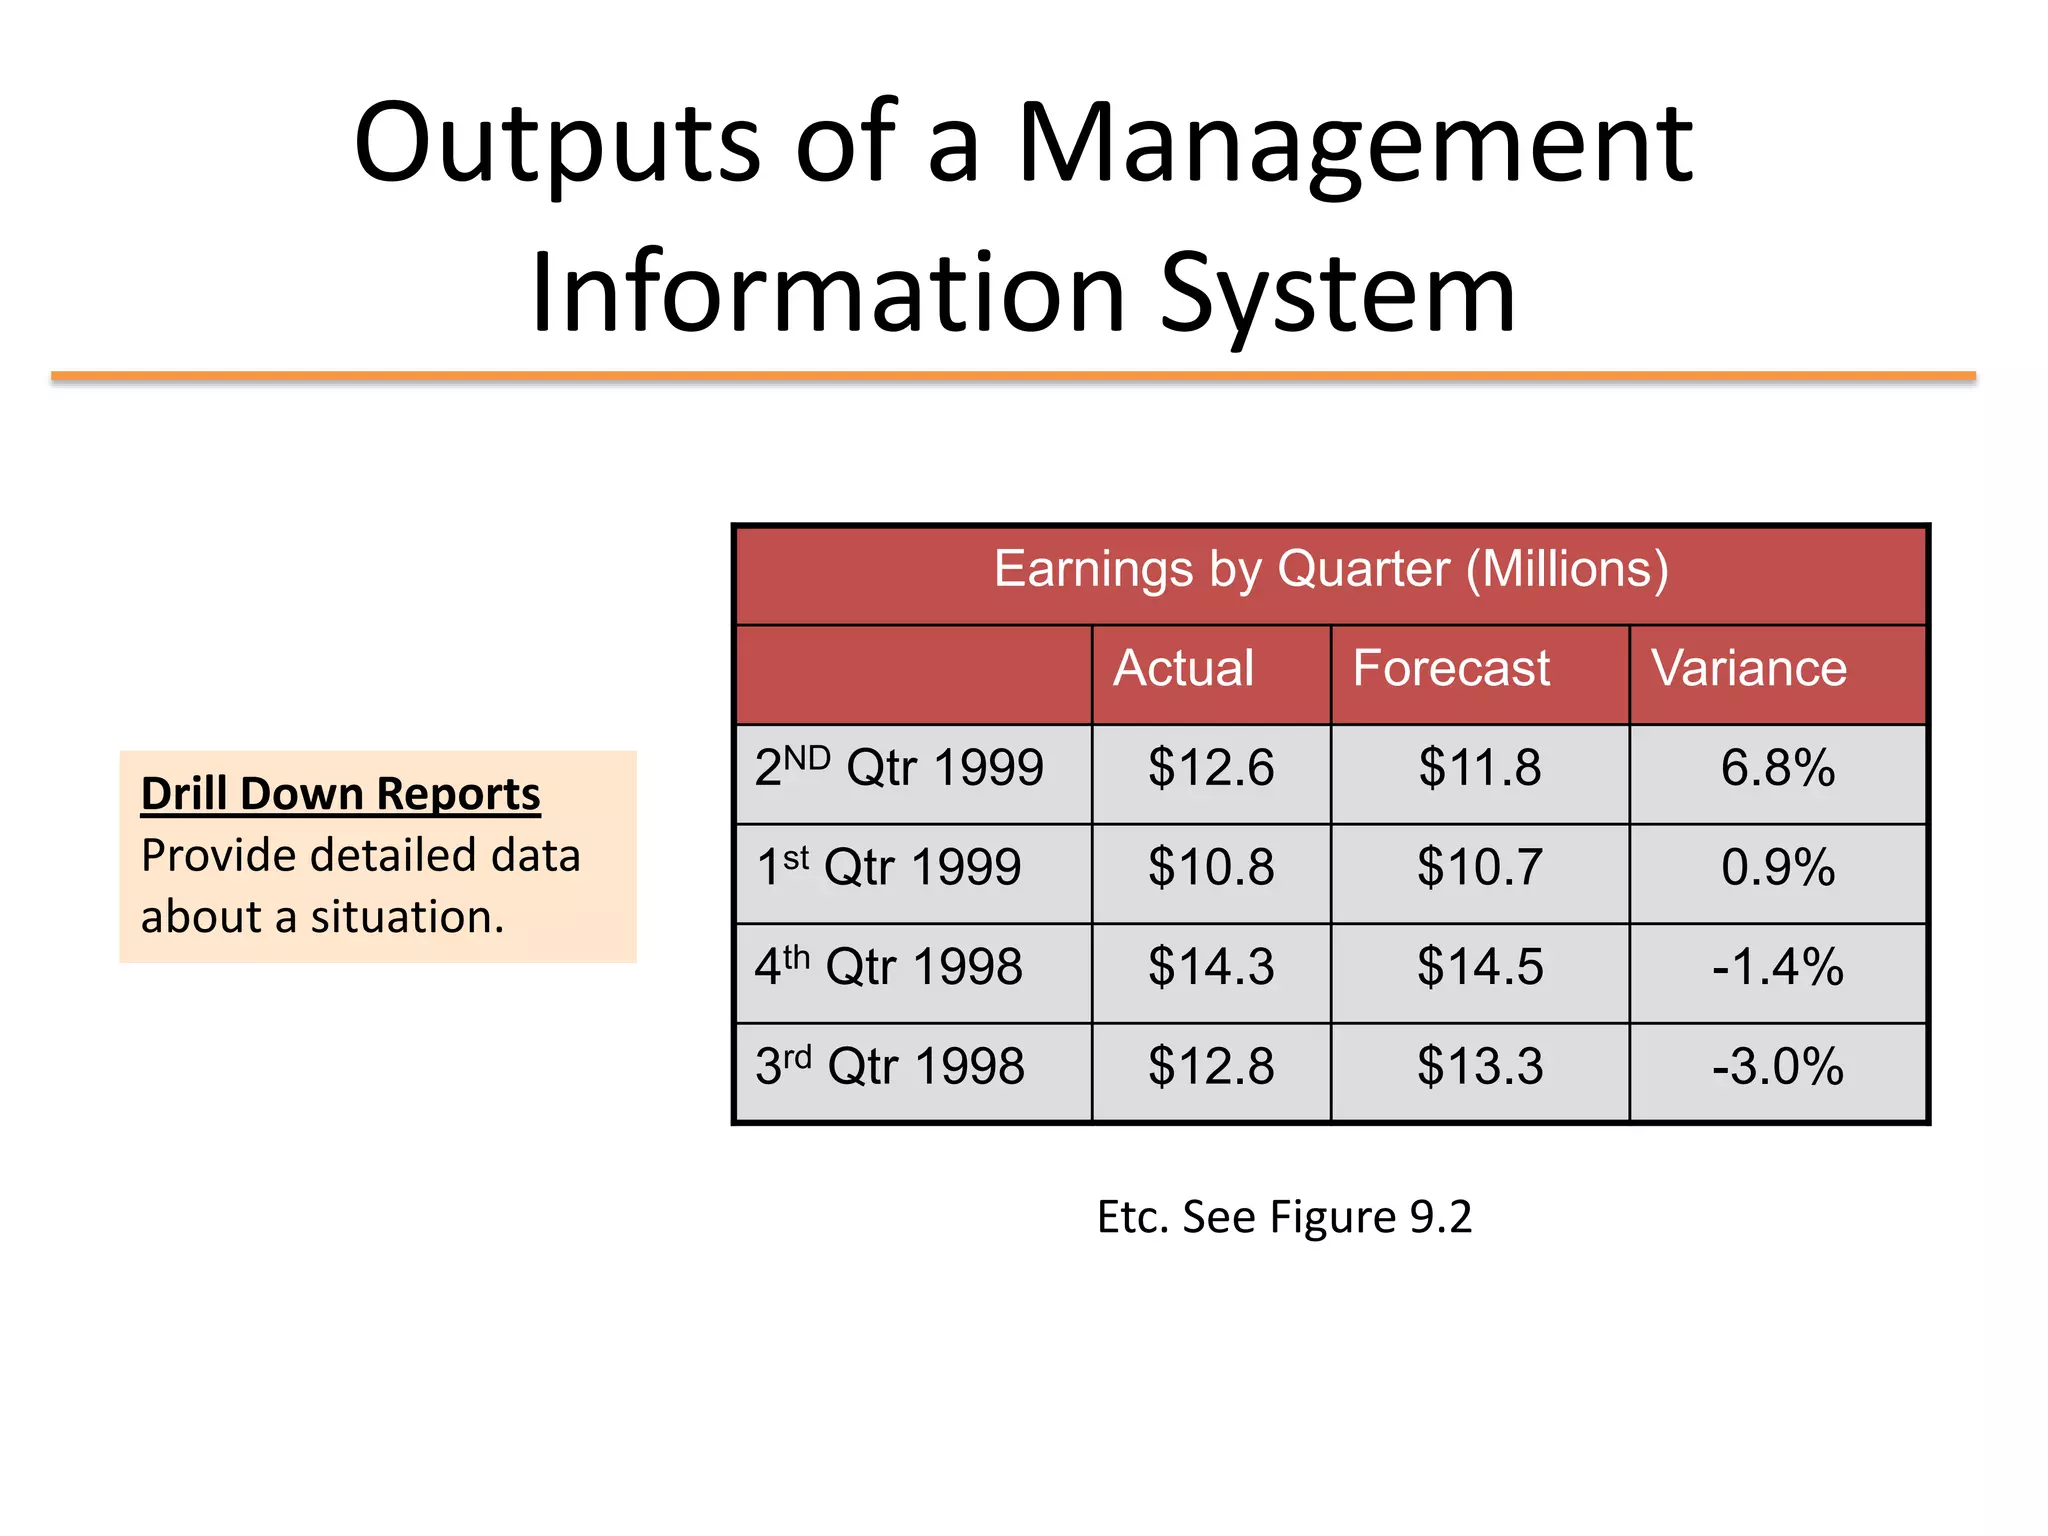

The MIS report includes various operational, administrative, engineering, finance, sales, and CRM reports. Some example reports discussed are the bill of materials, goods receive note, sales by product and dealer, payroll, pending purchase orders, trial balance, and delivery challan. The document also provides examples of daily sales detail, key indicator, demand by sales rep, and exception reports. Finally, it discusses drill down reports in MIS that provide detailed data to analyze situations like quarterly earnings performance versus forecasts.