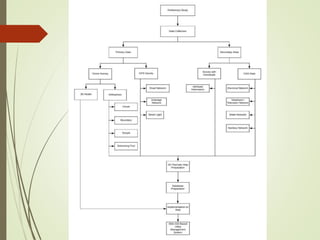
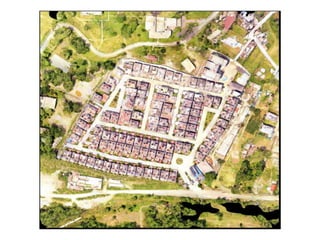
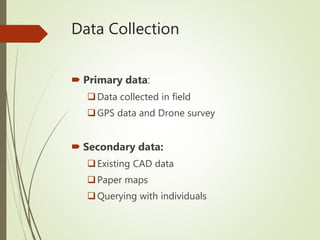
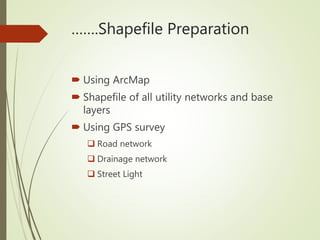
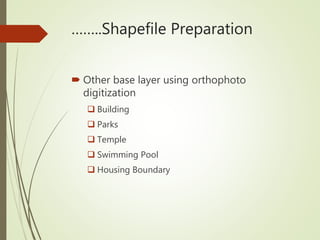
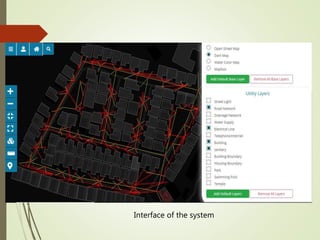
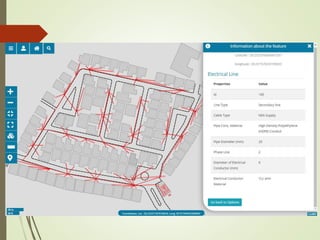
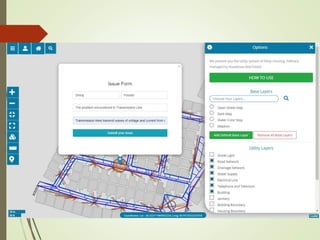
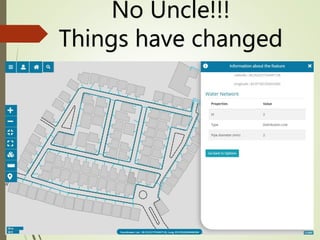
This is the presentation of the project we did as a part of our final year project. We have developed a utility management system for a housing company using web GIS. Please feel free to contact in case of any queries.
This document provides an introduction to Geographic Information Systems (GIS). It defines GIS as a computer system for capturing, storing, manipulating, analyzing and presenting spatially-referenced data. The document discusses examples of GIS applications, the history of GIS from the 1970s to present, and its use in fields like urban planning, hydrological modeling and the water sector. It also compares open source GIS software like QGIS to proprietary software like ESRI ArcGIS, and reviews some key open source GIS tools including GDAL, Python and OSGeo4W.
GIS is a system for managing and analyzing geographic data. It uses two main data models: vector, representing points, lines and polygons; and raster, representing data as a grid of cells. Common file formats include shapefiles for vector data and GeoTIFF and MrSID for raster. GIS data is referenced using coordinate systems like WGS84 for global latitude/longitude or HK80Grid for Hong Kong. ESRI's ArcGIS software allows viewing, editing, and publishing this geospatial data for mapping and analysis.
Future of GIS, Moving to the Enterprise PlatformSSP Innovations
The document discusses how utilities are moving towards enterprise GIS platforms to better integrate and analyze spatial and asset data across their organizations. It provides examples of how Memphis Light Gas & Water and Middle Tennessee Electric Membership Corporation leveraged ArcGIS Online and mobile data collection to improve their asset management and field operations by exposing new types of data to field crews and collecting additional information. The key is for utilities to focus on exposing new data sources, collecting data from the field, and empowering operations through spatial analysis, systems integration and workflows.
The basic intention of this presentation is to help the beginners in GIS to understand what GIS is? It is a simple presentation about GIS, i mean an introductory one. Hope anyone finds it useful.
A network is a system of interconnected elements, such as edges (lines) and connecting junctions (points), that represent possible routes from one location to another.
Here I explained introduction to the network analysis in GIS.
The document discusses Land Information Systems (LIS), which are Geographic Information Systems that contain cadastral and land use data. A LIS contains accurate, current, and reliable land records and associated attributes. It maintains both spatial and non-spatial data for each land parcel digitally, allowing edits and updates with minimal effort. The document outlines the Western concept of LIS, how LIS are implemented around the world, and proposes developing a LIS for Sri Lanka by integrating land parcel data into a Land Data Infrastructure to help manage municipalities.
Gis Geographical Information System FundamentalsUroosa Samman
Gis, Geographical Information System Fundamentals. This presentation includes a complete detail of GIS and GIS Softwares. It will help students of GIS and Environmental Science.
This document provides an overview of key concepts in GIS including shapefiles, grids, rasters, vectors, DEM, TIN, coordinate systems, and common file formats. It discusses the differences between raster and vector data, and explains that shapefiles are commonly used to store vector data while grids are used for raster data. DEM and TIN are introduced as methods for representing elevation data. The document also covers projected and unprojected coordinate systems and provides examples of coordinate systems. Common file formats for both raster and vector data are listed.
This document provides an overview of ESRI and ArcGIS. It discusses that ESRI was founded in 1969 and began developing GIS tools in the 1980s, releasing their first commercial software ARC/INFO in 1982. It then summarizes the history of ArcGIS, including the releases of ArcView in the 1990s, ArcGIS 8.X in 1999, and ArcGIS 9.X in 2004. The document also outlines the different ArcGIS Desktop components and levels, as well as the industries where ArcGIS is applicable, such as agriculture, utilities, government, and more.
Mobile GIS allows field workers to capture and edit geographic data on mobile devices. It integrates GPS, mobile devices, and wireless communications to access GIS data from the field. The main benefits are improved field efficiency and data accuracy. ESRI provides several mobile GIS apps, including ArcPad for data collection, and apps for Windows, iOS, and Android devices that can access maps and perform analysis in the field. Mobile GIS systems connect mobile devices running GIS software via wireless networks to central GIS servers to share and sync field data.
This document provides an introduction to geographic information systems (GIS) and mapping software. It discusses that GIS integrates spatial data by capturing, storing, analyzing, displaying, and outputting different layers of information. These layers can represent data as either raster images made of cells or vector features defined by points, lines, and polygons with associated attributes. The document recommends QGIS as open source software that is easy to learn and has an active user community for creating and analyzing maps.
This document provides an introduction to geographic information systems (GIS). It defines GIS as a collection of hardware, software, and geographic data used to capture, store, analyze and display spatially referenced information. The document gives a brief history of GIS and describes its key components, including spatial data, attribute data, software, and users. It also explains different types of data layers, scales, and four common map types: choropleth, contour, dot, and symbol maps. The overall purpose of the document is to explain the basic concepts and applications of GIS.
A Geographic Information System (GIS) integrates hardware, software and data to capture, store, analyze and display spatially-referenced information. GIS allows users to view, understand, question, interpret, and visualize data in many ways that reveal relationships, patterns, and trends. Key components of a GIS include hardware, software, data, methods, and personnel with GIS expertise. GIS differs from other graphics systems in its ability to geo-reference data, use relational databases to link spatial and non-spatial data, and overlay multiple data layers in a single map.
This document discusses GIS topology, which establishes rules for how geographic features share geometry and spatial relationships. Topology ensures data quality, enhances analysis, and manages coincident geometry. It has three components: connectivity between nodes and arcs, area definition using polygon boundaries, and contiguity to determine adjacent features. Topological rules prevent errors like overlaps, gaps, dangles and ensure proper containment of points and boundaries.
GIS stands for geographic information system. It involves capturing, storing, manipulating, analyzing and displaying spatially referenced data on Earth. GIS is unique in that it handles spatial information referenced by location. It developed from technologies like digital cartography, CAD, and database management systems. The core components of a GIS are spatial data, hardware/software tools, and specific applications. Spatial data has characteristics like geometry, topology, location with attributes. GIS data can be stored in vector or raster models. GIS provides benefits like better information management, analysis, and scenario modeling for applications in facilities management, environmental analysis, transportation and more.
This document discusses the key functions of a geographic information system (GIS). It explains that a GIS allows users to capture, store, query, analyze, display and output geographic data. It describes the vector and raster data models used to store spatial data. The document also outlines the three main views of a GIS - the geovisualization view which includes maps, the geodata view which is the spatial database, and the geoprocessing view which involves tools to transform and derive new information from existing datasets. Finally, it discusses some key concepts for GIS maps including layers, features, attributes, and scale.
Unmanned Aerial Systems for Precision MappingUAS Colorado
Presentation by Renee Walmsley, Remote Sensing Program Manager at Tetra Tech, for the August 16, 2017 Rocky Mountain UAS Professionals Meetup at the Esri Broomfield office.
This document provides an overview of basic concepts in geographic information systems (GIS). It defines GIS as a system for capturing, storing, integrating, analyzing and displaying spatially-referenced data. Key components of GIS include data input, storage, management, analysis and output. GIS handles spatial data referenced by location and allows analysis of relationships based on spatial proximity. GIS has a wide range of applications in fields like government, agriculture, business, environment and research.
utility networks such as sewer and water systems; rivers and streams
Elements on the network have no choice in travel decision. Flow direction is determined by the network characteristics alone
The document defines GIS as a system for capturing, storing, integrating, manipulating, analyzing and displaying spatially referenced data related to the Earth. It allows for spatial data to be overlaid and analyzed to derive new information and insights. Some key benefits of GIS include better information management, higher quality spatial analysis, ability to model "what if" scenarios, and improved project efficiency through the use of spatial data and tools.
The document presents a presentation on Geographic Information Systems (GIS). It includes sections on what GIS is, its capabilities and components. GIS is a computer system for capturing, storing, analyzing and managing geographic information and spatial data. The key components of a GIS include hardware, software, data and people. GIS has many applications and uses spatial data and analysis to solve problems across many different domains.
Introduction To Geographical Information System (GIS) Ajay Singh Lodhi
This document provides an introduction to geographical information systems (GIS). It defines GIS as a system for capturing, storing, analyzing and managing spatial data referenced to locations on Earth. The key components of a GIS are software, hardware, data, users, and methods. GIS software includes tools for inputting, manipulating, managing, querying, analyzing and visualizing geographic data. GIS data can be represented in vector or raster formats and comes from various sources. GIS is used for applications like resource management, planning, and analysis across many industries.
The document provides an introduction to ArcGIS. It outlines that it will discuss what GIS is, how geographic data is represented in GIS, how data is stored in ArcGIS, GIS maps, GIS analysis processes, what ArcGIS is, and planning a GIS project. It then proceeds to define GIS, explain how geographic data is modeled in vector and raster formats, describe how data is organized and stored in an ArcGIS geodatabase, discuss GIS mapping and visualization, and overview spatial analysis tools in ArcGIS.
GIS Based Project Planning and ManagementSaurabhChobe
This document describes a GIS-based project management system called ProGIS. It allows users to track multiple construction or infrastructure projects on an interactive map. Project managers can view tasks, timelines, images and reports for each project location without traveling to sites. Data from on-site mobile devices is synced to the backend server and displayed on maps. The system was designed with flexibility, security, and support for remote access in mind. It uses open-source LAMP stack technologies and integrates mapping capabilities from GeoServer. Screenshots demonstrate the web and mobile interfaces.
Automated features extraction from satellite images.HimanshuGupta1081
This is the final year civil engineering project presentation in which different features i.e. Buildings, Road Network, Vegetation and Water are extracted automatically from satellite images with the help of Ecognition software. We have done our analysis on satellite images of sikar, rajasthan. In this project object based image analysis (OBIA) approach are used.
Data Visualization GIS and Maps, The Visualization Process Visualization Strategies: Present or explore? The cartographic toolbox: What kind of data do I have?, How can I map my data? How to map?: How to map qualitative data, How to map quantitative data, How to map the terrain elevation, How to map time series Map Cosmetics, Map Dissemination
This document discusses spatial computing and its potential applications for utility GIS. It begins by providing context on the evolution of spatial computing technologies like digital twins and sensor webs. It then discusses several emerging ideas for spatial computing in utilities, such as using digital twins to model urban energy systems, integrating predictive models across domains, and enabling geo-enabled edge computing. Finally, it considers the technology evolution required to realize these opportunities through standards, interoperability, and integrating emerging techniques like semantics and artificial intelligence.
Vikas Bhatt is an IT professional with 10 years of experience in GIS technologies. He has worked as a Sr. GIS Engineer for Rolta India Ltd. and has experience managing utility projects in GIS for clients in the UK and Netherlands. He is proficient in GIS tools like ArcGIS, ArcFM, Smallworld, and Autocad. Bhatt holds an M.Com degree in Management and seeks a challenging career opportunity in the IT industry.
Super map solution for mobile surveying and 3d cadastre vellaGeoMedeelel
This document discusses SuperMap's mobile surveying and 3D cadastre solutions. It provides an overview of their mobile surveying app for collecting field data offline and online. It also describes their 3D cadastre system which integrates business and spatial data, digitizes architecture plans, models buildings in 3D, and allows for 3D visualization, querying, and legality checks of cadastral information. The goal is to provide an integrated, efficient, effective and flexible system to support modern 3D cadastre needs.
The document discusses the National Informatics Centre's (NIC) initiatives on visualization through maps and images from 1990 onwards. It provides details on NIC's Multi-Layer GIS Platform called NICMAPS which provides seamless countrywide base maps, satellite images, and hybrid maps aligned to global standards. NICMAPS serves as an essential component of Digital India for electronic delivery of services for planning and governance. It provides maps and layers at different scales along with terrain maps and supports geo-coding of locations. The document outlines NIC's role in developing digital GIS assets and standards-based multi-layer GIS framework involving various stakeholders for use in e-governance applications.
This project involves updating the geographic information system (GIS) database and maps for the existing electricity distribution network in Muzaffarabad, Pakistan. The network was originally developed in 2006 but has not been updated since 2010. The project will update the digital database and maps to reflect current infrastructure by collecting data on transformers, poles, conductors, and consumers. This updated GIS database will help improve planning, implementation, and operation of the electricity network by providing accurate spatial and non-spatial utility data to support decision making. The specific area of focus will be the 11kV City-4 feeder network within the 132kV Muzaffarabad grid.
This document describes how GIS was used to create the Telephone Exchange Information and Planning System (TEIPS) for the Vastrapur telephone exchange in Ahmedabad, India. TEIPS integrated spatial and non-spatial data on the telephone network into a GIS database to help with tasks like cable route planning, fault detection, and monitoring pillar utilization over time. The system allowed technicians to more efficiently plan and maintain the network.
This document discusses the challenges faced by utilities in moving towards a GIS-centric enterprise model. It provides an overview of Capgemini's utilities experience and geospatial capabilities. Regulatory changes in Belgium require utilities to make their network data available in a standardized format. This includes exchanging information through the KLIP and GIPOD portals. Case studies show examples of integrating GIS into asset and project management at a water company, and implementing an enterprise ETL system to consolidate a utility's basemap data.
Vidhya Mohandas is a post-graduate GIS professional with 1 year of experience at Nest IT. She has skills in GIS data maintenance including digitizing maps in ArcGIS 10.1, database design, and business analysis. Her experience includes projects with ADWEA aligning assets to a new land base in Abu Dhabi and updating parcel data for counties in California and Nevada.
The new Esri Utility Network was released into beta earlier this year. SSP has worked with many utility customers to extensively test the new network including data migration, creating circuits & systems, editing data, and utility tracing. Join SSP and Intermountain REA to review how the testing has gone, what works well, and what needs improvement in the new Utility Network. We will also cover key aspects of the new network that will affect your utility so you can be prepared for your move to the Utility Network!
The document discusses the Utah Automated Geographic Reference Center's (AGRC) efforts to reorganize around geospatial web services. It outlines AGRC's mission to facilitate effective geospatial data use in Utah. AGRC manages the State Geographic Information Database (SGID) and provides web and mapping services. It has transitioned from an exploration phase to focus on developing reusable component services and business solutions using its geospatial data and ArcGIS Server.
Leveraging ArcGIS Platform & CityEngine for GIS based Master PlansEsri India
Sustainable, scalable and future ready urban development is one the key priorities in India as well globally. Major government programs i.e. Smart Cities and Atal Mission for Rejuvenation and Urban Transformation (AMRUT) aim to build foundations to achieve this.
For any planned development, master plan is a starting point. A master plan provides a long term blueprint that guides the sustainable planned development of the city. Use of GIS for master planning is not new. GIS-based Master Plans will help in different types of urban planning exercises, e.g. preparation of development plan, zonal plan, utility plan, infrastructure plan, etc. Even Smart City program and AMRUT programs mandate use of GIS for master plan creation.
ArcGIS is a complete platform for end-to-end city planning, design and management. The webinar illustrates how ArcGIS Platform and 3D capabilities of CityEngine provides a complete set of tools for end-to-end GIS based master plan creation and updation.
This document discusses the design of a geographic information system (GIS) software platform integrated with a decision support system (DSS) for use in e-government applications in China. It proposes a new approach that tightly integrates DSS techniques with GIS techniques to provide comprehensive information and decision-making services to governments. The platform uses a uniform database design and data management approach. It is developed using a component-based approach to achieve close integration of GIS and DSS functions. The platform adopts a client-server architecture for applications and a client-server structure for system maintenance.
BDIx (initially introduced in \cite{Ioannou2020}) is a BDI agent that is extended to utilise in Beliefs any other AI/ML techniques (e.g., Fuzzy Logic, Deep Learning Neural Networks, etc.) that gives, among others, to the agent a better understanding of the surrounding environment and the ability to prioritise the order the Desires will be executed. More specifically, as some Desires must conclude before the execution of others (i.e., because the output of one Desire can be an input to another), we allow the Desires to be assigned with priority values, ranging from 0 (lowest) to 100 (highest).
In our DAI framework which utilises BDIx agents, this priority value is estimated by using fuzzy logic (as shown in Figure \ref{fig:flowchart}) considering in its "IF-THEN" rules the current Beliefs, the values measured by the sensors of the D2D Device, any raised events (e.g., see Table \ref{Events}) and cases where the pre-specified threshold values (e.g., Data Rate Drop less than 60\%, Signal Quality Drop less than 30\%) are exceeded. Based on the assigned priority value, Desires become Intentions which are adopted for active pursuit by the agent (referred as a Goal). When the Intention is accomplished, the priority value of the associated Desire is set to zero. In addition, a Desire that will become an Intention can have multiple plans associated with it and the Desire can select an appropriate plan based on a utility function. For simplicity, but without loss of generality, in our DAI Framework we consider each Desire, and indirectly each Intention, to be associated with only one plan. It is also important to highlight here that the Beliefs and the Desires of the BDIx agent comprising the DAI framework have been extracted from the D2D Requirements/Challenges that should be realised in order to implement 5G D2D communication.
Presentation - Update on the Lake Mac Smart City, Smart Council Digital Economy Strategy and illustrative initiatives for the Dantia Citywide LoRaWAN Announcement July 2018.
Satellite image processing is an intricate task that requires vast computation and data processing, which cannot
be handled by a single computer. Furthermore, the processing of the massive amount of data accumulated by
the satellite is a huge challenge for the end user. Hence, grid computing is the essential platform to provide high
computing performance at the user end. This article reviews the grid services used for satellite image processing
and significant data processing.
This document discusses how geographic information systems (GIS) can benefit utilities and water infrastructure domains. GIS can enable centralized data access and collection to learn about infrastructure status. It allows locations to be connected to relevant information and enables collaborative work. Examples of GIS products include ESRI ArcGIS, proprietary and open source options. Case studies demonstrate how GIS has helped with municipal administration, asset management, and operations transparency in India. It has also aided water infrastructure inventory and wastewater management by integrating data systems to facilitate decision making. An example operations dashboard is shown to visualize GIS information.
Design and Development of GIS Based Utility Management System at DOS Housing ...IJERA Editor
The paper presents the conceptual design model of a GIS [Geographic Information system] based Utility Management System for DOS Housing Colony, Vikramnagar, Ahmedabad. The processing capabilities of GIS and the system ability to manipulate geo-referenced data and results in different formats and models make them suitable for planning and operation of all activities of the Construction & Maintenance Group of SAC, Ahmedabad. This is specially designed software for the Civil, Electrical and Horticultural wing of Construction and Maintenance Group, Space Applications Centre (ISRO) in many ways to improve the Planning, Maintenance and Information standards. In this software, all physical information like Vikramnagar area, all buildings, roads, water supply lines, drainage lines, fire fighting lines, pump house, wells, bore points, recharge wells, and STP plant, torrent power substations, DG set rooms, LT panels, LT cables, electrical light poles and solar light poles, nursery area and trees are converting into digital forms using GIS by developing different layers. Thus Digital information will be used for identification of each utility and finally, this software will provide information of the entire Vikramnagar housing colony related to Construction & Maintenance Group by providing instant records availability. The Utility system load flow based on GIS presented in the paper is an ideal tool for performing the analysis and viewing the results on a map superimposed with other geographic layers. It allows power system planners to work on the real system by relating the output to the location of load and feeder. Together with the utilization of water supply lines, fire fighting lines, drainage lines, all buildings, roads, trees and power distribution the System will become an essential tool for utility decision makers and the Occupants of the colony. The data of water supply, fire fighting, drainage and power distribution systems are very complicated to update, and there is a lack of linkage between spatial and non-spatial data.
An accurate, up-to-date model of a utility’s distribution network is the backbone of Smart Grid technologies. But a Schneider Electric survey shows that 74% of utilities are concerned about the readiness of their network model to support Smart Grid applications. This paper presents a quantitative comparison of a Geographic Information System (GIS)–based graphic work design system vs. a CAD-based tool, demonstrating how the GIS-based design approach is better able to keep up with the continuous changes in a dynamic electrical distribution network.
Similar to Web-GIS Based Utility Management System (20)
Accident detection system project report.pdfKamal Acharya
The Rapid growth of technology and infrastructure has made our lives easier. The
advent of technology has also increased the traffic hazards and the road accidents take place
frequently which causes huge loss of life and property because of the poor emergency facilities.
Many lives could have been saved if emergency service could get accident information and
reach in time. Our project will provide an optimum solution to this draw back. A piezo electric
sensor can be used as a crash or rollover detector of the vehicle during and after a crash. With
signals from a piezo electric sensor, a severe accident can be recognized. According to this
project when a vehicle meets with an accident immediately piezo electric sensor will detect the
signal or if a car rolls over. Then with the help of GSM module and GPS module, the location
will be sent to the emergency contact. Then after conforming the location necessary action will
be taken. If the person meets with a small accident or if there is no serious threat to anyone’s
life, then the alert message can be terminated by the driver by a switch provided in order to
avoid wasting the valuable time of the medical rescue team.
Prediction of Electrical Energy Efficiency Using Information on Consumer's Ac...PriyankaKilaniya
Energy efficiency has been important since the latter part of the last century. The main object of this survey is to determine the energy efficiency knowledge among consumers. Two separate districts in Bangladesh are selected to conduct the survey on households and showrooms about the energy and seller also. The survey uses the data to find some regression equations from which it is easy to predict energy efficiency knowledge. The data is analyzed and calculated based on five important criteria. The initial target was to find some factors that help predict a person's energy efficiency knowledge. From the survey, it is found that the energy efficiency awareness among the people of our country is very low. Relationships between household energy use behaviors are estimated using a unique dataset of about 40 households and 20 showrooms in Bangladesh's Chapainawabganj and Bagerhat districts. Knowledge of energy consumption and energy efficiency technology options is found to be associated with household use of energy conservation practices. Household characteristics also influence household energy use behavior. Younger household cohorts are more likely to adopt energy-efficient technologies and energy conservation practices and place primary importance on energy saving for environmental reasons. Education also influences attitudes toward energy conservation in Bangladesh. Low-education households indicate they primarily save electricity for the environment while high-education households indicate they are motivated by environmental concerns.
Build the Next Generation of Apps with the Einstein 1 Platform.
Rejoignez Philippe Ozil pour une session de workshops qui vous guidera à travers les détails de la plateforme Einstein 1, l'importance des données pour la création d'applications d'intelligence artificielle et les différents outils et technologies que Salesforce propose pour vous apporter tous les bénéfices de l'IA.
DEEP LEARNING FOR SMART GRID INTRUSION DETECTION: A HYBRID CNN-LSTM-BASED MODELijaia
As digital technology becomes more deeply embedded in power systems, protecting the communication
networks of Smart Grids (SG) has emerged as a critical concern. Distributed Network Protocol 3 (DNP3)
represents a multi-tiered application layer protocol extensively utilized in Supervisory Control and Data
Acquisition (SCADA)-based smart grids to facilitate real-time data gathering and control functionalities.
Robust Intrusion Detection Systems (IDS) are necessary for early threat detection and mitigation because
of the interconnection of these networks, which makes them vulnerable to a variety of cyberattacks. To
solve this issue, this paper develops a hybrid Deep Learning (DL) model specifically designed for intrusion
detection in smart grids. The proposed approach is a combination of the Convolutional Neural Network
(CNN) and the Long-Short-Term Memory algorithms (LSTM). We employed a recent intrusion detection
dataset (DNP3), which focuses on unauthorized commands and Denial of Service (DoS) cyberattacks, to
train and test our model. The results of our experiments show that our CNN-LSTM method is much better
at finding smart grid intrusions than other deep learning algorithms used for classification. In addition,
our proposed approach improves accuracy, precision, recall, and F1 score, achieving a high detection
accuracy rate of 99.50%.
Software Engineering and Project Management - Software Testing + Agile Method...Prakhyath Rai
Software Testing: A Strategic Approach to Software Testing, Strategic Issues, Test Strategies for Conventional Software, Test Strategies for Object -Oriented Software, Validation Testing, System Testing, The Art of Debugging.
Agile Methodology: Before Agile – Waterfall, Agile Development.
Use PyCharm for remote debugging of WSL on a Windo cf5c162d672e4e58b4dde5d797...shadow0702a
This document serves as a comprehensive step-by-step guide on how to effectively use PyCharm for remote debugging of the Windows Subsystem for Linux (WSL) on a local Windows machine. It meticulously outlines several critical steps in the process, starting with the crucial task of enabling permissions, followed by the installation and configuration of WSL.
The guide then proceeds to explain how to set up the SSH service within the WSL environment, an integral part of the process. Alongside this, it also provides detailed instructions on how to modify the inbound rules of the Windows firewall to facilitate the process, ensuring that there are no connectivity issues that could potentially hinder the debugging process.
The document further emphasizes on the importance of checking the connection between the Windows and WSL environments, providing instructions on how to ensure that the connection is optimal and ready for remote debugging.
It also offers an in-depth guide on how to configure the WSL interpreter and files within the PyCharm environment. This is essential for ensuring that the debugging process is set up correctly and that the program can be run effectively within the WSL terminal.
Additionally, the document provides guidance on how to set up breakpoints for debugging, a fundamental aspect of the debugging process which allows the developer to stop the execution of their code at certain points and inspect their program at those stages.
Finally, the document concludes by providing a link to a reference blog. This blog offers additional information and guidance on configuring the remote Python interpreter in PyCharm, providing the reader with a well-rounded understanding of the process.
Generative AI Use cases applications solutions and implementation.pdfmahaffeycheryld
Generative AI solutions encompass a range of capabilities from content creation to complex problem-solving across industries. Implementing generative AI involves identifying specific business needs, developing tailored AI models using techniques like GANs and VAEs, and integrating these models into existing workflows. Data quality and continuous model refinement are crucial for effective implementation. Businesses must also consider ethical implications and ensure transparency in AI decision-making. Generative AI's implementation aims to enhance efficiency, creativity, and innovation by leveraging autonomous generation and sophisticated learning algorithms to meet diverse business challenges.
https://www.leewayhertz.com/generative-ai-use-cases-and-applications/
Blood finder application project report (1).pdfKamal Acharya
Blood Finder is an emergency time app where a user can search for the blood banks as
well as the registered blood donors around Mumbai. This application also provide an
opportunity for the user of this application to become a registered donor for this user have
to enroll for the donor request from the application itself. If the admin wish to make user
a registered donor, with some of the formalities with the organization it can be done.
Specialization of this application is that the user will not have to register on sign-in for
searching the blood banks and blood donors it can be just done by installing the
application to the mobile.
The purpose of making this application is to save the user’s time for searching blood of
needed blood group during the time of the emergency.
This is an android application developed in Java and XML with the connectivity of
SQLite database. This application will provide most of basic functionality required for an
emergency time application. All the details of Blood banks and Blood donors are stored
in the database i.e. SQLite.
This application allowed the user to get all the information regarding blood banks and
blood donors such as Name, Number, Address, Blood Group, rather than searching it on
the different websites and wasting the precious time. This application is effective and
user friendly.
Applications of artificial Intelligence in Mechanical Engineering.pdfAtif Razi
Historically, mechanical engineering has relied heavily on human expertise and empirical methods to solve complex problems. With the introduction of computer-aided design (CAD) and finite element analysis (FEA), the field took its first steps towards digitization. These tools allowed engineers to simulate and analyze mechanical systems with greater accuracy and efficiency. However, the sheer volume of data generated by modern engineering systems and the increasing complexity of these systems have necessitated more advanced analytical tools, paving the way for AI.
AI offers the capability to process vast amounts of data, identify patterns, and make predictions with a level of speed and accuracy unattainable by traditional methods. This has profound implications for mechanical engineering, enabling more efficient design processes, predictive maintenance strategies, and optimized manufacturing operations. AI-driven tools can learn from historical data, adapt to new information, and continuously improve their performance, making them invaluable in tackling the multifaceted challenges of modern mechanical engineering.
Open Channel Flow: fluid flow with a free surfaceIndrajeet sahu
Open Channel Flow: This topic focuses on fluid flow with a free surface, such as in rivers, canals, and drainage ditches. Key concepts include the classification of flow types (steady vs. unsteady, uniform vs. non-uniform), hydraulic radius, flow resistance, Manning's equation, critical flow conditions, and energy and momentum principles. It also covers flow measurement techniques, gradually varied flow analysis, and the design of open channels. Understanding these principles is vital for effective water resource management and engineering applications.
Optimizing Gradle Builds - Gradle DPE Tour Berlin 2024Sinan KOZAK
Sinan from the Delivery Hero mobile infrastructure engineering team shares a deep dive into performance acceleration with Gradle build cache optimizations. Sinan shares their journey into solving complex build-cache problems that affect Gradle builds. By understanding the challenges and solutions found in our journey, we aim to demonstrate the possibilities for faster builds. The case study reveals how overlapping outputs and cache misconfigurations led to significant increases in build times, especially as the project scaled up with numerous modules using Paparazzi tests. The journey from diagnosing to defeating cache issues offers invaluable lessons on maintaining cache integrity without sacrificing functionality.
Software Engineering and Project Management - Introduction, Modeling Concepts...Prakhyath Rai
Introduction, Modeling Concepts and Class Modeling: What is Object orientation? What is OO development? OO Themes; Evidence for usefulness of OO development; OO modeling history. Modeling
as Design technique: Modeling, abstraction, The Three models. Class Modeling: Object and Class Concept, Link and associations concepts, Generalization and Inheritance, A sample class model, Navigation of class models, and UML diagrams
Building the Analysis Models: Requirement Analysis, Analysis Model Approaches, Data modeling Concepts, Object Oriented Analysis, Scenario-Based Modeling, Flow-Oriented Modeling, class Based Modeling, Creating a Behavioral Model.
Software Engineering and Project Management - Introduction, Modeling Concepts...
Web-GIS Based Utility Management System
1. Web-GIS Based Utility
Management System
“Smartness comes with proper management of utility.”
rabenojha@gmail.com
iamtekson@gmail.com
kapilgyawali2055@gmail.com
bibekchand457@gmail.com
bishalghimire9766@gmail.com
neupanesantosh73@gmail.com
2. Introduction
GIS- System designed to capture,
manipulate, analyze, manage and present all
types of geographical data
Tools for problem solving and decision
making as well as visualization of data
Important role for preparation of utility map
and its use in real field
3. Introduction
Utilities- Services that are useful, profitable
or beneficial to community
Utility component spreads all over a certain
place forming utility network
Very complex networks
Includes road network, drainage network,
electrical network, telephone and television
network, sewer network, gas line, water
mains, fire fighting network
Proper management required for excellent
service delivery
4. Objective
Primary objective
Prepare Web-GIS based utility management
system
Secondary objective
Study existing utility network
Prepare spatially linked digital database of utility
networks
6. Study Area
Located at Pokhara, Kaski
Latitude: 28015’8.55” Longitude: 83058’38.32”
Managed by Roadshow Real Estate Private
Limited
100 bungalows and 1 apartment
Total area: 31502.5 sq.m (61-14-3-0.28)
13. Data Collection
Primary data:
Data collected in field
GPS data and Drone survey
Secondary data:
Existing CAD data
Paper maps
Querying with individuals
14. …….Shapefile Preparation
Using ArcMap
Shapefile of all utility networks and base
layers
Using GPS survey
Road network
Drainage network
Street Light
15. …….Shapefile Preparation
Using existing CAD data and orthophoto
digitization
Electrical network
Telephone/Television network
Sanitary network
Water network
16. ……..Shapefile Preparation
Other base layer using orthophoto
digitization
Building
Parks
Temple
Swimming Pool
Housing Boundary
17. Database Preparation
Filling attribute data and spatial data into
spatial database
Using Postgresql with PostGIS Extension
17 spatially linked table and 1 non-spatial
table inside database
25. Lack of technological device
Lack of advanced drone, battery problem
GPS inaccuracy
Lack of advanced technology
Difficulty in obtaining accurate underground
data
Unavailability Ground penetrating radar or
Electromagnetic locator
26. Lack of data
No maintained database of utility network
Limited CAD data
Lack of attribute information
28. Conclusion
Urbanization as a global problem.
Web-GIS system for utility management
Layer based utility network information
Effective for planning, maintaining and
updating the utility features
Digital database preparation and operating
spatial function
29. I am the only one
who knows about all
the Utilities…
31. Recommendation
Municipalities and local governmental
bodies
Establishment of central database system
All the utility service provider
Real estate companies
Time for change