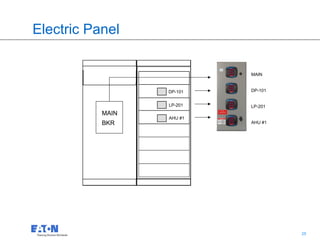
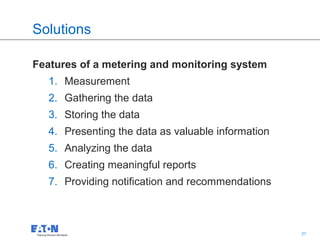
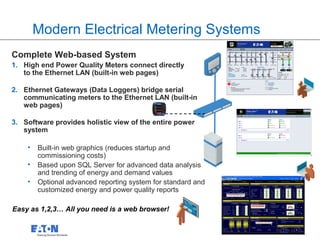
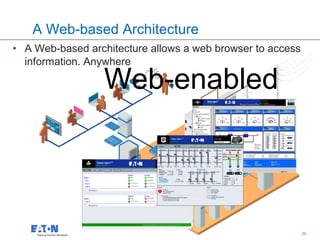
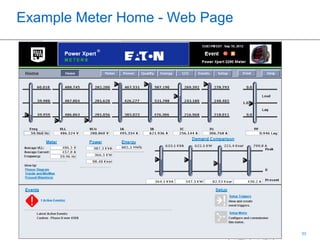
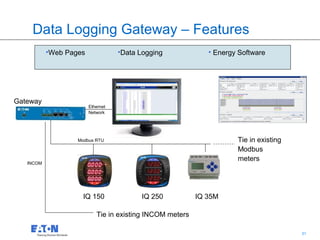
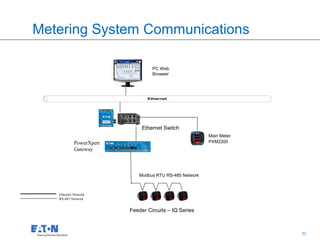
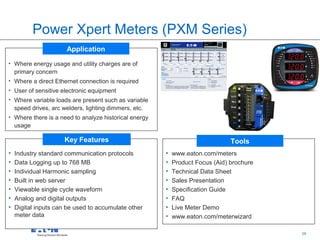
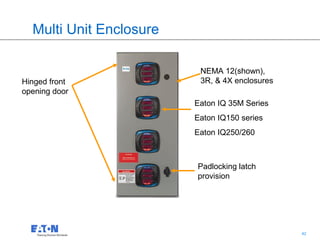
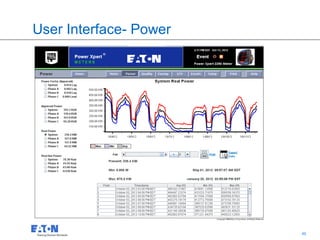
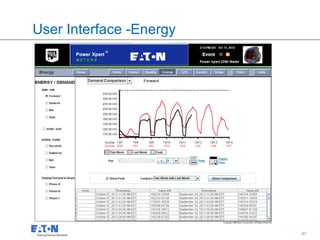
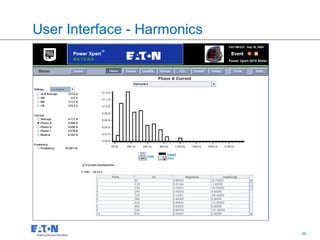
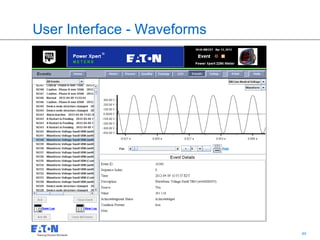
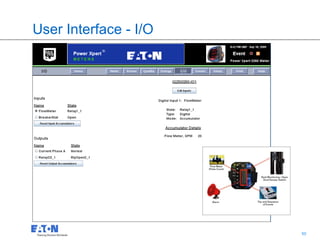
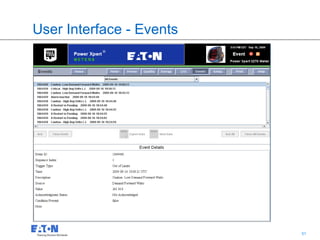
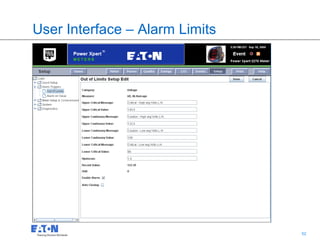
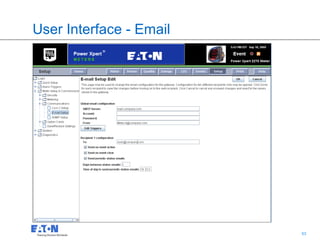
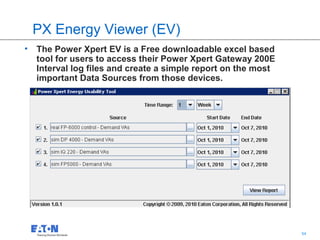
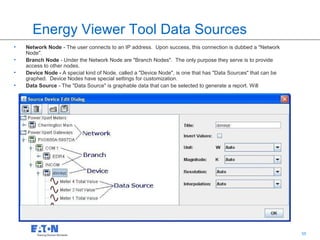
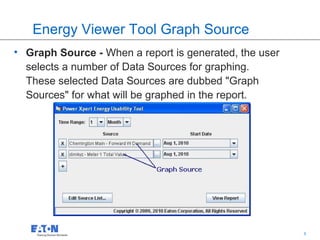
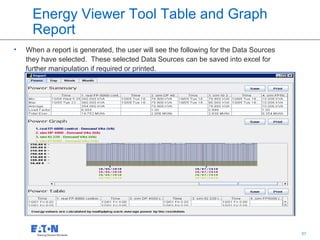
SlideShare a Scribd company logo
1 of 61
This is a photographic template – your
              photograph should fit precisely within this rectangle.


         Metering & Monitoring Systems

Steve Van Duser
Meters & Relays
Application Engineer


                             © 2008 Eaton Corporation. All rights reserved.
Agenda

• Introduction
  • Why is electrical metering important?
  • What does a meter do?
  • Where to apply meters?
• Solutions
  • Designing a metering & monitoring system.
  • Choosing the right meter.
  • Understanding the information.
• Questions
                                            2   2
Introduction


               3   3
Why Measure?

               “If you can’t measure
                  it, you can’t
                  manage it!”


                         4             4
Why Electrical Power Metering?


                             Ene
             y
         alit


                                 rgy
      Qu


                                 Con
        r
     we


                                     s
  Po


                                       erv
                                        atio
                                         n
            Alternative Energy
                                             5   5
7 Reasons for installing meters

1 - Verification of the utility suppliers
   accuracy and integrity
   • Applying a revenue class meter at
     the incoming line allows the user to
     confirm the accuracy of the utility
     meter and bill.
   • Customers will have access to their
     true energy consumption as well as
     their power demand. In some cases,
     peak demand rates are nearly ½ of
     the total electric bill.
                                            6   6
7 Reasons for installing meters

2 - Identification of energy-consuming
  loads
   • The next step in any successful energy
      management program is the identification
      of the loads within a facility that consume
      the most energy.
   • Prioritizing energy reduction efforts
      including shedding non-critical loads,
      shifting loads to an off-peak rate period,
      and targeting inefficient operations for
      further action.

                                                    7   7
7 Reasons for installing meters

3 - Establishment of a facility’s historical
   baseline
   • Documenting historical baselines
     provides users with the added ability
     to gain a deeper understanding of
     where their power is going today!
   • Consumers are able to analyze the
     data to make better decisions for
     reduce energy tomorrow!


                                               8   8
7 Reasons for installing meters

4 - Documentation of energy reduction
  efforts
  • Users will be able to benchmark the
    effectiveness of energy reduction efforts of
    a load management program or the
    purchase and installation of high efficiency
    products (lighting, motors, and drives).
  • Verification of the implemented programs
    provides confirmation on success of each
    effort taken to reduce energy consumption.


                                              9    9
7 Reasons for installing meters

5 - Activity-based costing to
  departments, processes, and
  products
   • Accurately allocating energy costs to
     departments creates accountability
     and the incentive to take ownership of
     energy management efforts.
   • Additionally, understanding energy
     costs as they relate to specific
     processes of products provides
     management with an additional tool to
     use in making production decisions.
                                              10   10
7 Reasons for installing meters

6 - Contribute to LEED certification
   • The LEED Green Building Rating
     System™ is the nationally accepted
     benchmark for the design, construction,
     and operation of high performance green
     buildings.
   • Your facility can earn up to 5 points
     towards LEED certification under Energy
     and Atmosphere Credit 2, On-Site
     Renewable Energy; Credit 3, Enhanced
     Commissioning; Credit 5, Measurement
     & Verification.
                                               11   11
7 Reasons for installing meters

7 - Development of utility rate
 comparison procedure
  • Metering and documentation
    provides additional tools to use in
    selecting the ideal utility rate
    structure.
  • Consumers are able to measure the
    output of their on-site alternative
    energy production to qualify for
    energy rebates and credits.

                                          12   12
What do meters do?


                     13   13
2 Categories of Measurement
Energy and Power
  •   Energy Usage (kWh)
  •   Power Demand (KW)
  •   Volts & Amps
  •   KVAR & KVA

Power Quality
  •   Power Factor
  •   Total Harmonic Distortion
  •   Transients
  •   Surges
  •   Sags
  •   Swells
  •   Frequency variations

                                  14   14
Energy Usage - Simplified

kWh
• Energy usage expressed in units of
  kilowatt-hours.
• Defined as the rate of consumption in
  kilowatts per hour.


10 electric light bulbs rated at 100W would use
1KWh if left burning for an hour.


                                            15    15
Energy Usage - Time of Use

Time Of Use
  • Based upon availability of
    capacity.
  • On/Off Peak
     • Hours within a day
     • Certain months of the year


                                    16   16
Power Demand
KW
  • Measured in Kilowatts.
  • The amount of power being
    demanded by a customer at a
    certain moment in time.
  • The utility measures time in a
    Demand Window.
  • Windows of time, typically (5min,
    15min, 30 min or 60min) are being   Utilities can’t store
    recorded.                           their power, it’s got to
                                        go somewhere!
  • The average reading of the window
    is typically used for billing.
                                         17                        17
Power – How is it calculated
Power Units
  • Volts X Amps = VoltAmps (VA).              Resistive

  • Watts = VA, if the load is 100%            Load

    resistive.
  • Both inductive and capacitive loads        Inductive

    create losses measured in VARs.            Load


  • Utilities have to provide VA to
    supply enough power to cover the           Capacitive

    real power and the losses.                 Load


  • Real work performed is Watts.


                                          18          18
Power – Power Factor

                         Mug Capacity = Apparent Power (KVA)
        (kVAR)           Foam = Reactive Power (KVAR)
                         Beer = Real Power (kW)

                 (kVA)                     Beer (kW)
                         Power Factor =
        (kW)                              Mug Capacity (KVA)


                         Utilities have to generate kVA, but
                         consumers can only use kW!


kVAR penalties are enforced by the utility!

                                                  19           19
Power Quality - Issues


                        Frequency
                        variations    Interruption
                                                        2002 EPRI study
      Line Noise                                        of 985 customers
                                                            in the US
                                     5%
                         5% 5%
                    5%                                   46% Sags
 Harmonics         7%

                   7%
                          10%
 Over voltage                        10%
                                                     Swells
  Under voltage
                Spikes, switching
                    transients


                                                                  20       20
Where do I use meters?


                         21   21
Where to install meters?

• Incoming Utility Service
• Alternative Energy Sources
• Load Equipment
  • HVAC units
  • Chillers
  • Air Compressors
  • Motors
  • Lighting Panels
  • Computers

                               22   22
Incoming Utility and Alternate Energy

                                   Feed-in Tariff Application
                                   1.       Standard Meter – Utility owned
                                            (Bi-Directional)
                                   2.       FiT Meter – Customer owned


                                       Net Metering Application
                                       1.    Standard Meter – Utility owned
                                             (Bi-Directional)
                                       2.    Customer owned meter - Optional


                                  Power Purchase Agreement
                                  1.    Standard Meter – Utility owned
                                        (Bi-Directional)
                                  2.    PPA Meter – Customer owned
                 Standard meter


                                                23                       23
Electrical One-Line
                          13,800V


                                    Utility Pole XFMR
                              480V
              Utility
              Meter                                     Electrical Switchboard


                                    MAIN Breaker
                                    2000A


                  1200A                          800A                 600A


        Chiller                        Compressor             Lighting Panel


                              Load Equipment

                                                              24                 24
Electric Panel

                                MAIN


                  DP-101        DP-101


                  LP-201        LP-201
           MAIN
                  AHU #1
           BKR                  AHU #1


                           25            25
Metering & Monitoring Systems


                                26   26
Solutions

Features of a metering and monitoring system
   1. Measurement
   2. Gathering the data
   3. Storing the data
   4. Presenting the data as valuable information
   5. Analyzing the data
   6. Creating meaningful reports
   7. Providing notification and recommendations


                                          27        27
Modern Electrical Metering Systems
Complete Web-based System
1. High end Power Quality Meters connect directly
   to the Ethernet LAN (built-in web pages)

2. Ethernet Gateways (Data Loggers) bridge serial
   communicating meters to the Ethernet LAN (built-in
   web pages)

3. Software provides holistic view of the entire power
   system

    •   Built-in web graphics (reduces startup and
        commissioning costs)
    •   Based upon SQL Server for advanced data analysis
        and trending of energy and demand values
    •   Optional advanced reporting system for standard and
        customized energy and power quality reports

Easy as 1,2,3… All you need is a web browser!


                                                              28   28
A Web-based Architecture
• A Web-based architecture allows a web browser to access
  information. Anywhere

                  Web-enabled


                                             29             29
Example Meter Home - Web Page


                                30   30
Data Logging Gateway – Features
           •Web Pages              •Data Logging             • Energy Software


Gateway
                        Ethernet
                        Network


                   Modbus RTU                                        Tie in existing
                                                                     Modbus
                                                                     meters
   INCOM


                     IQ 150              IQ 250           IQ 35M

                           Tie in existing INCOM meters

                                                                      31               31
Metering System Communications

                                  PC Web
                                  Browser


                                Ethernet


                              Ethernet Switch
                                                        Main Meter
            PowerXpert                                  PXM2200
            Gateway


                            Modbus RTU RS-485 Network


   Ethernet Network
   RS-485 Network


                         Feeder Circuits – IQ Series


                                                                     32   32
Metering & Monitoring Systems


                                33   33
Metering and
Monitoring Products


                      34   34
Eaton Meters Line Overview
     Special Use Meters             Switchgear/Switchboard         Panelboard/Switchboard

                 PX Meter                              PXM 2000              IQ Energy/Power
                                                                             Sentinel
                 Revenue                               Ethernet/
                 Class Full                            Data                   Monitors Power
                 featured PQ                           Logging                and Energy for
                 Meter                                                        Series C
                                             IQ 250/260                       Breakers
                                                                              Universal Int/Ext
                                             Revenue Class                   IQ Universal
Enclosed                                     Panel Meter, I/O                Power Sentinel
                                             Opt
                                                                             Internal CTs
                                          IQ 130/140/150
                                          Basic metering                    IQ 35M
                                          Communication Opt                 Low Profile Energy
                                                                            Meter
                               Wireless

                                          IQ150S/250S                          Multipoint
                                          Basic/Revenue Metering               Metering
                                          Integrated Wireless                  Flexible
                                                                               Submetering
                                                                      35
                                                                               for Energy
                                                                                         35
                                                                               Use
IQ130/140/150
                      Application
• Where energy usage and utility charges are of
  primary concern
• Replacing analog meters
• Submetering individual loads
• Cost effective measurement of current and voltage is
  needed
• Interest in measurement of only power
• Energy feed into 3rd party systems

                     Key Features                                              Tools
• Industry standard communication                        •   www.eaton.com/meters
• Percentage load indication on face of meter            •   Product Focus
• Configurable wiring systems                            •   Technical Data Sheet
                                                         •   Sales Presentation
• Password protect energy and demand resets
                                                         •   Specification guide
• Selectable meter variables on display
                                                         •   FAQ
• Autoscroll or fixed display
                                                         •   www.eaton.com/meterwizard
• Transducer only versions

                                                                                  36     36
IQ250/260
                     Application

• Where energy usage and utility charges are of
  primary concern
• Where there is a need to output meter variables
  through 4-20 ma signal
• Where there is a need to capture other meter
  inputs such as WAGES
• Where variable loads are present such as variable
  speed drives, arc welders, lighting dimmers, etc.

                    Key Features                                            Tools
• Industry standard communication protocols           •   www.eaton.com/meters
• Total harmonic distortion measurement               •   Product Focus
• Visual indication of limits exceeded on face of     •   Technical Data Sheet
  meter                                               •   Sales Presentation
• Analog and digital outputs                          •   Specification guide
• Digital inputs can be used to accumulate other      •   FAQ
  meter data                                          •   www.eaton.com/meterwizard
• Upgradeable to a PXM2000

                                                                               37     37
Power Xpert Meters (PXM Series)
                      Application
• Where energy usage and utility charges are of
  primary concern
• Where a direct Ethernet connection is required
• User of sensitive electronic equipment
• Where variable loads are present such as variable
  speed drives, arc welders, lighting dimmers, etc.
• Where there is a need to analyze historical energy
  usage

                     Key Features                                              Tools
•   Industry standard communication protocols          •   www.eaton.com/meters
•   Data Logging up to 768 MB                          •   Product Focus (Aid) brochure
•   Individual Harmonic sampling                       •   Technical Data Sheet
•   Built in web server                                •   Sales Presentation
•   Viewable single cycle waveform                     •   Specification Guide
•   Analog and digital outputs                         •   FAQ
•   Digital inputs can be used to accumulate other     •   Live Meter Demo
    meter data                                         •   www.eaton.com/meterwizard

                                                                                  38      38
Enclosed Meters


                  39   39
Single Unit Enclosure

                          NEMA 12(shown),
Hinged front              3R, & 4X enclosures
opening door

                          Eaton PXM2000 Series
                          Eaton IQ150 series
                          Eaton IQ250/260

                          Padlocking latch
                          provision


                                     40          40
Single Unit Enclosed Meter Inside View


                               41        41
Multi Unit Enclosure

                          NEMA 12(shown),
Hinged front              3R, & 4X enclosures
opening door
                         Eaton IQ 35M Series
                         Eaton IQ150 series
                         Eaton IQ250/260


                         Padlocking latch
                         provision


                                     42         42
Understanding the meter data


                               43   43
Data Communications Port


                                 Ethernet Port
 Power Supply
 Inputs
                                         RS485


System Voltage                           KYZ Out
Inputs


                              I/O Slot

                                 44                44
User Interface- Voltage


                          45   45
User Interface- Power


                        46   46
User Interface -Energy


                         47   47
User Interface - Harmonics


                             48   48
User Interface - Waveforms


                             49   49
User Interface - I/O


                       50   50
User Interface - Events


                          51   51
User Interface – Alarm Limits


                                52   52
User Interface - Email


                         53   53
PX Energy Viewer (EV)
• The Power Xpert EV is a Free downloadable excel based
  tool for users to access their Power Xpert Gateway 200E
  Interval log files and create a simple report on the most
  important Data Sources from those devices.


                                                  54          54
Energy Viewer Tool Data Sources
•   Network Node - The user connects to an IP address. Upon success, this connection is dubbed a "Network
    Node".
•   Branch Node - Under the Network Node are "Branch Nodes". The only purpose they serve is to provide
    access to other nodes.
•   Device Node - A special kind of Node, called a "Device Node", is one that has "Data Sources" that can be
    graphed. Device Nodes have special settings for customization.
•   Data Source - The "Data Source" is graphable data that can be selected to generate a report. Will


                                                                                           55                  55
Energy Viewer Tool Graph Source
• Graph Source - When a report is generated, the user
  selects a number of Data Sources for graphing.
  These selected Data Sources are dubbed "Graph
  Sources" for what will be graphed in the report.


                                             56         56
Energy Viewer Tool Table and Graph
      Report
•   When a report is generated, the user will see the following for the Data Sources
    they have selected. These selected Data Sources can be saved into excel for
    further manipulation if required or printed.


                                                                        57             57
Demo Sites

• PXG 800E - http://192.104.67.189
  login name: user
  password: user


• PXM 2290 - http://192.104.67.189
• PXM 8000 - http://192.104.67.190


                                     58   58
Q&A


      59   59
Contact Info


                            Steve Van Duser
                            Application Engineer
                            Southeast Region
                            Eaton Corporation
                            8380 Capital Blvd
                            Raleigh, NC 27616
Technical Support:          Email:StevenJVanDuser@Eaton.com
1-800-809-2772              Phone: (919) 431-6211
Option #4, then Option #1   Cell: (919) 272-7143
                            www.eaton.com/meters


                                               60         60
61   61

More Related Content

What's hot

Performance analysis of mono crystalline silicon technology with different or...
Performance analysis of mono crystalline silicon technology with different or...Performance analysis of mono crystalline silicon technology with different or...
Performance analysis of mono crystalline silicon technology with different or...Gaurav Kumar Sharma
 
Mini grid design manual
Mini grid design manualMini grid design manual
Mini grid design manualSolarReference
 
SOLAR DESIGN -PREMKUMAR-1
SOLAR DESIGN -PREMKUMAR-1SOLAR DESIGN -PREMKUMAR-1
SOLAR DESIGN -PREMKUMAR-1Murugappa Group
 
Standalone Solar PV system design Example
Standalone Solar PV system design ExampleStandalone Solar PV system design Example
Standalone Solar PV system design ExampleDr Naim R Kidwai
 
Solar PV Systems (Engineering, wiring & grid connection) - Martin Cotterell (...
Solar PV Systems (Engineering, wiring & grid connection) - Martin Cotterell (...Solar PV Systems (Engineering, wiring & grid connection) - Martin Cotterell (...
Solar PV Systems (Engineering, wiring & grid connection) - Martin Cotterell (...Farming Futures
 
PPT OF SOLAR NAVEEN' `11
PPT OF SOLAR NAVEEN' `11PPT OF SOLAR NAVEEN' `11
PPT OF SOLAR NAVEEN' `11naveen bhati
 
ABB Training Colombia Inverters - Focus on residential and commercial solutio...
ABB Training Colombia Inverters - Focus on residential and commercial solutio...ABB Training Colombia Inverters - Focus on residential and commercial solutio...
ABB Training Colombia Inverters - Focus on residential and commercial solutio...Jesús Leyton P
 
RES & EC Unit 3 PPT - Solar Photovoltaic System and Design & Ocean Energy, Ti...
RES & EC Unit 3 PPT - Solar Photovoltaic System and Design & Ocean Energy, Ti...RES & EC Unit 3 PPT - Solar Photovoltaic System and Design & Ocean Energy, Ti...
RES & EC Unit 3 PPT - Solar Photovoltaic System and Design & Ocean Energy, Ti...ARAVIND U
 
Designing Energy Harvesting Solar Powered Sensors
Designing Energy Harvesting Solar Powered SensorsDesigning Energy Harvesting Solar Powered Sensors
Designing Energy Harvesting Solar Powered SensorsDan Wright, MBA
 
A report on Solar Load Calculation
A report on Solar Load CalculationA report on Solar Load Calculation
A report on Solar Load CalculationMilan Ghimire
 
Study of Large Scale Grid interactive Solar PV power plant
Study of Large Scale Grid interactive Solar PV power plantStudy of Large Scale Grid interactive Solar PV power plant
Study of Large Scale Grid interactive Solar PV power plantShahbaz Makandar A.
 
Development of a wireless sensor network powered by energy harvesting techniques
Development of a wireless sensor network powered by energy harvesting techniquesDevelopment of a wireless sensor network powered by energy harvesting techniques
Development of a wireless sensor network powered by energy harvesting techniquesDaniele Costarella
 
MPPT Based Optimal Charge Controller in PV system
MPPT Based Optimal Charge Controller in PV systemMPPT Based Optimal Charge Controller in PV system
MPPT Based Optimal Charge Controller in PV systemMalik Sameeullah
 
Hybrid Controller | Design 150KW PV with DG1:700KW
Hybrid  Controller | Design 150KW PV with DG1:700KWHybrid  Controller | Design 150KW PV with DG1:700KW
Hybrid Controller | Design 150KW PV with DG1:700KWEyad Adnan
 
Solar photovoltaic systems
Solar photovoltaic systemsSolar photovoltaic systems
Solar photovoltaic systemsanish_hercules
 
Small residential stand alone roof top solar pv
Small residential stand alone roof top solar pvSmall residential stand alone roof top solar pv
Small residential stand alone roof top solar pvencon2014
 

What's hot (20)

mohan.final
mohan.finalmohan.final
mohan.final
 
Performance analysis of mono crystalline silicon technology with different or...
Performance analysis of mono crystalline silicon technology with different or...Performance analysis of mono crystalline silicon technology with different or...
Performance analysis of mono crystalline silicon technology with different or...
 
Mini grid design manual
Mini grid design manualMini grid design manual
Mini grid design manual
 
SOLAR DESIGN -PREMKUMAR-1
SOLAR DESIGN -PREMKUMAR-1SOLAR DESIGN -PREMKUMAR-1
SOLAR DESIGN -PREMKUMAR-1
 
Standalone Solar PV system design Example
Standalone Solar PV system design ExampleStandalone Solar PV system design Example
Standalone Solar PV system design Example
 
Solar PV Systems (Engineering, wiring & grid connection) - Martin Cotterell (...
Solar PV Systems (Engineering, wiring & grid connection) - Martin Cotterell (...Solar PV Systems (Engineering, wiring & grid connection) - Martin Cotterell (...
Solar PV Systems (Engineering, wiring & grid connection) - Martin Cotterell (...
 
Jakson_report_Final
Jakson_report_FinalJakson_report_Final
Jakson_report_Final
 
PPT OF SOLAR NAVEEN' `11
PPT OF SOLAR NAVEEN' `11PPT OF SOLAR NAVEEN' `11
PPT OF SOLAR NAVEEN' `11
 
Solar inverter
Solar inverter Solar inverter
Solar inverter
 
ABB Training Colombia Inverters - Focus on residential and commercial solutio...
ABB Training Colombia Inverters - Focus on residential and commercial solutio...ABB Training Colombia Inverters - Focus on residential and commercial solutio...
ABB Training Colombia Inverters - Focus on residential and commercial solutio...
 
RES & EC Unit 3 PPT - Solar Photovoltaic System and Design & Ocean Energy, Ti...
RES & EC Unit 3 PPT - Solar Photovoltaic System and Design & Ocean Energy, Ti...RES & EC Unit 3 PPT - Solar Photovoltaic System and Design & Ocean Energy, Ti...
RES & EC Unit 3 PPT - Solar Photovoltaic System and Design & Ocean Energy, Ti...
 
Designing Energy Harvesting Solar Powered Sensors
Designing Energy Harvesting Solar Powered SensorsDesigning Energy Harvesting Solar Powered Sensors
Designing Energy Harvesting Solar Powered Sensors
 
A report on Solar Load Calculation
A report on Solar Load CalculationA report on Solar Load Calculation
A report on Solar Load Calculation
 
Study of Large Scale Grid interactive Solar PV power plant
Study of Large Scale Grid interactive Solar PV power plantStudy of Large Scale Grid interactive Solar PV power plant
Study of Large Scale Grid interactive Solar PV power plant
 
Development of a wireless sensor network powered by energy harvesting techniques
Development of a wireless sensor network powered by energy harvesting techniquesDevelopment of a wireless sensor network powered by energy harvesting techniques
Development of a wireless sensor network powered by energy harvesting techniques
 
MPPT Based Optimal Charge Controller in PV system
MPPT Based Optimal Charge Controller in PV systemMPPT Based Optimal Charge Controller in PV system
MPPT Based Optimal Charge Controller in PV system
 
Hybrid Controller | Design 150KW PV with DG1:700KW
Hybrid  Controller | Design 150KW PV with DG1:700KWHybrid  Controller | Design 150KW PV with DG1:700KW
Hybrid Controller | Design 150KW PV with DG1:700KW
 
Solar photovoltaic systems
Solar photovoltaic systemsSolar photovoltaic systems
Solar photovoltaic systems
 
Small residential stand alone roof top solar pv
Small residential stand alone roof top solar pvSmall residential stand alone roof top solar pv
Small residential stand alone roof top solar pv
 
Solar Inverters
 Solar Inverters Solar Inverters
Solar Inverters
 

Viewers also liked

Technical Paper Presentation- ERC Forum
Technical Paper Presentation- ERC ForumTechnical Paper Presentation- ERC Forum
Technical Paper Presentation- ERC ForumRazmi Marzook
 
Franklin structures certified plant Energy Star Certificate
Franklin structures certified plant Energy Star CertificateFranklin structures certified plant Energy Star Certificate
Franklin structures certified plant Energy Star CertificateSteve Tidwell
 
Report_EBACProject_BBP
Report_EBACProject_BBPReport_EBACProject_BBP
Report_EBACProject_BBPArun Sankar
 
ELECTRICAL SCHMATICS AT NCP_FINAL
ELECTRICAL SCHMATICS AT NCP_FINALELECTRICAL SCHMATICS AT NCP_FINAL
ELECTRICAL SCHMATICS AT NCP_FINALFAIZ AHMAD
 
Married indies: How to ship a successful game without killing your spouse
Married indies: How to ship a successful game without killing your spouseMarried indies: How to ship a successful game without killing your spouse
Married indies: How to ship a successful game without killing your spouseHelen Carmichael
 
Making the Most from Metering
Making the Most from MeteringMaking the Most from Metering
Making the Most from MeteringEMEX
 
Introduction to Fiscal Metering (Custody Transfer)
Introduction to Fiscal Metering (Custody Transfer) Introduction to Fiscal Metering (Custody Transfer)
Introduction to Fiscal Metering (Custody Transfer) Mozaffar Etezadi Far
 
Hvac controls operation and maintenance 3rd edition g. w. gupton
Hvac controls operation and maintenance   3rd edition g. w. guptonHvac controls operation and maintenance   3rd edition g. w. gupton
Hvac controls operation and maintenance 3rd edition g. w. guptonronald59
 
Chilled Water Plant Optimization
Chilled Water Plant OptimizationChilled Water Plant Optimization
Chilled Water Plant OptimizationJoePessa
 
Trg trc017-en hvac system control
Trg trc017-en hvac system controlTrg trc017-en hvac system control
Trg trc017-en hvac system controlVoVi Phap Danh
 
EMA Energy Management Training for Organisations and Individuals
EMA Energy Management Training for Organisations and IndividualsEMA Energy Management Training for Organisations and Individuals
EMA Energy Management Training for Organisations and IndividualsEMEX
 
NFC Australia: A snapshot
NFC Australia: A snapshotNFC Australia: A snapshot
NFC Australia: A snapshotJohn Price
 
Chilled water plants
Chilled water plantsChilled water plants
Chilled water plantsAwais Jalali
 
A talk on Stage Photography: Basics
A talk on Stage Photography: BasicsA talk on Stage Photography: Basics
A talk on Stage Photography: BasicsAditya Rao
 
Automation- Metering, Sub Station & Industrial Automation
Automation- Metering, Sub Station & Industrial AutomationAutomation- Metering, Sub Station & Industrial Automation
Automation- Metering, Sub Station & Industrial AutomationEPC Solutions LLP
 
Leed v4-view-from-mep-seats-140429
Leed v4-view-from-mep-seats-140429Leed v4-view-from-mep-seats-140429
Leed v4-view-from-mep-seats-140429Scott Bowman
 
Photography 101
Photography 101Photography 101
Photography 101Rica Camus
 

Viewers also liked (20)

Technical Paper Presentation- ERC Forum
Technical Paper Presentation- ERC ForumTechnical Paper Presentation- ERC Forum
Technical Paper Presentation- ERC Forum
 
Franklin structures certified plant Energy Star Certificate
Franklin structures certified plant Energy Star CertificateFranklin structures certified plant Energy Star Certificate
Franklin structures certified plant Energy Star Certificate
 
Report_EBACProject_BBP
Report_EBACProject_BBPReport_EBACProject_BBP
Report_EBACProject_BBP
 
ELECTRICAL SCHMATICS AT NCP_FINAL
ELECTRICAL SCHMATICS AT NCP_FINALELECTRICAL SCHMATICS AT NCP_FINAL
ELECTRICAL SCHMATICS AT NCP_FINAL
 
Married indies: How to ship a successful game without killing your spouse
Married indies: How to ship a successful game without killing your spouseMarried indies: How to ship a successful game without killing your spouse
Married indies: How to ship a successful game without killing your spouse
 
Making the Most from Metering
Making the Most from MeteringMaking the Most from Metering
Making the Most from Metering
 
Introduction to Fiscal Metering (Custody Transfer)
Introduction to Fiscal Metering (Custody Transfer) Introduction to Fiscal Metering (Custody Transfer)
Introduction to Fiscal Metering (Custody Transfer)
 
Hvac controls operation and maintenance 3rd edition g. w. gupton
Hvac controls operation and maintenance   3rd edition g. w. guptonHvac controls operation and maintenance   3rd edition g. w. gupton
Hvac controls operation and maintenance 3rd edition g. w. gupton
 
Chilled Water Plant Optimization
Chilled Water Plant OptimizationChilled Water Plant Optimization
Chilled Water Plant Optimization
 
Trg trc017-en hvac system control
Trg trc017-en hvac system controlTrg trc017-en hvac system control
Trg trc017-en hvac system control
 
EMA Energy Management Training for Organisations and Individuals
EMA Energy Management Training for Organisations and IndividualsEMA Energy Management Training for Organisations and Individuals
EMA Energy Management Training for Organisations and Individuals
 
NFC Australia: A snapshot
NFC Australia: A snapshotNFC Australia: A snapshot
NFC Australia: A snapshot
 
Chilled water plants
Chilled water plantsChilled water plants
Chilled water plants
 
A talk on Stage Photography: Basics
A talk on Stage Photography: BasicsA talk on Stage Photography: Basics
A talk on Stage Photography: Basics
 
What is energy monitoring?
What is energy monitoring?What is energy monitoring?
What is energy monitoring?
 
Automation- Metering, Sub Station & Industrial Automation
Automation- Metering, Sub Station & Industrial AutomationAutomation- Metering, Sub Station & Industrial Automation
Automation- Metering, Sub Station & Industrial Automation
 
Leed v4-view-from-mep-seats-140429
Leed v4-view-from-mep-seats-140429Leed v4-view-from-mep-seats-140429
Leed v4-view-from-mep-seats-140429
 
Photography 101
Photography 101Photography 101
Photography 101
 
Iot presentation
Iot presentationIot presentation
Iot presentation
 
Daylighting Buildings
Daylighting BuildingsDaylighting Buildings
Daylighting Buildings
 

Similar to Electrical Metering Guide

New Uses For Electric Meters as We Continue to Leverage AMI Technology
New Uses For Electric Meters as We Continue to Leverage AMI TechnologyNew Uses For Electric Meters as We Continue to Leverage AMI Technology
New Uses For Electric Meters as We Continue to Leverage AMI TechnologyTESCO - The Eastern Specialty Company
 
Power Presentation West Palm
Power Presentation West PalmPower Presentation West Palm
Power Presentation West Palmwbbates
 
Legend Power - Effects of Voltage Optimziation
Legend Power - Effects of Voltage OptimziationLegend Power - Effects of Voltage Optimziation
Legend Power - Effects of Voltage OptimziationDave Orton
 
Grid Connections And PPAs: Tim Foster, Smartest Energy
Grid Connections And PPAs: Tim Foster, Smartest EnergyGrid Connections And PPAs: Tim Foster, Smartest Energy
Grid Connections And PPAs: Tim Foster, Smartest EnergySonia Large
 
Course tcd 08electric
Course tcd 08electricCourse tcd 08electric
Course tcd 08electrican55sh
 
Kvar Presentation Ppt 8.8.08[1]
Kvar Presentation Ppt 8.8.08[1]Kvar Presentation Ppt 8.8.08[1]
Kvar Presentation Ppt 8.8.08[1]Keystone Clean Air
 
Optimal Time-of-use Management for Utility Customers Using Behind-the-meter E...
Optimal Time-of-use Management for Utility Customers Using Behind-the-meter E...Optimal Time-of-use Management for Utility Customers Using Behind-the-meter E...
Optimal Time-of-use Management for Utility Customers Using Behind-the-meter E...Tu Nguyen
 
Manufacturing Conference Workshop 3 - OEE and Energy
Manufacturing Conference Workshop 3 -  OEE and EnergyManufacturing Conference Workshop 3 -  OEE and Energy
Manufacturing Conference Workshop 3 - OEE and EnergyIdhammarsystemsltd
 
High level explanation of smart grids and battery energy storage systems
High level explanation of smart grids and battery energy storage systemsHigh level explanation of smart grids and battery energy storage systems
High level explanation of smart grids and battery energy storage systemsMircea Gingu
 
Energy 101 ener noc and demand response
Energy 101   ener noc and demand responseEnergy 101   ener noc and demand response
Energy 101 ener noc and demand responsehzb3
 
Powerqualitysolutions
PowerqualitysolutionsPowerqualitysolutions
PowerqualitysolutionsPOWERON1
 
Electric utility primer john chowdhury 2012 final
Electric utility primer   john chowdhury 2012 finalElectric utility primer   john chowdhury 2012 final
Electric utility primer john chowdhury 2012 finalJohn Chowdhury
 

Similar to Electrical Metering Guide (20)

Distributed Generation Feasibility
Distributed Generation FeasibilityDistributed Generation Feasibility
Distributed Generation Feasibility
 
Home Energy Monitoring
Home Energy MonitoringHome Energy Monitoring
Home Energy Monitoring
 
Demand side management
Demand side managementDemand side management
Demand side management
 
New Uses For Electric Meters as We Continue to Leverage AMI Technology
New Uses For Electric Meters as We Continue to Leverage AMI TechnologyNew Uses For Electric Meters as We Continue to Leverage AMI Technology
New Uses For Electric Meters as We Continue to Leverage AMI Technology
 
Power Presentation West Palm
Power Presentation West PalmPower Presentation West Palm
Power Presentation West Palm
 
Legend Power - Effects of Voltage Optimziation
Legend Power - Effects of Voltage OptimziationLegend Power - Effects of Voltage Optimziation
Legend Power - Effects of Voltage Optimziation
 
Grid Connections And PPAs: Tim Foster, Smartest Energy
Grid Connections And PPAs: Tim Foster, Smartest EnergyGrid Connections And PPAs: Tim Foster, Smartest Energy
Grid Connections And PPAs: Tim Foster, Smartest Energy
 
Course tcd 08electric
Course tcd 08electricCourse tcd 08electric
Course tcd 08electric
 
Kvar Presentation Ppt 8.8.08[1]
Kvar Presentation Ppt 8.8.08[1]Kvar Presentation Ppt 8.8.08[1]
Kvar Presentation Ppt 8.8.08[1]
 
Optimal Time-of-use Management for Utility Customers Using Behind-the-meter E...
Optimal Time-of-use Management for Utility Customers Using Behind-the-meter E...Optimal Time-of-use Management for Utility Customers Using Behind-the-meter E...
Optimal Time-of-use Management for Utility Customers Using Behind-the-meter E...
 
Manufacturing Conference Workshop 3 - OEE and Energy
Manufacturing Conference Workshop 3 -  OEE and EnergyManufacturing Conference Workshop 3 -  OEE and Energy
Manufacturing Conference Workshop 3 - OEE and Energy
 
Mike Montoya - SCE
Mike Montoya - SCEMike Montoya - SCE
Mike Montoya - SCE
 
19 schoeder grid stability support for ieee sandia labs symposium
19 schoeder grid stability support for ieee sandia labs symposium19 schoeder grid stability support for ieee sandia labs symposium
19 schoeder grid stability support for ieee sandia labs symposium
 
High level explanation of smart grids and battery energy storage systems
High level explanation of smart grids and battery energy storage systemsHigh level explanation of smart grids and battery energy storage systems
High level explanation of smart grids and battery energy storage systems
 
Energy 101 ener noc and demand response
Energy 101   ener noc and demand responseEnergy 101   ener noc and demand response
Energy 101 ener noc and demand response
 
Utilities
UtilitiesUtilities
Utilities
 
Powerqualitysolutions
PowerqualitysolutionsPowerqualitysolutions
Powerqualitysolutions
 
costo de energia
costo de energiacosto de energia
costo de energia
 
Smart grids & consumers
Smart grids & consumersSmart grids & consumers
Smart grids & consumers
 
Electric utility primer john chowdhury 2012 final
Electric utility primer   john chowdhury 2012 finalElectric utility primer   john chowdhury 2012 final
Electric utility primer john chowdhury 2012 final
 

More from solpowerpeople

Changes to 2014 NEC Interconnection Rule 705.12
Changes to 2014 NEC Interconnection Rule 705.12Changes to 2014 NEC Interconnection Rule 705.12
Changes to 2014 NEC Interconnection Rule 705.12solpowerpeople
 
053013 pv system site assessment (1)
053013 pv system site assessment (1)053013 pv system site assessment (1)
053013 pv system site assessment (1)solpowerpeople
 
041813 rs 120 rule and test taking strat
041813 rs 120 rule and test taking strat 041813 rs 120 rule and test taking strat
041813 rs 120 rule and test taking strat solpowerpeople
 
012413 passive solar design
012413 passive solar design012413 passive solar design
012413 passive solar designsolpowerpeople
 
Inter row shading 4-19-12
Inter row shading 4-19-12Inter row shading 4-19-12
Inter row shading 4-19-12solpowerpeople
 
PV Monitoring Systems w/Arturo Zarate
PV Monitoring Systems w/Arturo ZaratePV Monitoring Systems w/Arturo Zarate
PV Monitoring Systems w/Arturo Zaratesolpowerpeople
 
PV Installations & Errors
PV Installations & ErrorsPV Installations & Errors
PV Installations & Errorssolpowerpeople
 
Webinar 03 electrical installation of pv system
Webinar 03 electrical installation of pv system Webinar 03 electrical installation of pv system
Webinar 03 electrical installation of pv system solpowerpeople
 
#SolarMOOC: Webinar on Project Management of Solar PV with Jeffery Lee Johnso...
#SolarMOOC: Webinar on Project Management of Solar PV with Jeffery Lee Johnso...#SolarMOOC: Webinar on Project Management of Solar PV with Jeffery Lee Johnso...
#SolarMOOC: Webinar on Project Management of Solar PV with Jeffery Lee Johnso...solpowerpeople
 
#SolarMOOC Random Problems from 2009 NABCEP STUDY GUIDE
#SolarMOOC Random Problems from 2009 NABCEP STUDY GUIDE#SolarMOOC Random Problems from 2009 NABCEP STUDY GUIDE
#SolarMOOC Random Problems from 2009 NABCEP STUDY GUIDEsolpowerpeople
 
#Solar mooc voltage drop calculations
#Solar mooc voltage drop calculations#Solar mooc voltage drop calculations
#Solar mooc voltage drop calculationssolpowerpeople
 
Final trig problem solution
Final trig problem solutionFinal trig problem solution
Final trig problem solutionsolpowerpeople
 
#Solar mooc 2009 nabcep study guide solutions 1-29
#Solar mooc 2009 nabcep study guide solutions 1-29#Solar mooc 2009 nabcep study guide solutions 1-29
#Solar mooc 2009 nabcep study guide solutions 1-29solpowerpeople
 
#Solarmooc Arctan Solution
#Solarmooc Arctan Solution#Solarmooc Arctan Solution
#Solarmooc Arctan Solutionsolpowerpeople
 
#Solar mooc problem set 1 alternate exercise 1 solution.
#Solar mooc problem set 1 alternate exercise 1 solution.#Solar mooc problem set 1 alternate exercise 1 solution.
#Solar mooc problem set 1 alternate exercise 1 solution.solpowerpeople
 

More from solpowerpeople (17)

Changes to 2014 NEC Interconnection Rule 705.12
Changes to 2014 NEC Interconnection Rule 705.12Changes to 2014 NEC Interconnection Rule 705.12
Changes to 2014 NEC Interconnection Rule 705.12
 
053013 pv system site assessment (1)
053013 pv system site assessment (1)053013 pv system site assessment (1)
053013 pv system site assessment (1)
 
041813 rs 120 rule and test taking strat
041813 rs 120 rule and test taking strat 041813 rs 120 rule and test taking strat
041813 rs 120 rule and test taking strat
 
012413 passive solar design
012413 passive solar design012413 passive solar design
012413 passive solar design
 
Inter row shading 4-19-12
Inter row shading 4-19-12Inter row shading 4-19-12
Inter row shading 4-19-12
 
PV Monitoring Systems w/Arturo Zarate
PV Monitoring Systems w/Arturo ZaratePV Monitoring Systems w/Arturo Zarate
PV Monitoring Systems w/Arturo Zarate
 
PV Installations & Errors
PV Installations & ErrorsPV Installations & Errors
PV Installations & Errors
 
Webinar 03 electrical installation of pv system
Webinar 03 electrical installation of pv system Webinar 03 electrical installation of pv system
Webinar 03 electrical installation of pv system
 
#SolarMOOC: Webinar on Project Management of Solar PV with Jeffery Lee Johnso...
#SolarMOOC: Webinar on Project Management of Solar PV with Jeffery Lee Johnso...#SolarMOOC: Webinar on Project Management of Solar PV with Jeffery Lee Johnso...
#SolarMOOC: Webinar on Project Management of Solar PV with Jeffery Lee Johnso...
 
Using sohcahtoa
Using sohcahtoaUsing sohcahtoa
Using sohcahtoa
 
What is a triangle
What is a triangleWhat is a triangle
What is a triangle
 
#SolarMOOC Random Problems from 2009 NABCEP STUDY GUIDE
#SolarMOOC Random Problems from 2009 NABCEP STUDY GUIDE#SolarMOOC Random Problems from 2009 NABCEP STUDY GUIDE
#SolarMOOC Random Problems from 2009 NABCEP STUDY GUIDE
 
#Solar mooc voltage drop calculations
#Solar mooc voltage drop calculations#Solar mooc voltage drop calculations
#Solar mooc voltage drop calculations
 
Final trig problem solution
Final trig problem solutionFinal trig problem solution
Final trig problem solution
 
#Solar mooc 2009 nabcep study guide solutions 1-29
#Solar mooc 2009 nabcep study guide solutions 1-29#Solar mooc 2009 nabcep study guide solutions 1-29
#Solar mooc 2009 nabcep study guide solutions 1-29
 
#Solarmooc Arctan Solution
#Solarmooc Arctan Solution#Solarmooc Arctan Solution
#Solarmooc Arctan Solution
 
#Solar mooc problem set 1 alternate exercise 1 solution.
#Solar mooc problem set 1 alternate exercise 1 solution.#Solar mooc problem set 1 alternate exercise 1 solution.
#Solar mooc problem set 1 alternate exercise 1 solution.
 

Electrical Metering Guide

  • 1. This is a photographic template – your photograph should fit precisely within this rectangle. Metering & Monitoring Systems Steve Van Duser Meters & Relays Application Engineer © 2008 Eaton Corporation. All rights reserved.
  • 2. Agenda • Introduction • Why is electrical metering important? • What does a meter do? • Where to apply meters? • Solutions • Designing a metering & monitoring system. • Choosing the right meter. • Understanding the information. • Questions 2 2
  • 4. Why Measure? “If you can’t measure it, you can’t manage it!” 4 4
  • 5. Why Electrical Power Metering? Ene y alit rgy Qu Con r we s Po erv atio n Alternative Energy 5 5
  • 6. 7 Reasons for installing meters 1 - Verification of the utility suppliers accuracy and integrity • Applying a revenue class meter at the incoming line allows the user to confirm the accuracy of the utility meter and bill. • Customers will have access to their true energy consumption as well as their power demand. In some cases, peak demand rates are nearly ½ of the total electric bill. 6 6
  • 7. 7 Reasons for installing meters 2 - Identification of energy-consuming loads • The next step in any successful energy management program is the identification of the loads within a facility that consume the most energy. • Prioritizing energy reduction efforts including shedding non-critical loads, shifting loads to an off-peak rate period, and targeting inefficient operations for further action. 7 7
  • 8. 7 Reasons for installing meters 3 - Establishment of a facility’s historical baseline • Documenting historical baselines provides users with the added ability to gain a deeper understanding of where their power is going today! • Consumers are able to analyze the data to make better decisions for reduce energy tomorrow! 8 8
  • 9. 7 Reasons for installing meters 4 - Documentation of energy reduction efforts • Users will be able to benchmark the effectiveness of energy reduction efforts of a load management program or the purchase and installation of high efficiency products (lighting, motors, and drives). • Verification of the implemented programs provides confirmation on success of each effort taken to reduce energy consumption. 9 9
  • 10. 7 Reasons for installing meters 5 - Activity-based costing to departments, processes, and products • Accurately allocating energy costs to departments creates accountability and the incentive to take ownership of energy management efforts. • Additionally, understanding energy costs as they relate to specific processes of products provides management with an additional tool to use in making production decisions. 10 10
  • 11. 7 Reasons for installing meters 6 - Contribute to LEED certification • The LEED Green Building Rating System™ is the nationally accepted benchmark for the design, construction, and operation of high performance green buildings. • Your facility can earn up to 5 points towards LEED certification under Energy and Atmosphere Credit 2, On-Site Renewable Energy; Credit 3, Enhanced Commissioning; Credit 5, Measurement & Verification. 11 11
  • 12. 7 Reasons for installing meters 7 - Development of utility rate comparison procedure • Metering and documentation provides additional tools to use in selecting the ideal utility rate structure. • Consumers are able to measure the output of their on-site alternative energy production to qualify for energy rebates and credits. 12 12
  • 13. What do meters do? 13 13
  • 14. 2 Categories of Measurement Energy and Power • Energy Usage (kWh) • Power Demand (KW) • Volts & Amps • KVAR & KVA Power Quality • Power Factor • Total Harmonic Distortion • Transients • Surges • Sags • Swells • Frequency variations 14 14
  • 15. Energy Usage - Simplified kWh • Energy usage expressed in units of kilowatt-hours. • Defined as the rate of consumption in kilowatts per hour. 10 electric light bulbs rated at 100W would use 1KWh if left burning for an hour. 15 15
  • 16. Energy Usage - Time of Use Time Of Use • Based upon availability of capacity. • On/Off Peak • Hours within a day • Certain months of the year 16 16
  • 17. Power Demand KW • Measured in Kilowatts. • The amount of power being demanded by a customer at a certain moment in time. • The utility measures time in a Demand Window. • Windows of time, typically (5min, 15min, 30 min or 60min) are being Utilities can’t store recorded. their power, it’s got to go somewhere! • The average reading of the window is typically used for billing. 17 17
  • 18. Power – How is it calculated Power Units • Volts X Amps = VoltAmps (VA). Resistive • Watts = VA, if the load is 100% Load resistive. • Both inductive and capacitive loads Inductive create losses measured in VARs. Load • Utilities have to provide VA to supply enough power to cover the Capacitive real power and the losses. Load • Real work performed is Watts. 18 18
  • 19. Power – Power Factor Mug Capacity = Apparent Power (KVA) (kVAR) Foam = Reactive Power (KVAR) Beer = Real Power (kW) (kVA) Beer (kW) Power Factor = (kW) Mug Capacity (KVA) Utilities have to generate kVA, but consumers can only use kW! kVAR penalties are enforced by the utility! 19 19
  • 20. Power Quality - Issues Frequency variations Interruption 2002 EPRI study Line Noise of 985 customers in the US 5% 5% 5% 5% 46% Sags Harmonics 7% 7% 10% Over voltage 10% Swells Under voltage Spikes, switching transients 20 20
  • 21. Where do I use meters? 21 21
  • 22. Where to install meters? • Incoming Utility Service • Alternative Energy Sources • Load Equipment • HVAC units • Chillers • Air Compressors • Motors • Lighting Panels • Computers 22 22
  • 23. Incoming Utility and Alternate Energy Feed-in Tariff Application 1. Standard Meter – Utility owned (Bi-Directional) 2. FiT Meter – Customer owned Net Metering Application 1. Standard Meter – Utility owned (Bi-Directional) 2. Customer owned meter - Optional Power Purchase Agreement 1. Standard Meter – Utility owned (Bi-Directional) 2. PPA Meter – Customer owned Standard meter 23 23
  • 24. Electrical One-Line 13,800V Utility Pole XFMR 480V Utility Meter Electrical Switchboard MAIN Breaker 2000A 1200A 800A 600A Chiller Compressor Lighting Panel Load Equipment 24 24
  • 25. Electric Panel MAIN DP-101 DP-101 LP-201 LP-201 MAIN AHU #1 BKR AHU #1 25 25
  • 26. Metering & Monitoring Systems 26 26
  • 27. Solutions Features of a metering and monitoring system 1. Measurement 2. Gathering the data 3. Storing the data 4. Presenting the data as valuable information 5. Analyzing the data 6. Creating meaningful reports 7. Providing notification and recommendations 27 27
  • 28. Modern Electrical Metering Systems Complete Web-based System 1. High end Power Quality Meters connect directly to the Ethernet LAN (built-in web pages) 2. Ethernet Gateways (Data Loggers) bridge serial communicating meters to the Ethernet LAN (built-in web pages) 3. Software provides holistic view of the entire power system • Built-in web graphics (reduces startup and commissioning costs) • Based upon SQL Server for advanced data analysis and trending of energy and demand values • Optional advanced reporting system for standard and customized energy and power quality reports Easy as 1,2,3… All you need is a web browser! 28 28
  • 29. A Web-based Architecture • A Web-based architecture allows a web browser to access information. Anywhere Web-enabled 29 29
  • 30. Example Meter Home - Web Page 30 30
  • 31. Data Logging Gateway – Features •Web Pages •Data Logging • Energy Software Gateway Ethernet Network Modbus RTU Tie in existing Modbus meters INCOM IQ 150 IQ 250 IQ 35M Tie in existing INCOM meters 31 31
  • 32. Metering System Communications PC Web Browser Ethernet Ethernet Switch Main Meter PowerXpert PXM2200 Gateway Modbus RTU RS-485 Network Ethernet Network RS-485 Network Feeder Circuits – IQ Series 32 32
  • 33. Metering & Monitoring Systems 33 33
  • 35. Eaton Meters Line Overview Special Use Meters Switchgear/Switchboard Panelboard/Switchboard PX Meter PXM 2000 IQ Energy/Power Sentinel Revenue Ethernet/ Class Full Data Monitors Power featured PQ Logging and Energy for Meter Series C IQ 250/260 Breakers Universal Int/Ext Revenue Class IQ Universal Enclosed Panel Meter, I/O Power Sentinel Opt Internal CTs IQ 130/140/150 Basic metering IQ 35M Communication Opt Low Profile Energy Meter Wireless IQ150S/250S Multipoint Basic/Revenue Metering Metering Integrated Wireless Flexible Submetering 35 for Energy 35 Use
  • 36. IQ130/140/150 Application • Where energy usage and utility charges are of primary concern • Replacing analog meters • Submetering individual loads • Cost effective measurement of current and voltage is needed • Interest in measurement of only power • Energy feed into 3rd party systems Key Features Tools • Industry standard communication • www.eaton.com/meters • Percentage load indication on face of meter • Product Focus • Configurable wiring systems • Technical Data Sheet • Sales Presentation • Password protect energy and demand resets • Specification guide • Selectable meter variables on display • FAQ • Autoscroll or fixed display • www.eaton.com/meterwizard • Transducer only versions 36 36
  • 37. IQ250/260 Application • Where energy usage and utility charges are of primary concern • Where there is a need to output meter variables through 4-20 ma signal • Where there is a need to capture other meter inputs such as WAGES • Where variable loads are present such as variable speed drives, arc welders, lighting dimmers, etc. Key Features Tools • Industry standard communication protocols • www.eaton.com/meters • Total harmonic distortion measurement • Product Focus • Visual indication of limits exceeded on face of • Technical Data Sheet meter • Sales Presentation • Analog and digital outputs • Specification guide • Digital inputs can be used to accumulate other • FAQ meter data • www.eaton.com/meterwizard • Upgradeable to a PXM2000 37 37
  • 38. Power Xpert Meters (PXM Series) Application • Where energy usage and utility charges are of primary concern • Where a direct Ethernet connection is required • User of sensitive electronic equipment • Where variable loads are present such as variable speed drives, arc welders, lighting dimmers, etc. • Where there is a need to analyze historical energy usage Key Features Tools • Industry standard communication protocols • www.eaton.com/meters • Data Logging up to 768 MB • Product Focus (Aid) brochure • Individual Harmonic sampling • Technical Data Sheet • Built in web server • Sales Presentation • Viewable single cycle waveform • Specification Guide • Analog and digital outputs • FAQ • Digital inputs can be used to accumulate other • Live Meter Demo meter data • www.eaton.com/meterwizard 38 38
  • 40. Single Unit Enclosure NEMA 12(shown), Hinged front 3R, & 4X enclosures opening door Eaton PXM2000 Series Eaton IQ150 series Eaton IQ250/260 Padlocking latch provision 40 40
  • 41. Single Unit Enclosed Meter Inside View 41 41
  • 42. Multi Unit Enclosure NEMA 12(shown), Hinged front 3R, & 4X enclosures opening door Eaton IQ 35M Series Eaton IQ150 series Eaton IQ250/260 Padlocking latch provision 42 42
  • 44. Data Communications Port Ethernet Port Power Supply Inputs RS485 System Voltage KYZ Out Inputs I/O Slot 44 44
  • 48. User Interface - Harmonics 48 48
  • 49. User Interface - Waveforms 49 49
  • 50. User Interface - I/O 50 50
  • 51. User Interface - Events 51 51
  • 52. User Interface – Alarm Limits 52 52
  • 53. User Interface - Email 53 53
  • 54. PX Energy Viewer (EV) • The Power Xpert EV is a Free downloadable excel based tool for users to access their Power Xpert Gateway 200E Interval log files and create a simple report on the most important Data Sources from those devices. 54 54
  • 55. Energy Viewer Tool Data Sources • Network Node - The user connects to an IP address. Upon success, this connection is dubbed a "Network Node". • Branch Node - Under the Network Node are "Branch Nodes". The only purpose they serve is to provide access to other nodes. • Device Node - A special kind of Node, called a "Device Node", is one that has "Data Sources" that can be graphed. Device Nodes have special settings for customization. • Data Source - The "Data Source" is graphable data that can be selected to generate a report. Will 55 55
  • 56. Energy Viewer Tool Graph Source • Graph Source - When a report is generated, the user selects a number of Data Sources for graphing. These selected Data Sources are dubbed "Graph Sources" for what will be graphed in the report. 56 56
  • 57. Energy Viewer Tool Table and Graph Report • When a report is generated, the user will see the following for the Data Sources they have selected. These selected Data Sources can be saved into excel for further manipulation if required or printed. 57 57
  • 58. Demo Sites • PXG 800E - http://192.104.67.189 login name: user password: user • PXM 2290 - http://192.104.67.189 • PXM 8000 - http://192.104.67.190 58 58
  • 59. Q&A 59 59
  • 60. Contact Info Steve Van Duser Application Engineer Southeast Region Eaton Corporation 8380 Capital Blvd Raleigh, NC 27616 Technical Support: Email:StevenJVanDuser@Eaton.com 1-800-809-2772 Phone: (919) 431-6211 Option #4, then Option #1 Cell: (919) 272-7143 www.eaton.com/meters 60 60
  • 61. 61 61

Editor's Notes

  1. Text…
  2. PXG200E HTTP User interface Home page displays real time status of devices on the Main and Bus networks, as well as Events (alarm status) of native events on individual devices.
  3. When used in conjunction with PX Gateway, can communicate with PX Software. Templates are in PX Gateway and PX Software. This is a cost effective solution when meters are grouped together and a central web enabled device can do the data logging or be used as a web browser.
  4. Eaton provides a comprehensive set of metering solutions that cover everything from basic measurement of current and volts with no communications to measuring transient power quality events that occur in milliseconds and email you with event information attached.
  5. This chart is showing the complete metering line as it stands today broken out by where it is applied. www.eaton.com/meters is the source for all of our metering products. Switchgear/Switchboard meters-Combination of open protocol and INCOM meters Panel Meters-combination of open protocol and INCOM meters Submetering-currently only INCOM meters with desire to add open protocol products, can substitute some of the lower end open protocol panel meters in the meantime. This will be a focus of our 2010 development effort. The Meter Product Family Trifold is our printed comparison that is very helpful. All meters are presented for a quick, at-a-glance reference.
  6. Providing the first line of defense against costly power problems, Eaton’s new IQ 100 electronic power meters can perform the work of an entire wall of legacy metering equipment utilizing today’s technology. Eaton’s IQ 100 meters meet ANSI C12.20 standards for accuracy of 0.5 percent. With such high-performance measurement capability, these meters can be confidently used for primary revenue metering and sub metering applications. Eaton’s IQ 100 meters provide direct-reading metered values for the most critical power aspects, such as watts, watt demand, watt-hours, voltage, amperes (VA), VA-hours, vars, varhours and power factor. The IQ 130 meter provides basic measurement with the ability to monitor volts and amps per phase. It meets ANSI C12.20 standards for accuracy of 0.5 percent and has optional Modbus/KYZ output. The IQ 140 meter provides the same ability as the IQ130 with the additional ability to monitor power. The IQ 150 meter provides the same ability as the IQ140 with the additional ability to monitor energy. It can also output signals to Power Xpert Gateways or 3 rd party systems through it’s Modbus interface. Depending on the customer requirements, this is a cost effect metering option.
  7. The IQ 250 meter provides comprehensive power and energy monitoring along with ANSI C12.20 accuracy of 0.2 percent. This meter comes standard with one serial connection for Modbus RTU and one KYZ output. The IQ 250 includes two optional I/O slots. The IQ 260 meter provides the same abilities as the IQ250 with the additional ability to monitor total harmonic distortion (THD) for volts and current. The IQ 260 can be setup with up to 16 configurable limits for alarming or to activate optional relay outputs. Visual indication of limits exceeded is present at the meter face. This meter family allows the user to integrate other meter inputs through the use of it’s I/O capabilities. It can also output signals to Power Xpert Gateways or 3 rd party systems through it’s Modbus interface or through a 4-20 ma signal. The IQ250/260 can also be upgraded to a PXM2250/2260 at a later point in time as well.
  8. The Power Xpert Meter 2250 has an embedded web server for comprehensive power and energy monitoring , ANSI C12.20 accuracy of 0.2 percent, 256 MB of data logging, and the ability to set up alarms and limits on the gateway card for any measured parameter. This meter comes standard with two independent communications ports, one serial connection for Modbus RTU and one network connection for Modbus TCP. The PXM 2250 includes one optional I/O slot. The Power Xpert Meter 2260 has the same abilities as the PXM2250 with 512 MB for data logging and the added ability to monitor total harmonic distortion (THD) for volts and current. The PXM 2260 can be setup with up to 16 on-board meter hardware configurable limits for alarming or to activate optional relay outputs. Visual indication of limits exceeded is present at the meter face. The Power Xpert Meter 2270 has the same abilities as the PXM2260 with 768 MB data logging and the added ability individual harmonic distortion (THD) for volts and current. The PXM 2270 offers a waveform view on a PC to visualize steady-state harmonic content through embedded Web server to identify power quality issues. Data logging and Ethernet connectivity make this a cost effective option when installing meters at separate locations desiring an Ethernet connection.
  9. Sturdy NEMA 12 enclosure prevents dust and other materials from entering. Internal gaskets also prevent air irritants from harming the vital equipment inside. This quality enclosure meets most indoor application needs. NEMA 3R and 4X also available.
  10. To ensure safety, Eaton’s Enclosed Meter includes a fused disconnect for line voltage that can be turned off during meter maintenance. For applications with line voltages above 265Vac, an optional control power transformer is supplied in the enclosure. Control voltage can also be supplied via a separate source that is wired to the field installation terminal block. CT inputs for the meter are wired directly to shorting terminal blocks for easy field installation. With Eaton’s Enclosed Meter, everything is wired at the factory. The shorting block, terminal blocks, etc. So you can be sure it’s done right. Factory wired products also save on installation time and costs. NEMA 12 meters are flush mounted on the enclosure door with all inputs/outputs factory-wired to terminal blocks. NEMA 3R and 4X versions offer additional protection with separate drop down internal flush mounted meter.
  11. Sturdy NEMA 12 enclosure prevents dust and other materials from entering. Internal gaskets also prevent air irritants from harming the vital equipment inside. This quality enclosure meets most indoor application needs. NEMA 3R and 4X also available.
  12. Power Supply Inputs Accepts 90-265 VAC @50/60 Hz or 100-370 VDC, also optional 18-60 VDC System Voltage Inputs Phase to Reference-20-576 VAC Phase to Phase-0-721 VAC RS485-standard Modbus RTU KYZ Out-standard watt hour pulse Meter Gateway Card Standard RJ45 copper connection with Modbus TCP/IP
  13. The Meter page provides Voltage , Current , and Frequency values. You can view information by measurement type or by phase. You can select trending, waveform, harmonics or phasor graphs from the drop-down box near the top of the page. When Trend and Min/Max is selected, the minimum and maximum values are displayed with date and time stamps. When Harmonics is selected, a table is displayed showing the Frequency ( Hz ), Magnitude, and Angle (Deg) . By default, the fundamental frequency is included. It can be excluded by selecting the Exclude Fundamental check box on the left side of the page. NOTE: the Waveform and Harmonics views are only available on the PXM 2270/2280/2290 model.
  14. From the Power page, click one of the radio buttons on the left side of the page that represents the type of power measurement you want to view. The page will update to display a graph with minimum, maximum and average values as per the selection.
  15. Energy page includes basic energy information along with ability to do demand profiles and comparisons. The Power Xpert Meter measures and accumulates three kinds of energy values every 60 cycles: Real Power (Watts), Reactive Power (VAR) and Apparent Power (VA). Real Power and Reactive Power take direction into account, and so are recorded for forward, reverse, net and sum. The Demand Comparison page is similar to the Demand Profile page, but provides a graph you can use to compare two overlaid demand plots from selectable periods of time. You can select to compare plots between: • Today and Yesterday • This Week and Last Week • This Month and Last Month • 2 different Days • 2 different Weeks • 2 different Months
  16. The Quality page contains information about the present power quality for PXM2260/2270/2280/2290 meters. These meters calculate the following instantaneous values, averaged over a period of 60 cycles: • Percent THD of Current for Phases A, B, and C • Percent THD of Voltage for Phases A, B, and C. Using the drop-down box above the graph, you can select to view this information as a trend, with minimum and maximum values, or as harmonics. .
  17. Energy page includes basic energy information along with ability to do demand profiles and comparisons. The Power Xpert Meter measures and accumulates three kinds of energy values every 60 cycles: Real Power (Watts), Reactive Power (VAR) and Apparent Power (VA). Real Power and Reactive Power take direction into account, and so are recorded for forward, reverse, net and sum. The Demand Comparison page is similar to the Demand Profile page, but provides a graph you can use to compare two overlaid demand plots from selectable periods of time. You can select to compare plots between: • Today and Yesterday • This Week and Last Week • This Month and Last Month • 2 different Days • 2 different Weeks • 2 different Months
  18. The Power Xpert Meter 2000 utilizes the same I/O cards as the IQ 250/260 and are extremely flexible and can be used in a large variety of different applications. Digital inputs and relay outputs can be programmed to interact during various conditions defined by the user. Various third-party devices, such as alarms, pulse meters, trip units and sensors, can be easily integrated to the Power Xpert Meter 2000. Triggers and events can be tied to the meter’s standard functions, such as e-mail, logs and trends. Analog outputs can be programmed to output meter parameters to BMS or PLC systems.
  19. Events page shows out of limits based on gateway card triggers. Four levels will be available-upper and lower critical and upper and lower cautionary. The Power Xpert Meter monitors and logs three kinds of events; Input Status , Out of Limits , and Alarm on Value . Events can be used to send e-mail as well.
  20. Gateway card limits setup page Triggers are configured in the Setup page. Each trigger can have the following limits: • Upper Critical Limit • Upper Cautionary Limit • Lower Cautionary Limit • Lower Critical Limit In addition, you can select: • If alarms are enabled for this data. • If the alarm/event closes automatically when the value falls below the high limits or above the low limits. If not, a user must acknowledge the alarm to remove it from the active list. In addition, alarms and events will generate an RSS feed and can generate email and alerts.
  21. Email setup screen. The PXM 2000 meter provides a highly configurable capability to report on meter activity via email. You can configure: • The SMTP server, including the server and account information. • Email triggers. The meter will send emails in response to any event trigger that has been enabled for email, and this set includes a core set of hardware and communications failure triggers that you can also select. The contents of this list are dependent on the option card installed in the meter. • Recipient specific settings for up to 10 email recipients. This includes settings for sending emails when an event occurs and/or clears and for sending periodic status emails.
  22. The Power Xpert Energy Viewer is a free downloadable software designed to work directly with the interval log files in the PXG200E. Users will be able to generate simple reports over different time periods to show the systems power and energy parameters. A simple report can be generated to show a maximum of four parameters being compared over a specified time period, (i.e.. 30 days)
  23. The PXEV is a simple tool designed to acquire data from the specified parameters called data sources from the device on the PXG200E.
  24. In order to generate the report the user needs to make sure they have the data source files to graph from the available data.
  25. The PX Energy Viewer will generate a simple report based on the data chosen from the interval log in the PXG600E and 800E. With this information user’s can generate simple 30 day energy usage reports to conform with Energy Efficiency initiatives for Energy Star and LEED certification.
  26. Speaker information.