Downloaded 566 times
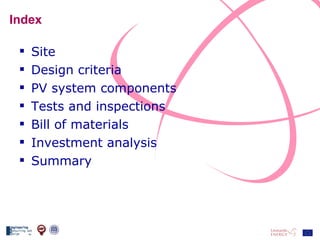
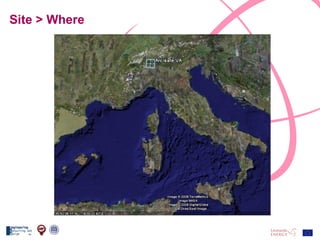
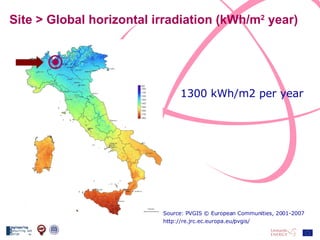
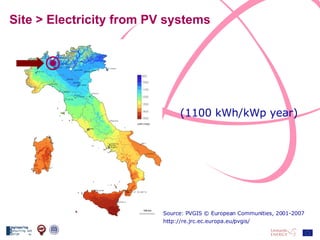
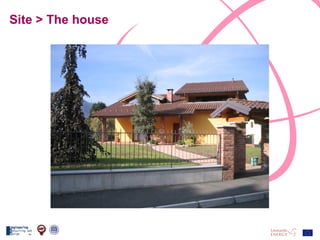
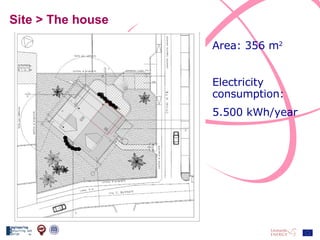
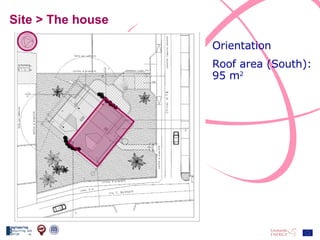
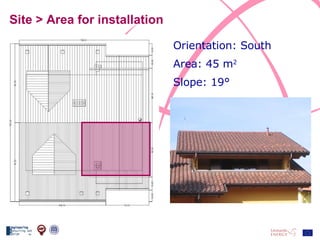
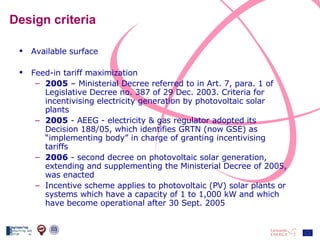
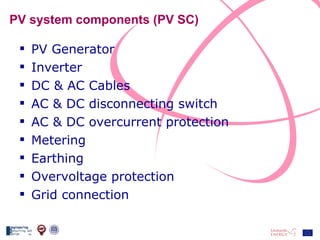
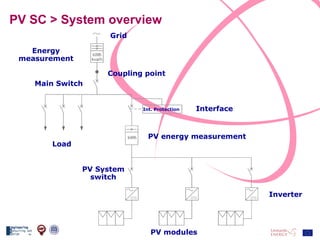
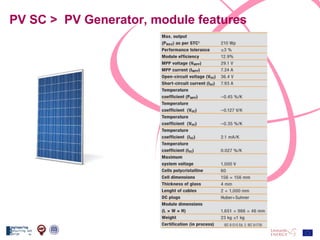
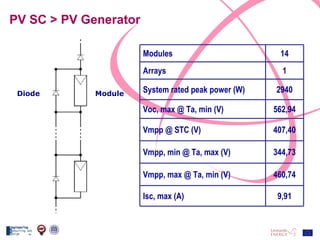
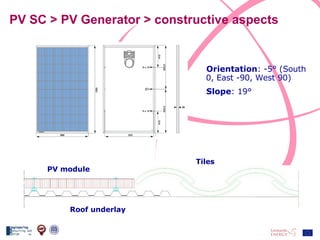
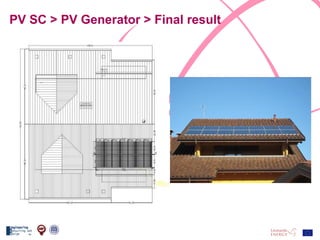
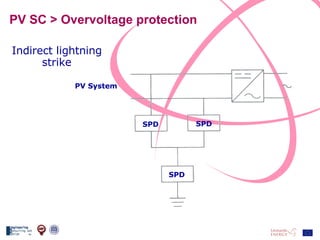
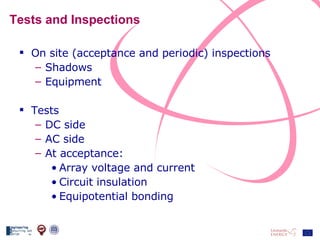
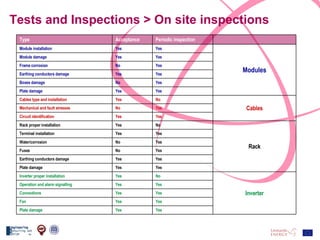
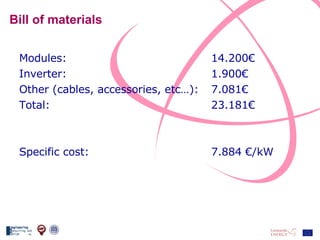
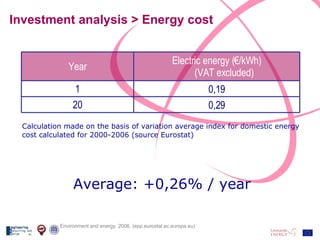
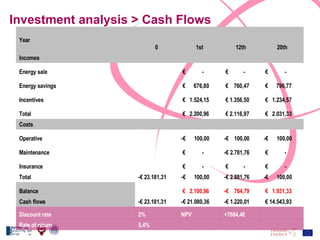
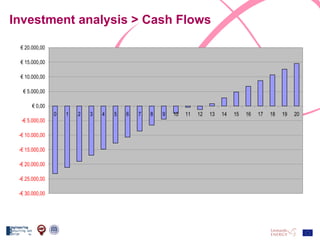
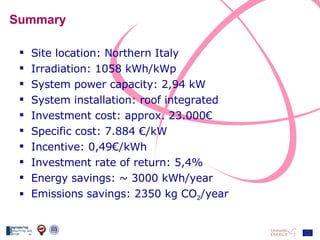

The document discusses the design and analysis of a photovoltaic (PV) system installed on a house in Northern Italy. It describes the site details and energy usage, the 2.94 kW PV system components and specifications, tests and inspections conducted, a bill of materials, and an investment analysis. The investment analysis found a 5.4% rate of return over 20 years based on incentives of 0.49 Euros/kWh for the PV-generated energy and estimated energy savings of around 3000 kWh per year.