SlideShare a Scribd company logo
1 of 4
Download to read offline
Advanced Energy Management System


EDGE ENERGY introduces an Automated Advanced
                                                                    DR-FIN products is a "best-of-breed"                     Green    Building Management
 Energy Management System to Measure, Manage and
 Monitor large public facilities. We have designed,                 System     (GBMS),         Security      Access     Control      System   (SACS),   and
 developed and deployed this real-time Energy                       Computerized Maintenance Management System (CMMS) platforms
 Management System that measures, monitors and                      together in a single offering to
 manages devices, with the most advanced visualization              provide    users      with       the    most
 tool including these following features:                           comprehensive             web          based
                                                                    monitoring and control capability
Real time data capture, from various sensors and
 information emitting devise                                        possible       via         our         secure
                                                                    communications            network.       This
Web based tool, that provides information related to the
 Energy/carbon usage foot print, and the usability is designed to   system has the following capabilities;
 suit multiple industry and regulatory needs
                                                                    The Figure 1 is an illustration allows the user to view energy consumption
Dashboards, A personal, on-line communication         interface
                                                                    before and after the implementation of the program. Additionally the user
Usage reports                                                       can simply drag and drop a meter and it will automatically program all the
   Usage curves of electricity, gas, steam, chilled water and oil   modbus registers, and the web application. The detail has been drilled-
   consumption
   Usage comparison of multiple locations or same location          down to the sub-meter level at the breaker panel.
   for different time periods
   Electricity usage and associated cost allocation for selected                                           The Figure 2 is an example of an Energy
   time range
   Daily demand profiles                                                                                   Dash Board that can be run across multiple
                                                                                                           facilities. It allows the user the analytic tools
Exception reports
   Daily consumption values exceeding forecast                                                             necessary to spot problems quickly. The KW
   Location logs for any selected time period, reflecting cost                                             data is stored either on the customers drive
   associated with excess electric consumption
   Day-by-day load profile comparing actual load plots to                                                  or in our cloud in S3. The data thereafter can
   forecasted load and customer established thresholds              be aggregated and displayed in various formats that lend the user greater
   Hourly Data Reports aggregate total electric consumption
   across all locations                                             understanding        of    the    usage        impact.
   Weekly location load data with day-by-day comparison             Whether     it’s     displaying        your     carbon
   Weekly load profile for sub-meters or feeds
                                                                    footprint, KW per square feet, KW per ton,
Alarms & Notifications                                              KW per student, the user is always in full
   Pre-designated parameters activate system alarms,                control of the data that is deemed
   delivered instantly via e-mail or email-enabled phone/pager
   Alarms triggered when consumption, demand or price               significant to the particular application.
   approach preset parameters
   Enhances system reliability, reducing the chance of              The Figure 3 depicts a faculty floor plan that dynamically allows the facility
   unanticipated costs
   News, Weather & Technology –convenient links/websites            owner to view the measured environmental elements status in real time.
                                                                    We also store the data and can play it back like a DVR in time lapse mode
Cost Estimation                                                     allowing the user to play the last 24 hours in 1 minute. Graphically, the
    Generates energy cost estimates for one or all metered
   locations                                                        user can better visualize the heat loads generated over various time
    Generates utility-type bills on a calendar or billing cycle
                                                                    periods and more readily identify areas of excessive inefficiencies. This
    Verifies utility bills and allows “what-if” scenarios to
   evaluate new pricing programs                                    application permits dynamically viewing floor plans across multiple facilities.
When it comes to peak demand & demand response/ management
                                Advanced Energy Management System                                                    Large CNI
 • it is not the residential sector                                                                                               Residential


 • largest peak energy consuming building sector is                                                               Medium CNI

   commercial & public buildings /facilities                                                                                     Small CNI


       The figure 4 provides the user with an intuitive reading of the carbon impact created within a single area or multiple areas as a
       point of energy efficiency reference. The X-Y axis plot the gas and electrical consumption, the color coded designation of the
       graphic ranks the area based on past performance and the size of the graphic depicts the carbon emission. Imagine the
       immediate insight that a four dimensional reading across the various areas of a single building or multiple buildings could bring
                                                 to bear on the system inefficiencies inherent in every structure. The shading of the
                                                 graphic is moderated in real time which allows the user to readily discern micro trends
                                                 as well as longer time frames.

                                                 Figure 5 shows        how one can graphically
                                                 demonstrate a real time metering system with the
                                                 auto programming feature based upon our BOG-
                                                 O-Matic software.

       Identifying energy waste over the breadth of all the user facilities allows the user to address
       the issues of greatest priority in terms of real-time performance. Imagine the regional or
       even global efficiencies that can accrue to the user when the individual facilities are
       displayed comparatively with respect to their carbon impact. Below the largest level of carbon emission is shown in red and the
       magnitude of gas usage relates to the sizing of the rectangle. Whether locally or globally, as shown below, the J2 framework is
       interoperable, connects data from multiple server sites for the purpose of data analysis or demand response. This same
       framework can be applied to individual buildings, faculties, regions, and or any other data set of significance to the user.

                                                     Image Slicer is an application that we built that allows Building Automation
                                                     Companies to build their own graphics through the web. This same tool can be
                                                     utilized to customize the way you
                                                     look and analyze energy data and
                                                     are    of    particular   value     in
                                                     establishing and monitoring energy
                                                     budgets.

       This screen shots demonstrate the software’s capability to not only display
       energy efficiencies but more importantly initiate demand shed measures based
       on user set points. System generated email, text message or voice calls are
       automatically launched when thresholds established by the user are violated. (i.e., the logic could activate a 10% shed when
       90% of peak KW allowance is exceeded) The possibilities for monitoring and affirmative action are unlimited.

       Based on interactions with our customers, there are three main components to DR that will make it attractive to building and
       facility owners and operators:

       First, the implementation must save them money. Customers will not be attracted to high up-front costs, long payback periods
       or limited savings opportunities. Second, it must be convenient and easy to implement. DR-FIN integrates with any building
       operating system, thus significantly simplifying the process - price signals trigger automated responses from buildings based
       on preset rules to adjust energy consumption and environmental conditions accordingly.

       Finally, customers want to be the ultimate decision maker when it comes to their energy consumption. Depending on specific
       circumstances, building operators may or may not want to participate in DR events, and it is important that they maintain the
       option to opt out.
Advanced Energy Management System
Up-front technology costs for DR-FIN program participation are attractive. The DR-FIN based automated DR program has a
relatively low capital cost and short payback period associated with these programs. The DR-FIN allows the customer to reach
                                                  its full load shed capacity without the need for additional building operations
                                                  resources. Our R&D and industry experience focused on the ease of use and
                                                  full integration with existing systems, as convenience is an important factor in
                                                  gaining full advantage of this program. Consumers will not effectively
                                                  participate and respond to price signals if information is difficult to access
                                                  and implementation is     time-consuming. Our objective is ensuring larger
                                                  participation leading to a much larger load shed and provides the utility a
                                                  near-real-time visibility to the program as it happens. Intuitively, this makes
                                                  sense because customers are not always able to respond to price signals
                                                  and may not track them closely. The DR-FIN, on the other hand, facilitates
rapid, consistent load shed responses from customers based on rate / tariff signals from the utility. The majority of the
implementations have been centrally dispatched by the utility with minimal customer input. This scenario has limited appeal to
most commercial building owners since they lose control of their building. A better way is to incentivize these customers to
shift load by a more structured and organized manner, by publishing day ahead forecasted energy prices and real-time energy
prices. The DR-FIN product has built in rule based analytic capability that can be pre-configured by the customer to decide
what loads should be shed based upon its intrinsic value to the particular customer VS the price/rate offered by the utility. We
can handle any data formats and signals; also can aggregate the real-time usage from the AMI system to show the impact of
the any such program.

                                                              So how does the DR-FIN really work? On any hot summer
                                                              afternoon, air conditioners start working harder. Wholesale power
                                                              prices skyrocket and distribution lines become overburdened due
                                                              to the peak load on the grid. We experience such scenarios
                                                              within every utility. As the scenario develops, the DR-FIN will
                                                              allow utilities to pass a price signal to handle such conditions—
                                                              whether it is a curtailment incentive or a real time price. Let’s
                                                              assume the peak hour prices could be 10x the average off-peak
                                                              rate, and smart meters and Automatic Metering Infrastructure will
                                                              enable these types of rate structures to be passed on the DR-FIN
                                                              or through a dedicated GPRS/GSM network.

                                                              The DR-FIN receives that price signal—from the web or from the
                                                              smart meter and provides the control capability to do a number
                                                              of things in response. Information and alerts sent to building
managers and occupants make them aware of such conditions. You can adjust the set points for space temperature or chilled
water temperature. The DR-FIN integrates with any building control system. It ensures and activates its’ control over fan
power that we saved by reducing lift on the chiller, or by reduced plug-loads and/or using advanced light ballasts which can
dim and/or turn off unwanted lights. It can even integrate with the roof-top PV or other alternative energy source to switch over
and avoid the peak-rate and gain higher ROI including the benefits of the renewable energy investment.


  If you are a utility, a facility manager or owner, this system will help you save energy,
         reduce carbon, increase your green footprint, and reduce energy costs.
Advanced Energy Management System

Representative Client list:


CONTACT:
Prakash Menon:       (818) 522 9115 - prakash.menon@wns.com

Tim Owens:           (602) 526 7698 - tim@edgeenergyllc.com

More Related Content

What's hot

[Case study] Dakota Electric Association: Solutions to streamline GIS, design...
[Case study] Dakota Electric Association: Solutions to streamline GIS, design...[Case study] Dakota Electric Association: Solutions to streamline GIS, design...
[Case study] Dakota Electric Association: Solutions to streamline GIS, design...Schneider Electric
 
Application Note: Maintenance Decision Support System (MDSS) for Winter Road ...
Application Note: Maintenance Decision Support System (MDSS) for Winter Road ...Application Note: Maintenance Decision Support System (MDSS) for Winter Road ...
Application Note: Maintenance Decision Support System (MDSS) for Winter Road ...Schneider Electric
 
Energy efficiency data center overview
Energy efficiency data center overviewEnergy efficiency data center overview
Energy efficiency data center overviewSchneider Electric
 
Advanced Weather Systems for Mining Operations
Advanced Weather Systems for Mining OperationsAdvanced Weather Systems for Mining Operations
Advanced Weather Systems for Mining OperationsSchneider Electric
 
[Case study] Jacksonville Electric Authority: Implementing a complete enterpr...
[Case study] Jacksonville Electric Authority: Implementing a complete enterpr...[Case study] Jacksonville Electric Authority: Implementing a complete enterpr...
[Case study] Jacksonville Electric Authority: Implementing a complete enterpr...Schneider Electric
 
Leveraging AMI for Outage Management
Leveraging AMI for Outage ManagementLeveraging AMI for Outage Management
Leveraging AMI for Outage ManagementSchneider Electric
 
Hannover High End Utility Metering
Hannover High End Utility MeteringHannover High End Utility Metering
Hannover High End Utility MeteringSchneider Electric
 
[Webinar Slides] Advanced distribution management system integration of renew...
[Webinar Slides] Advanced distribution management system integration of renew...[Webinar Slides] Advanced distribution management system integration of renew...
[Webinar Slides] Advanced distribution management system integration of renew...Schneider Electric
 
Preparing for Distributed Energy Resources
Preparing for Distributed Energy ResourcesPreparing for Distributed Energy Resources
Preparing for Distributed Energy ResourcesSchneider Electric
 
IBM smarter energy
IBM smarter energyIBM smarter energy
IBM smarter energybenhanley77
 
Underground Self-Healing Solution
Underground Self-Healing Solution Underground Self-Healing Solution
Underground Self-Healing Solution Schneider Electric
 
Implementing energy efficient data centers
Implementing energy efficient  data centersImplementing energy efficient  data centers
Implementing energy efficient data centersSchneider Electric India
 
The metals and mining industry
The metals and mining industryThe metals and mining industry
The metals and mining industrySchneider Electric
 
Distribution Automation Challenges
Distribution Automation ChallengesDistribution Automation Challenges
Distribution Automation ChallengesMohammad Abdullah
 
Integrated Facility Sub Systems
Integrated Facility Sub SystemsIntegrated Facility Sub Systems
Integrated Facility Sub SystemsSchneider Electric
 
Electricity demand side management and end use efficiency
Electricity demand side management and end use efficiencyElectricity demand side management and end use efficiency
Electricity demand side management and end use efficiencyD.Pawan Kumar
 
Eco-mode: Benefits and Risks of Energy-saving Modes of UPS Operation
Eco-mode: Benefits and Risks of Energy-saving Modes of UPS OperationEco-mode: Benefits and Risks of Energy-saving Modes of UPS Operation
Eco-mode: Benefits and Risks of Energy-saving Modes of UPS OperationSchneider Electric India
 
Calibrated Modeling - How Well Does My Building Perform? by Eveline Killian
Calibrated Modeling - How Well Does My Building Perform? by Eveline KillianCalibrated Modeling - How Well Does My Building Perform? by Eveline Killian
Calibrated Modeling - How Well Does My Building Perform? by Eveline KillianCx Associates
 
EnergyDeck UK Version
EnergyDeck UK VersionEnergyDeck UK Version
EnergyDeck UK VersionJohn Arthur
 

What's hot (20)

[Case study] Dakota Electric Association: Solutions to streamline GIS, design...
[Case study] Dakota Electric Association: Solutions to streamline GIS, design...[Case study] Dakota Electric Association: Solutions to streamline GIS, design...
[Case study] Dakota Electric Association: Solutions to streamline GIS, design...
 
Application Note: Maintenance Decision Support System (MDSS) for Winter Road ...
Application Note: Maintenance Decision Support System (MDSS) for Winter Road ...Application Note: Maintenance Decision Support System (MDSS) for Winter Road ...
Application Note: Maintenance Decision Support System (MDSS) for Winter Road ...
 
Energy efficiency data center overview
Energy efficiency data center overviewEnergy efficiency data center overview
Energy efficiency data center overview
 
Advanced Weather Systems for Mining Operations
Advanced Weather Systems for Mining OperationsAdvanced Weather Systems for Mining Operations
Advanced Weather Systems for Mining Operations
 
Small hydro solutions
Small hydro solutionsSmall hydro solutions
Small hydro solutions
 
[Case study] Jacksonville Electric Authority: Implementing a complete enterpr...
[Case study] Jacksonville Electric Authority: Implementing a complete enterpr...[Case study] Jacksonville Electric Authority: Implementing a complete enterpr...
[Case study] Jacksonville Electric Authority: Implementing a complete enterpr...
 
Leveraging AMI for Outage Management
Leveraging AMI for Outage ManagementLeveraging AMI for Outage Management
Leveraging AMI for Outage Management
 
Hannover High End Utility Metering
Hannover High End Utility MeteringHannover High End Utility Metering
Hannover High End Utility Metering
 
[Webinar Slides] Advanced distribution management system integration of renew...
[Webinar Slides] Advanced distribution management system integration of renew...[Webinar Slides] Advanced distribution management system integration of renew...
[Webinar Slides] Advanced distribution management system integration of renew...
 
Preparing for Distributed Energy Resources
Preparing for Distributed Energy ResourcesPreparing for Distributed Energy Resources
Preparing for Distributed Energy Resources
 
IBM smarter energy
IBM smarter energyIBM smarter energy
IBM smarter energy
 
Underground Self-Healing Solution
Underground Self-Healing Solution Underground Self-Healing Solution
Underground Self-Healing Solution
 
Implementing energy efficient data centers
Implementing energy efficient  data centersImplementing energy efficient  data centers
Implementing energy efficient data centers
 
The metals and mining industry
The metals and mining industryThe metals and mining industry
The metals and mining industry
 
Distribution Automation Challenges
Distribution Automation ChallengesDistribution Automation Challenges
Distribution Automation Challenges
 
Integrated Facility Sub Systems
Integrated Facility Sub SystemsIntegrated Facility Sub Systems
Integrated Facility Sub Systems
 
Electricity demand side management and end use efficiency
Electricity demand side management and end use efficiencyElectricity demand side management and end use efficiency
Electricity demand side management and end use efficiency
 
Eco-mode: Benefits and Risks of Energy-saving Modes of UPS Operation
Eco-mode: Benefits and Risks of Energy-saving Modes of UPS OperationEco-mode: Benefits and Risks of Energy-saving Modes of UPS Operation
Eco-mode: Benefits and Risks of Energy-saving Modes of UPS Operation
 
Calibrated Modeling - How Well Does My Building Perform? by Eveline Killian
Calibrated Modeling - How Well Does My Building Perform? by Eveline KillianCalibrated Modeling - How Well Does My Building Perform? by Eveline Killian
Calibrated Modeling - How Well Does My Building Perform? by Eveline Killian
 
EnergyDeck UK Version
EnergyDeck UK VersionEnergyDeck UK Version
EnergyDeck UK Version
 

Viewers also liked

Hydrogen as an energy carrier
Hydrogen as an energy carrierHydrogen as an energy carrier
Hydrogen as an energy carrierKushal Gurung
 
HYdrogen Fuel Cell Vehicle
HYdrogen Fuel Cell VehicleHYdrogen Fuel Cell Vehicle
HYdrogen Fuel Cell VehicleShubham Dubey
 
a presentation Hydrogen energy by MUKESH RAM
a presentation Hydrogen energy by MUKESH RAMa presentation Hydrogen energy by MUKESH RAM
a presentation Hydrogen energy by MUKESH RAMMukesh Ram
 
Fertilizer Industry of Pakistan
Fertilizer Industry of PakistanFertilizer Industry of Pakistan
Fertilizer Industry of PakistanSaad Afridi
 
Alternative fuel
Alternative fuelAlternative fuel
Alternative fuelNizam Anuar
 
Fuel cells presentation
Fuel cells presentationFuel cells presentation
Fuel cells presentationVaibhav Chavan
 
Hydrogen fuel cells
Hydrogen fuel cellsHydrogen fuel cells
Hydrogen fuel cellsguest0c2139
 

Viewers also liked (11)

Hydrogen as an energy carrier
Hydrogen as an energy carrierHydrogen as an energy carrier
Hydrogen as an energy carrier
 
HYdrogen Fuel Cell Vehicle
HYdrogen Fuel Cell VehicleHYdrogen Fuel Cell Vehicle
HYdrogen Fuel Cell Vehicle
 
Future fuels
Future fuelsFuture fuels
Future fuels
 
Hydrogen energy
Hydrogen energyHydrogen energy
Hydrogen energy
 
a presentation Hydrogen energy by MUKESH RAM
a presentation Hydrogen energy by MUKESH RAMa presentation Hydrogen energy by MUKESH RAM
a presentation Hydrogen energy by MUKESH RAM
 
Fertilizer Industry of Pakistan
Fertilizer Industry of PakistanFertilizer Industry of Pakistan
Fertilizer Industry of Pakistan
 
hydrogen energy fuel for the future
hydrogen energy fuel for the futurehydrogen energy fuel for the future
hydrogen energy fuel for the future
 
Alternative fuel
Alternative fuelAlternative fuel
Alternative fuel
 
Fertiliser ppt
Fertiliser pptFertiliser ppt
Fertiliser ppt
 
Fuel cells presentation
Fuel cells presentationFuel cells presentation
Fuel cells presentation
 
Hydrogen fuel cells
Hydrogen fuel cellsHydrogen fuel cells
Hydrogen fuel cells
 

Similar to Energy managment system-bas v6 final (1)

Contemporary Energy Optimization for Mobile and Cloud Environment
Contemporary Energy Optimization for Mobile and Cloud EnvironmentContemporary Energy Optimization for Mobile and Cloud Environment
Contemporary Energy Optimization for Mobile and Cloud Environmentijceronline
 
CA Nimsoft ecoMeter
CA Nimsoft ecoMeterCA Nimsoft ecoMeter
CA Nimsoft ecoMeterCA Nimsoft
 
Advanced Metering Infrastructure Standards and protocol
Advanced Metering Infrastructure Standards and protocolAdvanced Metering Infrastructure Standards and protocol
Advanced Metering Infrastructure Standards and protocolEklavya Sharma
 
Energy efficient resource allocation in cloud computing
Energy efficient resource allocation in cloud computingEnergy efficient resource allocation in cloud computing
Energy efficient resource allocation in cloud computingDivaynshu Totla
 
ENERGY EFFICIENT COMPUTING FOR SMART PHONES IN CLOUD ASSISTED ENVIRONMENT
ENERGY EFFICIENT COMPUTING FOR SMART PHONES IN CLOUD ASSISTED ENVIRONMENTENERGY EFFICIENT COMPUTING FOR SMART PHONES IN CLOUD ASSISTED ENVIRONMENT
ENERGY EFFICIENT COMPUTING FOR SMART PHONES IN CLOUD ASSISTED ENVIRONMENTIJCNCJournal
 
DESIGN AND IMPLEMENTATION OF A WIRELESS SENSOR AND ACTUATOR NETWORK FOR ENERG...
DESIGN AND IMPLEMENTATION OF A WIRELESS SENSOR AND ACTUATOR NETWORK FOR ENERG...DESIGN AND IMPLEMENTATION OF A WIRELESS SENSOR AND ACTUATOR NETWORK FOR ENERG...
DESIGN AND IMPLEMENTATION OF A WIRELESS SENSOR AND ACTUATOR NETWORK FOR ENERG...ijesajournal
 
Applying Cloud Techniques to Address Complexity in HPC System Integrations
Applying Cloud Techniques to Address Complexity in HPC System IntegrationsApplying Cloud Techniques to Address Complexity in HPC System Integrations
Applying Cloud Techniques to Address Complexity in HPC System Integrationsinside-BigData.com
 
G-SLAM:OPTIMIZING ENERGY EFFIIENCY IN CLOUD
G-SLAM:OPTIMIZING ENERGY EFFIIENCY IN CLOUDG-SLAM:OPTIMIZING ENERGY EFFIIENCY IN CLOUD
G-SLAM:OPTIMIZING ENERGY EFFIIENCY IN CLOUDAlfiya Mahmood
 
Realtime-Online Tenant Billing solution
Realtime-Online Tenant Billing solutionRealtime-Online Tenant Billing solution
Realtime-Online Tenant Billing solutionNigel Dawson
 
Vision and Strategy for India’s Electricity Metering Infrastructure of the fu...
Vision and Strategy for India’s Electricity Metering Infrastructure of the fu...Vision and Strategy for India’s Electricity Metering Infrastructure of the fu...
Vision and Strategy for India’s Electricity Metering Infrastructure of the fu...IJERA Editor
 
Houston's Smart Grid: Transforming the Future of Electric Distribution & Ener...
Houston's Smart Grid: Transforming the Future of Electric Distribution & Ener...Houston's Smart Grid: Transforming the Future of Electric Distribution & Ener...
Houston's Smart Grid: Transforming the Future of Electric Distribution & Ener...aectnet
 
Energy Optimized Link Selection Algorithm for Mobile Cloud Computing
Energy Optimized Link Selection Algorithm for Mobile Cloud ComputingEnergy Optimized Link Selection Algorithm for Mobile Cloud Computing
Energy Optimized Link Selection Algorithm for Mobile Cloud ComputingEswar Publications
 
Implementing Oracle Utility-Meter Data Management For Power Consumption
Implementing Oracle Utility-Meter Data Management For Power ConsumptionImplementing Oracle Utility-Meter Data Management For Power Consumption
Implementing Oracle Utility-Meter Data Management For Power ConsumptionIJERDJOURNAL
 
Sentron datasheet final 042610
Sentron datasheet final 042610Sentron datasheet final 042610
Sentron datasheet final 042610logenatech
 
V1_I2_2012_Paper2.docx
V1_I2_2012_Paper2.docxV1_I2_2012_Paper2.docx
V1_I2_2012_Paper2.docxpraveena06
 
Green Computing - Maturity Model for Virtualization
Green Computing - Maturity Model for VirtualizationGreen Computing - Maturity Model for Virtualization
Green Computing - Maturity Model for Virtualizationijdmtaiir
 
D2.1 definition of reference architecture
D2.1 definition of reference architectureD2.1 definition of reference architecture
D2.1 definition of reference architectureBabak Sorkhpour
 
BSI Smart Grid Technologies Review
BSI Smart Grid Technologies ReviewBSI Smart Grid Technologies Review
BSI Smart Grid Technologies ReviewGerry Locke
 
A Survey on Virtualization Data Centers For Green Cloud Computing
A Survey on Virtualization Data Centers For Green Cloud ComputingA Survey on Virtualization Data Centers For Green Cloud Computing
A Survey on Virtualization Data Centers For Green Cloud ComputingIJTET Journal
 

Similar to Energy managment system-bas v6 final (1) (20)

Contemporary Energy Optimization for Mobile and Cloud Environment
Contemporary Energy Optimization for Mobile and Cloud EnvironmentContemporary Energy Optimization for Mobile and Cloud Environment
Contemporary Energy Optimization for Mobile and Cloud Environment
 
Optergy Q&A
Optergy Q&AOptergy Q&A
Optergy Q&A
 
CA Nimsoft ecoMeter
CA Nimsoft ecoMeterCA Nimsoft ecoMeter
CA Nimsoft ecoMeter
 
Advanced Metering Infrastructure Standards and protocol
Advanced Metering Infrastructure Standards and protocolAdvanced Metering Infrastructure Standards and protocol
Advanced Metering Infrastructure Standards and protocol
 
Energy efficient resource allocation in cloud computing
Energy efficient resource allocation in cloud computingEnergy efficient resource allocation in cloud computing
Energy efficient resource allocation in cloud computing
 
ENERGY EFFICIENT COMPUTING FOR SMART PHONES IN CLOUD ASSISTED ENVIRONMENT
ENERGY EFFICIENT COMPUTING FOR SMART PHONES IN CLOUD ASSISTED ENVIRONMENTENERGY EFFICIENT COMPUTING FOR SMART PHONES IN CLOUD ASSISTED ENVIRONMENT
ENERGY EFFICIENT COMPUTING FOR SMART PHONES IN CLOUD ASSISTED ENVIRONMENT
 
DESIGN AND IMPLEMENTATION OF A WIRELESS SENSOR AND ACTUATOR NETWORK FOR ENERG...
DESIGN AND IMPLEMENTATION OF A WIRELESS SENSOR AND ACTUATOR NETWORK FOR ENERG...DESIGN AND IMPLEMENTATION OF A WIRELESS SENSOR AND ACTUATOR NETWORK FOR ENERG...
DESIGN AND IMPLEMENTATION OF A WIRELESS SENSOR AND ACTUATOR NETWORK FOR ENERG...
 
Applying Cloud Techniques to Address Complexity in HPC System Integrations
Applying Cloud Techniques to Address Complexity in HPC System IntegrationsApplying Cloud Techniques to Address Complexity in HPC System Integrations
Applying Cloud Techniques to Address Complexity in HPC System Integrations
 
G-SLAM:OPTIMIZING ENERGY EFFIIENCY IN CLOUD
G-SLAM:OPTIMIZING ENERGY EFFIIENCY IN CLOUDG-SLAM:OPTIMIZING ENERGY EFFIIENCY IN CLOUD
G-SLAM:OPTIMIZING ENERGY EFFIIENCY IN CLOUD
 
Realtime-Online Tenant Billing solution
Realtime-Online Tenant Billing solutionRealtime-Online Tenant Billing solution
Realtime-Online Tenant Billing solution
 
Vision and Strategy for India’s Electricity Metering Infrastructure of the fu...
Vision and Strategy for India’s Electricity Metering Infrastructure of the fu...Vision and Strategy for India’s Electricity Metering Infrastructure of the fu...
Vision and Strategy for India’s Electricity Metering Infrastructure of the fu...
 
Houston's Smart Grid: Transforming the Future of Electric Distribution & Ener...
Houston's Smart Grid: Transforming the Future of Electric Distribution & Ener...Houston's Smart Grid: Transforming the Future of Electric Distribution & Ener...
Houston's Smart Grid: Transforming the Future of Electric Distribution & Ener...
 
Energy Optimized Link Selection Algorithm for Mobile Cloud Computing
Energy Optimized Link Selection Algorithm for Mobile Cloud ComputingEnergy Optimized Link Selection Algorithm for Mobile Cloud Computing
Energy Optimized Link Selection Algorithm for Mobile Cloud Computing
 
Implementing Oracle Utility-Meter Data Management For Power Consumption
Implementing Oracle Utility-Meter Data Management For Power ConsumptionImplementing Oracle Utility-Meter Data Management For Power Consumption
Implementing Oracle Utility-Meter Data Management For Power Consumption
 
Sentron datasheet final 042610
Sentron datasheet final 042610Sentron datasheet final 042610
Sentron datasheet final 042610
 
V1_I2_2012_Paper2.docx
V1_I2_2012_Paper2.docxV1_I2_2012_Paper2.docx
V1_I2_2012_Paper2.docx
 
Green Computing - Maturity Model for Virtualization
Green Computing - Maturity Model for VirtualizationGreen Computing - Maturity Model for Virtualization
Green Computing - Maturity Model for Virtualization
 
D2.1 definition of reference architecture
D2.1 definition of reference architectureD2.1 definition of reference architecture
D2.1 definition of reference architecture
 
BSI Smart Grid Technologies Review
BSI Smart Grid Technologies ReviewBSI Smart Grid Technologies Review
BSI Smart Grid Technologies Review
 
A Survey on Virtualization Data Centers For Green Cloud Computing
A Survey on Virtualization Data Centers For Green Cloud ComputingA Survey on Virtualization Data Centers For Green Cloud Computing
A Survey on Virtualization Data Centers For Green Cloud Computing
 

Energy managment system-bas v6 final (1)

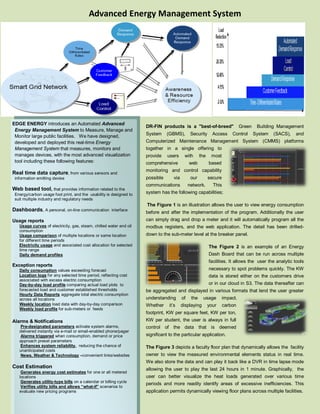
  • 1. Advanced Energy Management System EDGE ENERGY introduces an Automated Advanced DR-FIN products is a "best-of-breed" Green Building Management Energy Management System to Measure, Manage and Monitor large public facilities. We have designed, System (GBMS), Security Access Control System (SACS), and developed and deployed this real-time Energy Computerized Maintenance Management System (CMMS) platforms Management System that measures, monitors and together in a single offering to manages devices, with the most advanced visualization provide users with the most tool including these following features: comprehensive web based monitoring and control capability Real time data capture, from various sensors and information emitting devise possible via our secure communications network. This Web based tool, that provides information related to the Energy/carbon usage foot print, and the usability is designed to system has the following capabilities; suit multiple industry and regulatory needs The Figure 1 is an illustration allows the user to view energy consumption Dashboards, A personal, on-line communication interface before and after the implementation of the program. Additionally the user Usage reports can simply drag and drop a meter and it will automatically program all the Usage curves of electricity, gas, steam, chilled water and oil modbus registers, and the web application. The detail has been drilled- consumption Usage comparison of multiple locations or same location down to the sub-meter level at the breaker panel. for different time periods Electricity usage and associated cost allocation for selected The Figure 2 is an example of an Energy time range Daily demand profiles Dash Board that can be run across multiple facilities. It allows the user the analytic tools Exception reports Daily consumption values exceeding forecast necessary to spot problems quickly. The KW Location logs for any selected time period, reflecting cost data is stored either on the customers drive associated with excess electric consumption Day-by-day load profile comparing actual load plots to or in our cloud in S3. The data thereafter can forecasted load and customer established thresholds be aggregated and displayed in various formats that lend the user greater Hourly Data Reports aggregate total electric consumption across all locations understanding of the usage impact. Weekly location load data with day-by-day comparison Whether it’s displaying your carbon Weekly load profile for sub-meters or feeds footprint, KW per square feet, KW per ton, Alarms & Notifications KW per student, the user is always in full Pre-designated parameters activate system alarms, control of the data that is deemed delivered instantly via e-mail or email-enabled phone/pager Alarms triggered when consumption, demand or price significant to the particular application. approach preset parameters Enhances system reliability, reducing the chance of The Figure 3 depicts a faculty floor plan that dynamically allows the facility unanticipated costs News, Weather & Technology –convenient links/websites owner to view the measured environmental elements status in real time. We also store the data and can play it back like a DVR in time lapse mode Cost Estimation allowing the user to play the last 24 hours in 1 minute. Graphically, the Generates energy cost estimates for one or all metered locations user can better visualize the heat loads generated over various time Generates utility-type bills on a calendar or billing cycle periods and more readily identify areas of excessive inefficiencies. This Verifies utility bills and allows “what-if” scenarios to evaluate new pricing programs application permits dynamically viewing floor plans across multiple facilities.
  • 2. When it comes to peak demand & demand response/ management Advanced Energy Management System Large CNI • it is not the residential sector Residential • largest peak energy consuming building sector is Medium CNI commercial & public buildings /facilities Small CNI The figure 4 provides the user with an intuitive reading of the carbon impact created within a single area or multiple areas as a point of energy efficiency reference. The X-Y axis plot the gas and electrical consumption, the color coded designation of the graphic ranks the area based on past performance and the size of the graphic depicts the carbon emission. Imagine the immediate insight that a four dimensional reading across the various areas of a single building or multiple buildings could bring to bear on the system inefficiencies inherent in every structure. The shading of the graphic is moderated in real time which allows the user to readily discern micro trends as well as longer time frames. Figure 5 shows how one can graphically demonstrate a real time metering system with the auto programming feature based upon our BOG- O-Matic software. Identifying energy waste over the breadth of all the user facilities allows the user to address the issues of greatest priority in terms of real-time performance. Imagine the regional or even global efficiencies that can accrue to the user when the individual facilities are displayed comparatively with respect to their carbon impact. Below the largest level of carbon emission is shown in red and the magnitude of gas usage relates to the sizing of the rectangle. Whether locally or globally, as shown below, the J2 framework is interoperable, connects data from multiple server sites for the purpose of data analysis or demand response. This same framework can be applied to individual buildings, faculties, regions, and or any other data set of significance to the user. Image Slicer is an application that we built that allows Building Automation Companies to build their own graphics through the web. This same tool can be utilized to customize the way you look and analyze energy data and are of particular value in establishing and monitoring energy budgets. This screen shots demonstrate the software’s capability to not only display energy efficiencies but more importantly initiate demand shed measures based on user set points. System generated email, text message or voice calls are automatically launched when thresholds established by the user are violated. (i.e., the logic could activate a 10% shed when 90% of peak KW allowance is exceeded) The possibilities for monitoring and affirmative action are unlimited. Based on interactions with our customers, there are three main components to DR that will make it attractive to building and facility owners and operators: First, the implementation must save them money. Customers will not be attracted to high up-front costs, long payback periods or limited savings opportunities. Second, it must be convenient and easy to implement. DR-FIN integrates with any building operating system, thus significantly simplifying the process - price signals trigger automated responses from buildings based on preset rules to adjust energy consumption and environmental conditions accordingly. Finally, customers want to be the ultimate decision maker when it comes to their energy consumption. Depending on specific circumstances, building operators may or may not want to participate in DR events, and it is important that they maintain the option to opt out.
  • 3. Advanced Energy Management System Up-front technology costs for DR-FIN program participation are attractive. The DR-FIN based automated DR program has a relatively low capital cost and short payback period associated with these programs. The DR-FIN allows the customer to reach its full load shed capacity without the need for additional building operations resources. Our R&D and industry experience focused on the ease of use and full integration with existing systems, as convenience is an important factor in gaining full advantage of this program. Consumers will not effectively participate and respond to price signals if information is difficult to access and implementation is time-consuming. Our objective is ensuring larger participation leading to a much larger load shed and provides the utility a near-real-time visibility to the program as it happens. Intuitively, this makes sense because customers are not always able to respond to price signals and may not track them closely. The DR-FIN, on the other hand, facilitates rapid, consistent load shed responses from customers based on rate / tariff signals from the utility. The majority of the implementations have been centrally dispatched by the utility with minimal customer input. This scenario has limited appeal to most commercial building owners since they lose control of their building. A better way is to incentivize these customers to shift load by a more structured and organized manner, by publishing day ahead forecasted energy prices and real-time energy prices. The DR-FIN product has built in rule based analytic capability that can be pre-configured by the customer to decide what loads should be shed based upon its intrinsic value to the particular customer VS the price/rate offered by the utility. We can handle any data formats and signals; also can aggregate the real-time usage from the AMI system to show the impact of the any such program. So how does the DR-FIN really work? On any hot summer afternoon, air conditioners start working harder. Wholesale power prices skyrocket and distribution lines become overburdened due to the peak load on the grid. We experience such scenarios within every utility. As the scenario develops, the DR-FIN will allow utilities to pass a price signal to handle such conditions— whether it is a curtailment incentive or a real time price. Let’s assume the peak hour prices could be 10x the average off-peak rate, and smart meters and Automatic Metering Infrastructure will enable these types of rate structures to be passed on the DR-FIN or through a dedicated GPRS/GSM network. The DR-FIN receives that price signal—from the web or from the smart meter and provides the control capability to do a number of things in response. Information and alerts sent to building managers and occupants make them aware of such conditions. You can adjust the set points for space temperature or chilled water temperature. The DR-FIN integrates with any building control system. It ensures and activates its’ control over fan power that we saved by reducing lift on the chiller, or by reduced plug-loads and/or using advanced light ballasts which can dim and/or turn off unwanted lights. It can even integrate with the roof-top PV or other alternative energy source to switch over and avoid the peak-rate and gain higher ROI including the benefits of the renewable energy investment. If you are a utility, a facility manager or owner, this system will help you save energy, reduce carbon, increase your green footprint, and reduce energy costs.
  • 4. Advanced Energy Management System Representative Client list: CONTACT: Prakash Menon: (818) 522 9115 - prakash.menon@wns.com Tim Owens: (602) 526 7698 - tim@edgeenergyllc.com