Downloaded 172 times

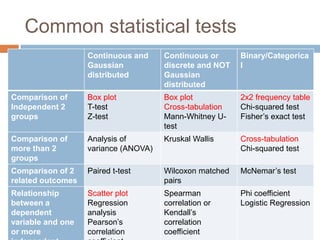
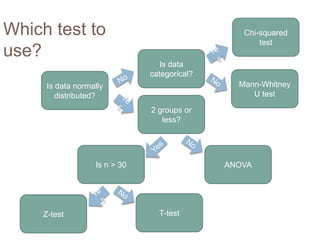
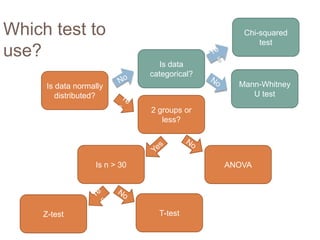
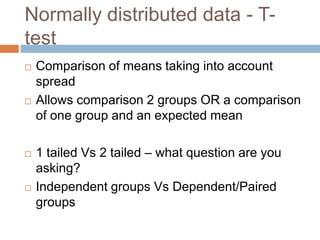
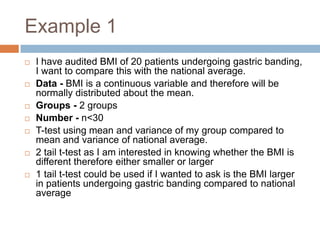
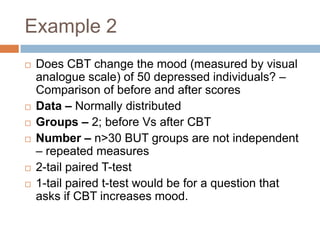
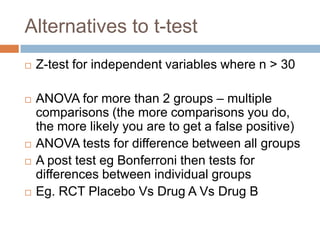
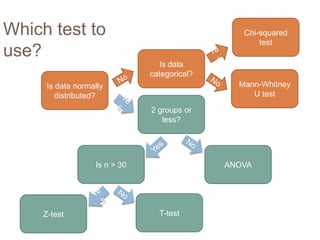
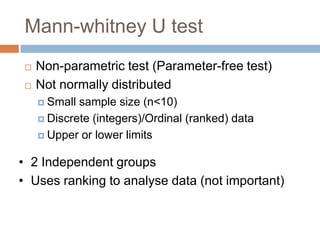
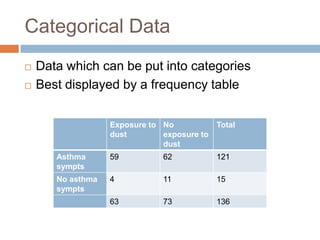
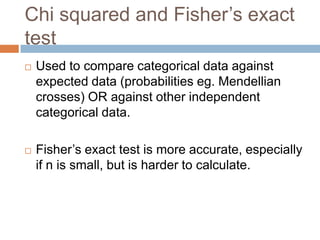

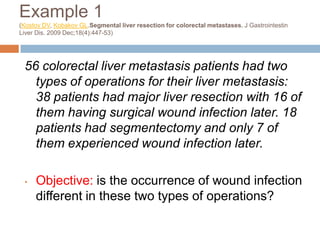
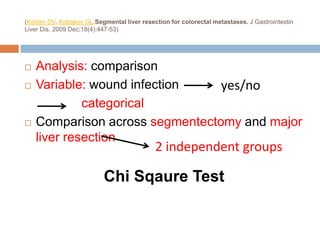
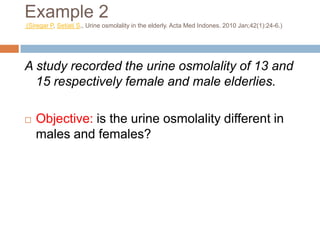
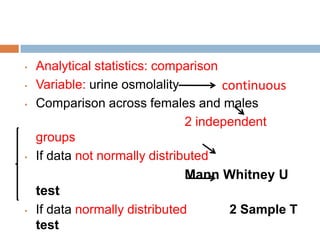


The document discusses various statistical tests that can be used to analyze different types of data, including: - The t-test and z-test for comparing means of normally distributed continuous data between two groups. - The chi-squared test and Fisher's exact test for comparing categorical data between groups. - The Mann-Whitney U test for comparing non-normally distributed or ordinal data between two independent groups. - ANOVA for comparing means between three or more groups, followed by post-hoc tests for individual group comparisons. Examples are provided to demonstrate how to select the appropriate test based on the data type and study design.