The Development of the Biostatistics & Clinical Epideimiolgy Skills (BACES) Assessment for Medical Residents
•
2 likes•754 views

A poster based on my dissertation work developing a new biostatistics and clinical epidemiology skills self-assessment for medical residents. I used an Item Response Theory (IRT) approach to gather preliminary data on 30 multiple choice items that will eventually turn into an online self-assessment module for residents looking to hone their skills in these critical areas. The article is currently under review in Medical Teach, and I am looking for more sites / collaborators for expanding the instrument. Email if you're interested!
Recommended

Recommended
More Related Content
What's hot
What's hot (20)
Viewers also liked
Viewers also liked (20)
Similar to The Development of the Biostatistics & Clinical Epideimiolgy Skills (BACES) Assessment for Medical Residents
Similar to The Development of the Biostatistics & Clinical Epideimiolgy Skills (BACES) Assessment for Medical Residents (20)
More from Pat Barlow
More from Pat Barlow (8)
Recently uploaded
Recently uploaded (20)
The Development of the Biostatistics & Clinical Epideimiolgy Skills (BACES) Assessment for Medical Residents
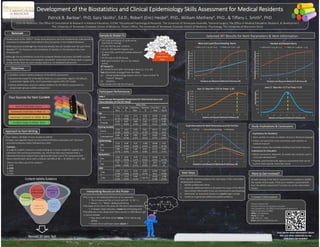
- 1. Development of the Biostatistics and Clinical Epidemiology Skills Assessment for Medical Residents Patrick B. Barlow1, PhD, Gary Skolits2, Ed.D., Robert (Eric) Heidel3, PhD., William Metheny4, PhD., & Tiffany L. Smith5, PhD 1Internal Medicine, The Office of Consultation & Research in Medical Education, CCOM; 2Educational Psychology & Research, The University of Tennessee‐Knoxville; 3General Surgery, The Office of Medical Education, Research, & Development, The University of Tennessee Graduate School of Medicine; 4Dean’s Office, The University of Tennessee Graduate School of Medicine; 5Psychology, The University of Wisconsin‐Stout Rationale • Studies back to the 1980’s1,2 show many physicians lack the fundamental understanding necessary to adequately read statistics they encounter in the medical literature. • While physician knowledge has remained steadily low yet variable over the past three decades3,4,5, the frequency and complexity of statistics in the literature has risen dramatically6,7. • Although the Accreditation Council for Graduate Medical Education (ACGME) includes these topics within their core program standards8, assessment of these topics is sparse and generally done on a per‐campus basis (i.e. no validated instrument). Objectives 1.Establish content validity evidence of the BACES assessment 2.Examine the model fit of the BACES items to a 1‐parameter logistic (1PL)/Rasch, 2‐parameter logistic (2PL), and 3‐parameter logistic (3PL) IRT model 3.Gather preliminary construct validity evidence for the BACES assessment by using known‐groups validity comparisons Interpreting Results on this Poster •The X‐Axis is the ability/proficiency of an examinee • This is measured like a Z‐score with M = 0, SD = 1 • Values > 0 = “More” ability/proficiency •The slope of the line is the value for the item’s discrimination. • A steeper slope indicates a more discriminating item •The difficulty is the ability level that a person is 50% likely to get a correct answer. • Easy items will have values below 0 (i.e. below avg. ability) • Harder items will have values above 0 Four Sources for Item Content Our UT GSM Stats Course Commonly Used Stats in Med. Lit. Common Content in Other Tests Content Gaps in Other Tests Approach to Item Writing •Four Option, Multiple Choice Questions (MCQ) •Unique case vignette based on real medical literature examples and “common” procedures/disease states followed by a stem. Content Validity Evidence . Medicine & GME Gen.eral Surgery Pharmacy Education Public Health, Epidemiology Higher Ed. Assessment Revised 30‐Item Test BACES Assessment Data Sample & Model Fit • 147 total participants (3 could not be matched for scoring) • 53 (36.1%) first‐year residents. • 102 (76.7%) had MD degrees only • 17 were DOs, and 8 had multiple advanced degrees • 59.3% male to 40.0% female • 80% were trained in the U.S. for medical school IRT Model Fit 2PL model fit best after removing 4 items (2, 3, 6, 20) Two dimensions emerged from the data: (1) Clinical Epidemiology (topics such as “Case‐Control” & “Cohort” designs) (2) Statistics (See handout for full list of topics) Selected IRT Results for Item Parameters & Item Information 1 0.9 0.8 0.7 0.6 0.5 0.4 0.3 0.2 0.1 0 Most and Least Discriminating Items Item 27 A = 1.51, B = 0.03 Item 4 A = 0, B = 1.96 ‐3 ‐2 ‐1 0 1 2 3 Probability of a Correct Response Statistics and Research Methods Proficiency (θ) 1 0.9 0.8 0.7 0.6 0.5 0.4 0.3 0.2 0.1 0 Hardest and Easiest Items Item 16 A = 0.74, B = 2.9 Item 7 A = 0.68, B = ‐2.29 ‐3 ‐2 ‐1 0 1 2 3 Probability of a Correct Response Statistics and Research Methods Proficiency (θ) Participant Performance Table 1 Known‐Groups Demographic Comparisons for Total‐Correct Score and Theta Estimates of Final 2PL Model Variable Mean (SD) C. Epi. Raw C. Epi. θ Statistics Raw Statistics θ Full Test Raw Full Test θ Sex Male 5.71 (2.72) ‐0.04 (0.88) 4.71 (2.12) ‐0.05 (0.7) 10.43 (4.07) ‐0.06 (0.88) Female 6.26 (2.51) 0.07 (0.83) 4.89 (2.42) 0.05 (0.81) 11.15 (4.11) 0.08 (0.89) Training Location U.S.A 5.79 (2.69) ‐0.04 (0.85) 4.92 (2.31) 0.01 (0.76) 10.71 (4.22) ‐0.02 (0.9) International 6.04 (2.95) 0.04 (0.96) 4.83 (1.87) 0.07 (0.62) 10.87 (3.97) 0.06 (0.87) Epidemiology No 6.13 (2.65) 0.08 (0.84) 4.55 (2.04) ‐0.08 (0.67) 10.68 (3.62) 0.01 (0.78) Yes 5.86 (2.53) ‐0.04 (0.85) 5.25 (2.54) 0.13 (0.85) 11.12 (4.72) 0.04 (1.01) Biostatistics No 6.18 (2.63) 0.09 (0.85) 4.39 (1.97) ‐0.11 (0.66) 10.58 (3.61) 0 (0.79) Yes 5.6 (2.64) ‐0.11 (0.86) 5.29 (2.47) 0.12 (0.82) 10.9 (4.67) ‐0.02 (1) EBM No 6.26 (2.58) 0.11 (0.84) 4.75 (2.23) ‐0.01 (0.74) 11.01 (4.1) 0.07 (0.88) Yes 5.52 (2.64) ‐0.12 (0.85) 4.84 (2.31) 0 (0.77) 10.36 (4.08) ‐0.08 (0.88) Example… A surgical resident conducts a study looking at a mouse model for surgical site infections (SSI) and local anesthetic use. She finds that mice injected with a lidocaine/marcaine mixture had a significantly lower risk of SSI compared with those injected with saline with a relative risk (RR) of RR = .45 (95% CI = .25 ‐ .89). What is the effect size of her analysis? a. 45% b. 55% c. 64% d. 95% 0.08 0.07 0.06 0.05 0.04 0.03 0.02 0.01 0 Item 13 Max Info = 0.07 at Theta = 2.65 ‐4 ‐3 ‐2 ‐1 0 1 2 3 4 Item Information Statistics and Research Methods Proficiency (θ) 0.6 0.5 0.4 0.3 0.2 0.1 0 Item 27 Max Info = 0.57 at Theta = 0.05 ‐4 ‐3 ‐2 ‐1 0 1 2 3 4 Item Information Statistics and Research Methods Proficiency (θ) 3.5 3 2.5 2 1.5 1 0.5 0 Total Information for Both Dimensions and the Full Test Full Test Clinical Epidemiology Statistics ‐4 ‐3 ‐2 ‐1 0 1 2 3 4 Test Information Statistics and Research Methods Proficiency (θ) ܲ݅ߠ ൌ ϕ ߠ െ ܾ݅ ߪ݅ Study Implications & Conclusions Implications for Residents • Items written to mimic a realistic clinical or literature example • Pulled concepts from most commonly used statistics in medical research • Detailed answer key provides feedback and study resource Implications for Educators • BACES instrument, blueprint, & answer key could be used in curricular development • Flexible, psychometrically rigorous assessment that can be used to meet specific instructor needs Want to Get Involved? Broader testing of the BACES assessment is needed to solidify the results of this study. Think your residents would benefit from the BACES assessment? Contact me at the information below! Next Steps •Four Specific recommendations for next steps in this instrument development process 1. Modify problematic items 2. Generate additional items to broaden the scope of the BACES (see contact information if you are interested in participating) 3. Administer an improved version to a much larger sample 4. Continue to generate additional validity evidence. Contact Information Patrick B. Barlow, PhD Assistant Professor & Evaluation Consultant Internal Medicine, The Office of Consultation & Research in Medical Education (OCRME) Office: 5153 Westlawn Phone: Ext. 4291 Cell: (763) 227 – 4585 Email: patrick‐barlow@uiowa.edu Scan me for more information about this and other resources on my Slideshare.net website!