—Dr. V. Singh,PhD
FACTOR ANALYSIS- II
Key Terminology & Steps
2.
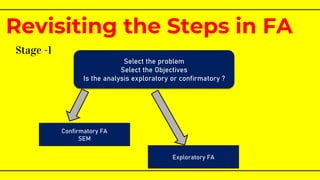
Stage -1
Revisiting theSteps in FA
Select the problem
Select the Objectives
Is the analysis exploratory or confirmatory ?
Confirmatory FA
SEM
Exploratory FA
3.
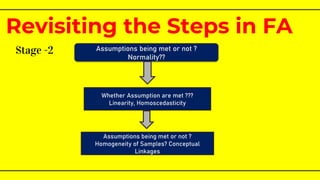
Stage -2
Revisiting theSteps in FA
Assumptions being met or not ?
Normality??
Whether Assumption are met ???
Linearity, Homoscedasticity
Assumptions being met or not ?
Homogeneity of Samples? Conceptual
Linkages
4.
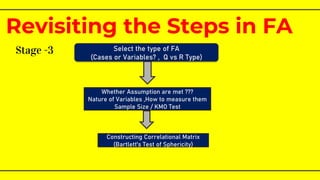
Stage -3
Revisiting theSteps in FA
Select the type of FA
(Cases or Variables? , Q vs R Type)
Whether Assumption are met ???
Nature of Variables ,How to measure them
Sample Size / KMO Test
Constructing Correlational Matrix
(Bartlett's Test of Sphericity)
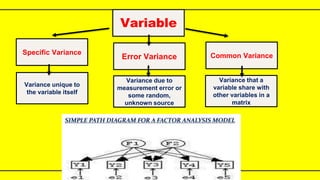
Variable
Specific Variance
Error VarianceCommon Variance
Variance unique to
the variable itself
Variance due to
measurement error or
some random,
unknown source
Variance that a
variable share with
other variables in a
matrix
7.
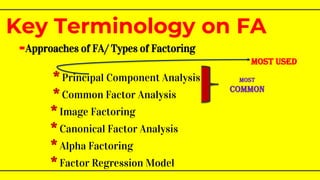
-Approaches of FA/Types of Factoring
* Principal Component Analysis
* Common Factor Analysis
* Image Factoring
* Canonical Factor Analysis
* Alpha Factoring
* Factor Regression Model
Key Terminology on FA
Most
Common
Most USED
8.
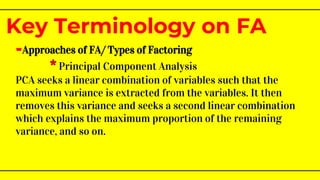
-Approaches of FA/Types of Factoring
* Principal Component Analysis
PCA seeks a linear combination of variables such that the
maximum variance is extracted from the variables. It then
removes this variance and seeks a second linear combination
which explains the maximum proportion of the remaining
variance, and so on.
Key Terminology on FA
9.
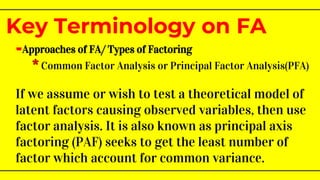
-Approaches of FA/Types of Factoring
* Common Factor Analysis or Principal Factor Analysis(PFA)
If we assume or wish to test a theoretical model of
latent factors causing observed variables, then use
factor analysis. It is also known as principal axis
factoring (PAF) seeks to get the least number of
factor which account for common variance.
Key Terminology on FA
10.
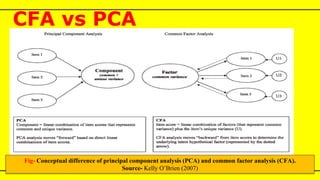
CFA vs PCA
Fig-Conceptual difference of principal component analysis (PCA) and common factor analysis (CFA).
Source- Kelly O’Brien (2007)
11.
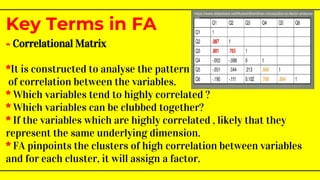
- Correlational Matrix
*Itis constructed to analyse the pattern
of correlation between the variables.
* Which variables tend to highly correlated ?
* Which variables can be clubbed together?
* If the variables which are highly correlated , likely that they
represent the same underlying dimension.
* FA pinpoints the clusters of high correlation between variables
and for each cluster, it will assign a factor.
Key Terms in FA
https://www.slideshare.net/MukeshBisht9/an-introduction-to-factor-analysis-
ppt
12.
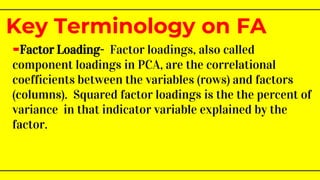
-Factor Loading- Factorloadings, also called
component loadings in PCA, are the correlational
coefficients between the variables (rows) and factors
(columns). Squared factor loadings is the the percent of
variance in that indicator variable explained by the
factor.
Key Terminology on FA
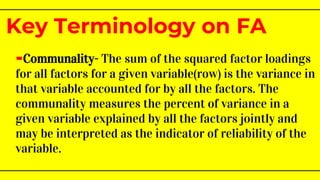
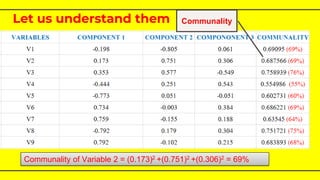
-Communality- The sumof the squared factor loadings
for all factors for a given variable(row) is the variance in
that variable accounted for by all the factors. The
communality measures the percent of variance in a
given variable explained by all the factors jointly and
may be interpreted as the indicator of reliability of the
variable.
Key Terminology on FA
15.
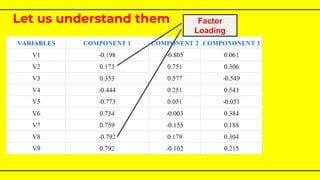
Let us understandthem
Communality of Variable 2 = (0.173)2 +(0.751)2 +(0.306)2 = 69%
Communality
16.
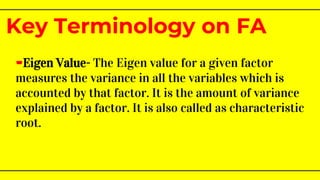
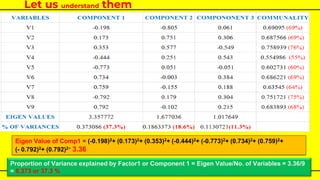
-Eigen Value- TheEigen value for a given factor
measures the variance in all the variables which is
accounted by that factor. It is the amount of variance
explained by a factor. It is also called as characteristic
root.
Key Terminology on FA
17.
Let us understandthem
Eigen Value of Comp1 = (-0.198)2+ (0.173)2+ (0.353)2+ (-0.444)2+ (-0.773)2+ (0.734)2+ (0.759)2+
(- 0.792)2+ (0.792)2= 3.36
Proportion of Variance explained by Factor1 or Component 1 = Eigen Value/No. of Variables = 3.36/9
= 0.373 or 37.3 %
18.
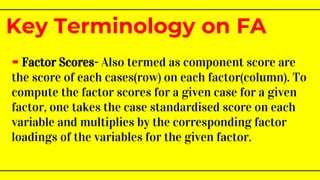
- Factor Scores-Also termed as component score are
the score of each cases(row) on each factor(column). To
compute the factor scores for a given case for a given
factor, one takes the case standardised score on each
variable and multiplies by the corresponding factor
loadings of the variables for the given factor.
Key Terminology on FA
19.
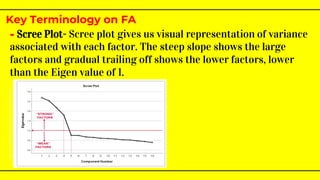
- Scree Plot-Scree plot gives us visual representation of variance
associated with each factor. The steep slope shows the large
factors and gradual trailing off shows the lower factors, lower
than the Eigen value of 1.
Key Terminology on FA
https://www.spss-tutorials.com/spss-factor-analysis-tutorial/
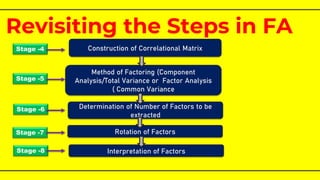
Revisiting the Stepsin FA
Construction of Correlational Matrix
Method of Factoring (Component
Analysis/Total Variance or Factor Analysis
( Common Variance
Determination of Number of Factors to be
extracted
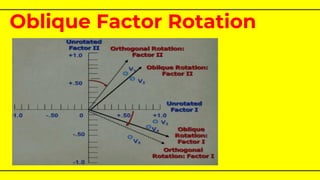
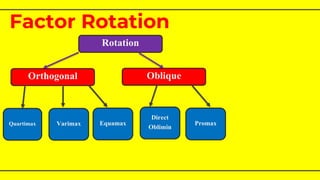
Rotation of Factors
Interpretation of Factors
Stage -4
Stage -5
Stage -6
Stage -7
Stage -8
25.
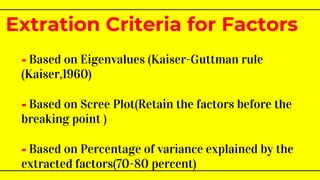
- Based onEigenvalues (Kaiser-Guttman rule
(Kaiser,1960)
- Based on Scree Plot(Retain the factors before the
breaking point )
- Based on Percentage of variance explained by the
extracted factors(70-80 percent)
Extration Criteria for Factors
26.
It is thefinal step of exploratory factor
analysis. Here try to name each factor on
the basis of the variables or items and
their amount of factor loading on the
said factor
Factor Interpretation
27.
- Factor analysishas got multiple uses while
tool construction as well as in identifying the
latent factors working among variables.
- Working with Practical problems makes the
process easier to understand .
- Using SPSS and R packages helps in doing FA
and understand them in better way.
Conclusion