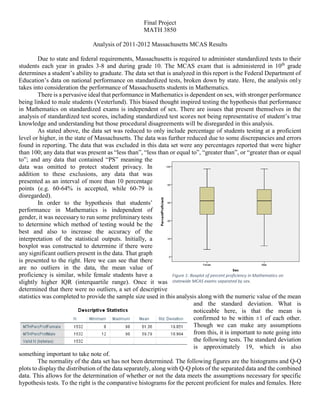
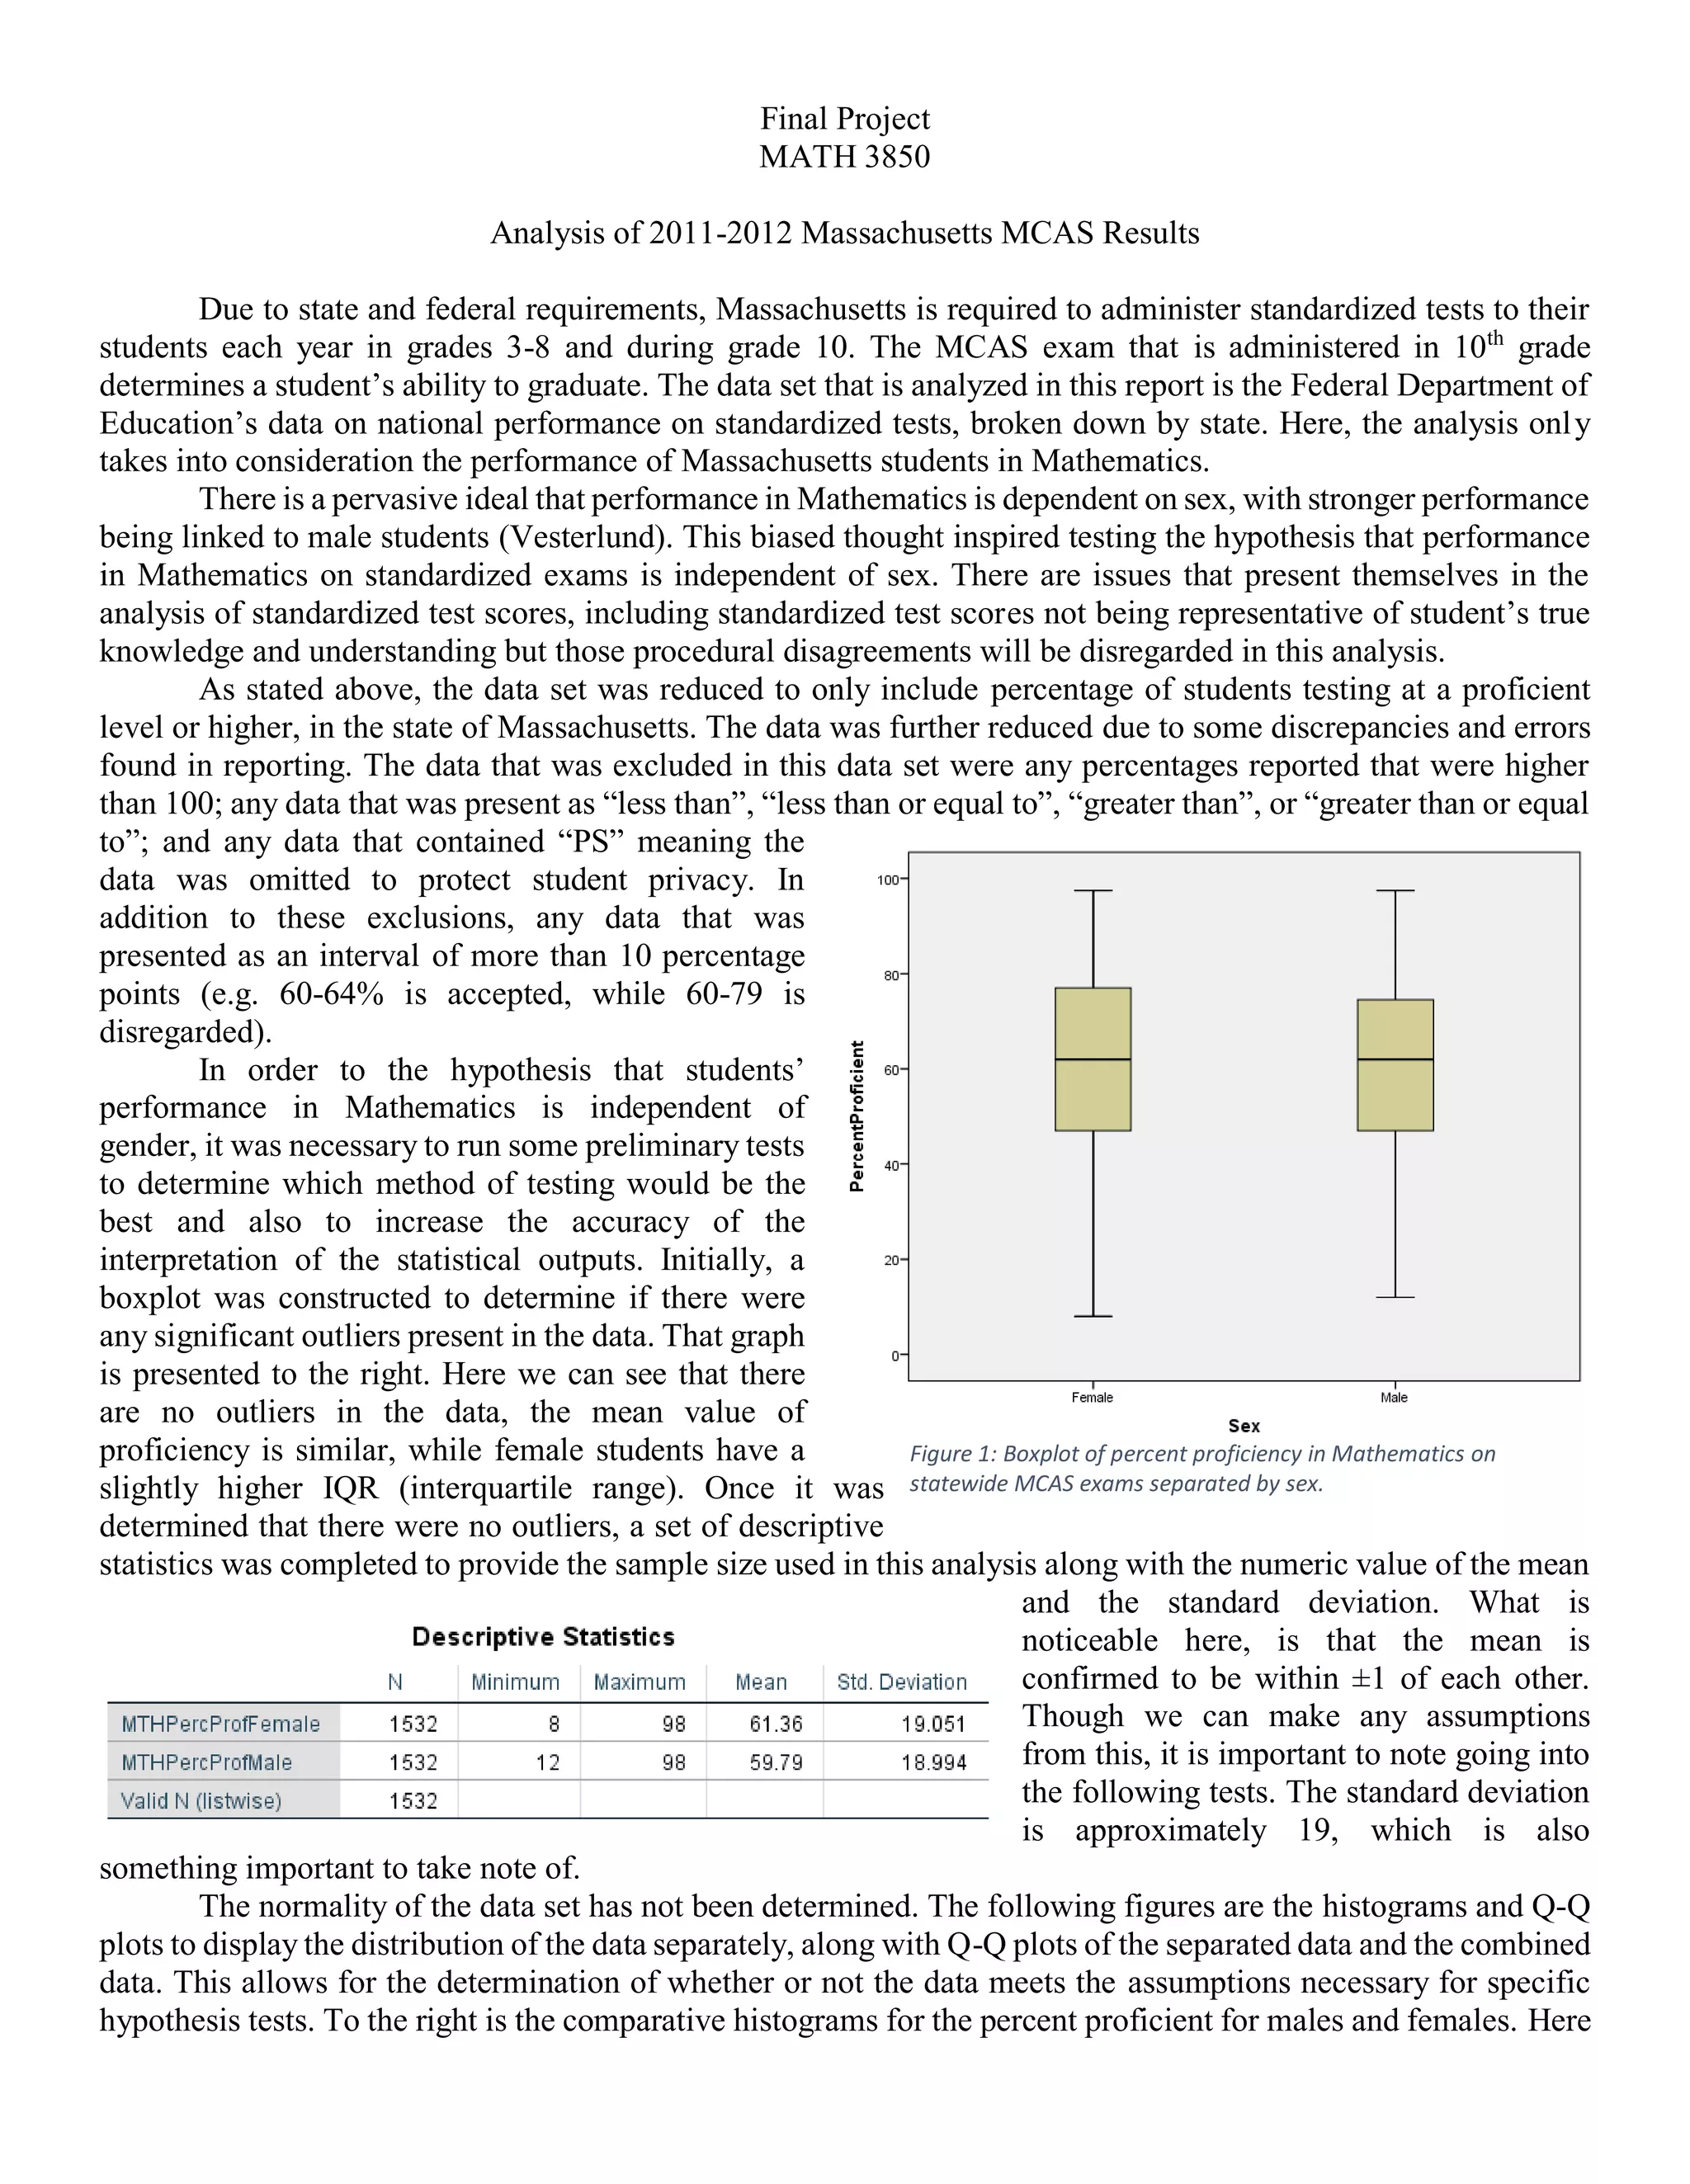
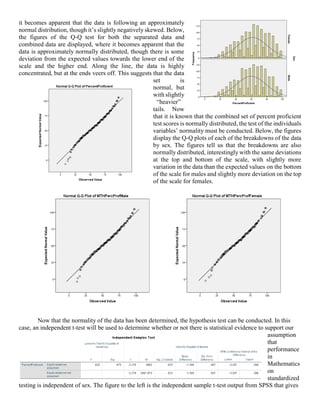
Final Project
MATH 3850
Analysis of 2011-2012 Massachusetts MCAS Results
Due to state and federal requirements, Massachusetts is required to administer standardized tests to their
students each year in grades 3-8 and during grade 10. The MCAS exam that is administered in 10th
grade
determines a student’s ability to graduate. The data set that is analyzed in this report is the Federal Department of
Education’s data on national performance on standardized tests, broken down by state. Here, the analysis only
takes into consideration the performance of Massachusetts students in Mathematics.
There is a pervasive ideal that performance in Mathematics is dependent on sex, with stronger performance
being linked to male students (Vesterlund). This biased thought inspired testing the hypothesis that performance
in Mathematics on standardized exams is independent of sex. There are issues that present themselves in the
analysis of standardized test scores, including standardized test scores not being representative of student’s true
knowledge and understanding but those procedural disagreements will be disregarded in this analysis.
As stated above, the data set was reduced to only include percentage of students testing at a proficient
level or higher, in the state of Massachusetts. The data was further reduced due to some discrepancies and errors
found in reporting. The data that was excluded in this data set were any percentages reported that were higher
than 100; any data that was present as “less than”, “less than or equal to”, “greater than”, or “greater than or equal
to”; and any data that contained “PS” meaning the
data was omitted to protect student privacy. In
addition to these exclusions, any data that was
presented as an interval of more than 10 percentage
points (e.g. 60-64% is accepted, while 60-79 is
disregarded).
In order to the hypothesis that students’
performance in Mathematics is independent of
gender, it was necessary to run some preliminary tests
to determine which method of testing would be the
best and also to increase the accuracy of the
interpretation of the statistical outputs. Initially, a
boxplot was constructed to determine if there were
any significant outliers present in the data. That graph
is presented to the right. Here we can see that there
are no outliers in the data, the mean value of
proficiency is similar, while female students have a
slightly higher IQR (interquartile range). Once it was
determined that there were no outliers, a set of descriptive
statistics was completed to provide the sample size used in this analysis along with the numeric value of the mean
and the standard deviation. What is
noticeable here, is that the mean is
confirmed to be within ±1 of each other.
Though we can make any assumptions
from this, it is important to note going into
the following tests. The standard deviation
is approximately 19, which is also
something important to take note of.
The normality of the data set has not been determined. The following figures are the histograms and Q-Q
plots to display the distribution of the data separately, along with Q-Q plots of the separated data and the combined
data. This allows for the determination of whether or not the data meets the assumptions necessary for specific
hypothesis tests. To the right is the comparative histograms for the percent proficient for males and females. Here
Figure 1: Boxplot of percent proficiency in Mathematics on
statewide MCAS exams separated by sex.
it becomes apparent that the data is following an approximately
normal distribution, though it’s slightly negatively skewed. Below,
the figures of the Q-Q test for both the separated data and
combined data are displayed, where it becomes apparent that the
data is approximately normally distributed, though there is some
deviation from the expected values towards the lower end of the
scale and the higher end. Along the line, the data is highly
concentrated, but at the ends veers off. This suggests that the data
set is
normal, but
with slightly
“heavier”
tails. Now
that it is known that the combined set of percent proficient
test scores is normally distributed, the test of the individuals
variables’ normality must be conducted. Below, the figures
display the Q-Q plots of each of the breakdowns of the data
by sex. The figures tell us that the breakdowns are also
normally distributed, interestingly with the same deviations
at the top and bottom of the scale, with slightly more
variation in the data than the expected values on the bottom
of the scale for males and slightly more deviation on the top
of the scale for females.
Now that the normality of the data has been determined, the hypothesis test can be conducted. In this
case, an independent t-test will be used to determine whether or not there is statistical evidence to support our
assumption
that
performance
in
Mathematics
on
standardized
testing is independent of sex. The figure to the left is the independent sample t-test output from SPSS that gives
the basis for the statistical evidence to make the conclusions from this data. Here, the test was run at a 95%
confidence level. This means that the significance α=0.05. Since p<α, there is statistically significant evidence
to conclude that the null hypothesis is valid. The confidence interval determined by SPSS is (-3.34, 0.206). The
confirms the suspicion that performance in Mathematics is independent of sex and that female students can be
just as successful as male peers.
References
Vesterlund, Neiderle and. "Explaining the Gender Gap in Math Test Scores: The Role of Competition." Journal of
Economic Perspectives (2010): 129-144. Online Journal. <http://web.stanford.edu/~niederle/NV.JEP.pdf>.

Final Project

  • 1.
    Final Project MATH 3850 Analysisof 2011-2012 Massachusetts MCAS Results Due to state and federal requirements, Massachusetts is required to administer standardized tests to their students each year in grades 3-8 and during grade 10. The MCAS exam that is administered in 10th grade determines a student’s ability to graduate. The data set that is analyzed in this report is the Federal Department of Education’s data on national performance on standardized tests, broken down by state. Here, the analysis only takes into consideration the performance of Massachusetts students in Mathematics. There is a pervasive ideal that performance in Mathematics is dependent on sex, with stronger performance being linked to male students (Vesterlund). This biased thought inspired testing the hypothesis that performance in Mathematics on standardized exams is independent of sex. There are issues that present themselves in the analysis of standardized test scores, including standardized test scores not being representative of student’s true knowledge and understanding but those procedural disagreements will be disregarded in this analysis. As stated above, the data set was reduced to only include percentage of students testing at a proficient level or higher, in the state of Massachusetts. The data was further reduced due to some discrepancies and errors found in reporting. The data that was excluded in this data set were any percentages reported that were higher than 100; any data that was present as “less than”, “less than or equal to”, “greater than”, or “greater than or equal to”; and any data that contained “PS” meaning the data was omitted to protect student privacy. In addition to these exclusions, any data that was presented as an interval of more than 10 percentage points (e.g. 60-64% is accepted, while 60-79 is disregarded). In order to the hypothesis that students’ performance in Mathematics is independent of gender, it was necessary to run some preliminary tests to determine which method of testing would be the best and also to increase the accuracy of the interpretation of the statistical outputs. Initially, a boxplot was constructed to determine if there were any significant outliers present in the data. That graph is presented to the right. Here we can see that there are no outliers in the data, the mean value of proficiency is similar, while female students have a slightly higher IQR (interquartile range). Once it was determined that there were no outliers, a set of descriptive statistics was completed to provide the sample size used in this analysis along with the numeric value of the mean and the standard deviation. What is noticeable here, is that the mean is confirmed to be within ±1 of each other. Though we can make any assumptions from this, it is important to note going into the following tests. The standard deviation is approximately 19, which is also something important to take note of. The normality of the data set has not been determined. The following figures are the histograms and Q-Q plots to display the distribution of the data separately, along with Q-Q plots of the separated data and the combined data. This allows for the determination of whether or not the data meets the assumptions necessary for specific hypothesis tests. To the right is the comparative histograms for the percent proficient for males and females. Here Figure 1: Boxplot of percent proficiency in Mathematics on statewide MCAS exams separated by sex.
  • 2.
    it becomes apparentthat the data is following an approximately normal distribution, though it’s slightly negatively skewed. Below, the figures of the Q-Q test for both the separated data and combined data are displayed, where it becomes apparent that the data is approximately normally distributed, though there is some deviation from the expected values towards the lower end of the scale and the higher end. Along the line, the data is highly concentrated, but at the ends veers off. This suggests that the data set is normal, but with slightly “heavier” tails. Now that it is known that the combined set of percent proficient test scores is normally distributed, the test of the individuals variables’ normality must be conducted. Below, the figures display the Q-Q plots of each of the breakdowns of the data by sex. The figures tell us that the breakdowns are also normally distributed, interestingly with the same deviations at the top and bottom of the scale, with slightly more variation in the data than the expected values on the bottom of the scale for males and slightly more deviation on the top of the scale for females. Now that the normality of the data has been determined, the hypothesis test can be conducted. In this case, an independent t-test will be used to determine whether or not there is statistical evidence to support our assumption that performance in Mathematics on standardized testing is independent of sex. The figure to the left is the independent sample t-test output from SPSS that gives
  • 3.
    the basis forthe statistical evidence to make the conclusions from this data. Here, the test was run at a 95% confidence level. This means that the significance α=0.05. Since p<α, there is statistically significant evidence to conclude that the null hypothesis is valid. The confidence interval determined by SPSS is (-3.34, 0.206). The confirms the suspicion that performance in Mathematics is independent of sex and that female students can be just as successful as male peers.
  • 4.
    References Vesterlund, Neiderle and."Explaining the Gender Gap in Math Test Scores: The Role of Competition." Journal of Economic Perspectives (2010): 129-144. Online Journal. <http://web.stanford.edu/~niederle/NV.JEP.pdf>.