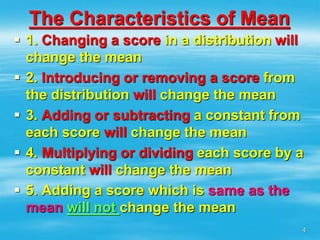
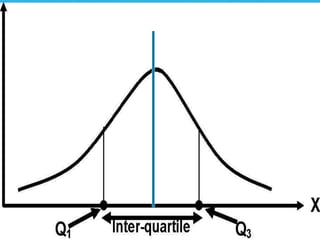
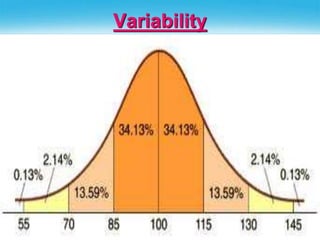
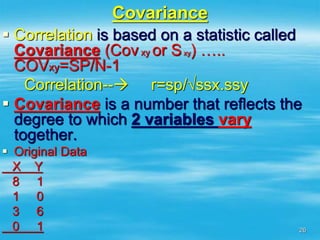
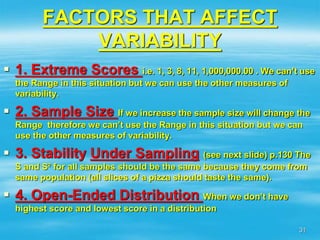
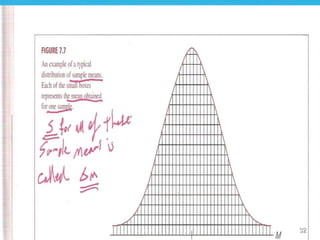
CHAPTER 3
Descriptive
Statistics
Measures of
Central Tendency
1
Descriptive Statistics
Measures of Central Tendency
 Mean--------Interval or Ratio scale Polygon
– The sum of the values divided by the number of
values--often called the "average." μ=ΣX/N
– Add all of the values together. Divide by the number
of values to obtain the mean.
– Example:
X
7
12
24
20
19
????
2
Descriptive Statistics
The Mean is:
μ=ΣX/N= 82/5=16.4
(7 + 12 + 24 + 20 + 19) / 5 =
16.4.
3
The Characteristics of Mean
 1. Changing a score in a distribution will
change the mean
 2. Introducing or removing a score from
the distribution will change the mean
 3. Adding or subtracting a constant from
each score will change the mean
 4. Multiplying or dividing each score by a
constant will change the mean
 5. Adding a score which is same as the
mean will not change the mean
4
Descriptive Statistics
 Measures of Central Tendency
 Median/MiddleOrdinal ScaleBar/Histogram
– Divides the values into two equal halves, with
half of the values being lower than the median
and half higher than the median.
 Sort the values into ascending order.
 If you have an odd number of values, the
median is the middle value.
 If you have an even number of values, the
median is the arithmetic mean (see above) of
the two middle values.
– Example: The median of the same five numbers
(7, 12, 24, 20, 19) is ???.
5
Statistics
 The median is 19.
 Mode-Nominal Scale Bar/Histogram
–The most frequently-occurring value (or
values).
Calculate the frequencies for all of the
values in the data.
The mode is the value (or values) with
the highest frequency.
–Example: For individuals having the
following ages -- 18, 18, 19, 20, 20, 20, 21,
and 23, the mode is ???? The Mode is 20
6
CHARACTERISTICS OF MODE
 Nominal Scale
 Discrete Variable
 Describing Shape
7
The Range
 The Range:
The Range is the difference between
the highest number –lowest number +1
2, 4, 7, 8, and 10 -> Discrete Numbers
2, 4.6, 7.3, 8.4, and 10 -> Continues
Numbers
The difference between the upper real
limit of the highest number and the
lower real limit of the lowest number.
CHAPTER 4
Variability
9
10
Variability
Variability is a measure of
dispersion or spreading of
scores around the mean, and
has 2 purposes:
1. Describes the distribution
Next slide
11
Range, Interquartile Range, Semi-Interquartile
Range, Standard Deviation, and Variance are the
Measures of Variability
 The Range:
The Range is the difference between the
highest number –lowest number +1
2, 4, 7, 8, and 10 -> Discrete Numbers
2, 4.6, 7.3, 8.4, and 10 -> Continues
Numbers
The difference between the upper real
limit of the highest number and the lower
real limit of the lowest number.
Variability
 2. How well an individual score (or
group of scores) represents the
entire distribution. i.e. Z Score
 Ex. In inferential statistics we
collect information from a small
sample then, generalize the results
obtained from the sample to the
entire population.
13
Interquartile Range (IQR)
In descriptive statistics, the
Interquartile Range (IQR),
also called the midspread or
middle fifty, is a measure of
statistical dispersion, being
equal to the difference
between the upper and lower
quartiles. (Q3 − Q1)=IQR 14
15
16
17
Interquartile Range (IQR)
IQR is the range covered
by the middle 50% of the
distribution.
IQR is the distance
between the 3rd Quartile
and 1st Quartile.
18
Semi-Interquartile Range (SIQR)
SIQR is ½ or half of
the Interquartile
Range.
SIQR = (Q3-Q1)/2
19
Variability
20
21
Variability
Range, SS, Standard Deviations and Variances
 X σ² = ss/N Pop
1 σ = √ss/N
2
4 s² = ss/n-1 or ss/df Standard deviation
5 s = √ss/df Sample
SS=Σx²-(Σx)²/N  Computation
SS=Σ( x-μ)²  Definition
Sum of Squared Deviation from Mean
Variance (σ²) is the Mean of Squared Deviations=MS22
23
Practical Implication for Test
Construction
Variance and Covariance measure the quality of each
item in a test.
Reliability and validity measure the quality of the
entire test.
 σ²=SS/N  used for one set of data
Variance is the degree of variability
of scores from mean.
Correlation is based on a statistic called Covariance (Cov xy
or S xy) ….. r=sp/√ssx.ssy
 COVxy=SP/N-1  used for 2 sets of data
Covariance is a number that reflects the degree to
which 2 variables vary together.
24
Variance
 X σ² = ss/N Pop
1 s² = ss/n-1 or ss/df Sample
2
4
5
SS=Σx²-(Σx)²/N
SS=Σ( x-μ)²
Sum of Squared Deviation from Mean
25
Covariance
 Correlation is based on a statistic called
Covariance (Covxy or Sxy) …..
COVxy=SP/N-1
Correlation-- r=sp/√ssx.ssy
 Covariance is a number that reflects the
degree to which 2 variables vary
together.
 Original Data
X Y
1 3
2 6
4 4
5 7
26
Covariance
 Correlation is based on a statistic called
Covariance (Covxy or Sxy) …..
COVxy=SP/N-1
Correlation-- r=sp/√ssx.ssy
 Covariance is a number that reflects the
degree to which 2 variables vary
together.
 Original Data
X Y
8 1
1 0
3 6
0 1

27
Covariance
28
Descriptive Statistics for
Nondichotomous Variables
29
Descriptive Statistics for
Dichotomous Data
30
Descriptive Statistics for
Dichotomous Data
Item Variance & Covariance
FACTORS THAT AFFECT
VARIABILITY
 1. Extreme Scores i.e. 1, 3, 8, 11, 1,000,000.00 . We can’t use
the Range in this situation but we can use the other measures of
variability.
 2. Sample Size If we increase the sample size will change the
Range therefore we can’t use the Range in this situation but we can
use the other measures of variability.
 3. Stability Under Sampling (see next slide) p.130 The
S and S² for all samples should be the same because they come from
same population (all slices of a pizza should taste the same).
 4. Open-Ended Distribution When we don’t have
highest score and lowest score in a distribution
31
32

8490370.ppt

  • 1.
  • 2.
    Descriptive Statistics Measures ofCentral Tendency  Mean--------Interval or Ratio scale Polygon – The sum of the values divided by the number of values--often called the "average." μ=ΣX/N – Add all of the values together. Divide by the number of values to obtain the mean. – Example: X 7 12 24 20 19 ???? 2
  • 3.
    Descriptive Statistics The Meanis: μ=ΣX/N= 82/5=16.4 (7 + 12 + 24 + 20 + 19) / 5 = 16.4. 3
  • 4.
    The Characteristics ofMean  1. Changing a score in a distribution will change the mean  2. Introducing or removing a score from the distribution will change the mean  3. Adding or subtracting a constant from each score will change the mean  4. Multiplying or dividing each score by a constant will change the mean  5. Adding a score which is same as the mean will not change the mean 4
  • 5.
    Descriptive Statistics  Measuresof Central Tendency  Median/MiddleOrdinal ScaleBar/Histogram – Divides the values into two equal halves, with half of the values being lower than the median and half higher than the median.  Sort the values into ascending order.  If you have an odd number of values, the median is the middle value.  If you have an even number of values, the median is the arithmetic mean (see above) of the two middle values. – Example: The median of the same five numbers (7, 12, 24, 20, 19) is ???. 5
  • 6.
    Statistics  The medianis 19.  Mode-Nominal Scale Bar/Histogram –The most frequently-occurring value (or values). Calculate the frequencies for all of the values in the data. The mode is the value (or values) with the highest frequency. –Example: For individuals having the following ages -- 18, 18, 19, 20, 20, 20, 21, and 23, the mode is ???? The Mode is 20 6
  • 7.
    CHARACTERISTICS OF MODE Nominal Scale  Discrete Variable  Describing Shape 7
  • 8.
    The Range  TheRange: The Range is the difference between the highest number –lowest number +1 2, 4, 7, 8, and 10 -> Discrete Numbers 2, 4.6, 7.3, 8.4, and 10 -> Continues Numbers The difference between the upper real limit of the highest number and the lower real limit of the lowest number.
  • 9.
  • 10.
  • 11.
    Variability Variability is ameasure of dispersion or spreading of scores around the mean, and has 2 purposes: 1. Describes the distribution Next slide 11
  • 12.
    Range, Interquartile Range,Semi-Interquartile Range, Standard Deviation, and Variance are the Measures of Variability  The Range: The Range is the difference between the highest number –lowest number +1 2, 4, 7, 8, and 10 -> Discrete Numbers 2, 4.6, 7.3, 8.4, and 10 -> Continues Numbers The difference between the upper real limit of the highest number and the lower real limit of the lowest number.
  • 13.
    Variability  2. Howwell an individual score (or group of scores) represents the entire distribution. i.e. Z Score  Ex. In inferential statistics we collect information from a small sample then, generalize the results obtained from the sample to the entire population. 13
  • 14.
    Interquartile Range (IQR) Indescriptive statistics, the Interquartile Range (IQR), also called the midspread or middle fifty, is a measure of statistical dispersion, being equal to the difference between the upper and lower quartiles. (Q3 − Q1)=IQR 14
  • 15.
  • 16.
  • 17.
  • 18.
    Interquartile Range (IQR) IQRis the range covered by the middle 50% of the distribution. IQR is the distance between the 3rd Quartile and 1st Quartile. 18
  • 19.
    Semi-Interquartile Range (SIQR) SIQRis ½ or half of the Interquartile Range. SIQR = (Q3-Q1)/2 19
  • 20.
  • 21.
  • 22.
    Variability Range, SS, StandardDeviations and Variances  X σ² = ss/N Pop 1 σ = √ss/N 2 4 s² = ss/n-1 or ss/df Standard deviation 5 s = √ss/df Sample SS=Σx²-(Σx)²/N  Computation SS=Σ( x-μ)²  Definition Sum of Squared Deviation from Mean Variance (σ²) is the Mean of Squared Deviations=MS22
  • 23.
    23 Practical Implication forTest Construction Variance and Covariance measure the quality of each item in a test. Reliability and validity measure the quality of the entire test.  σ²=SS/N  used for one set of data Variance is the degree of variability of scores from mean. Correlation is based on a statistic called Covariance (Cov xy or S xy) ….. r=sp/√ssx.ssy  COVxy=SP/N-1  used for 2 sets of data Covariance is a number that reflects the degree to which 2 variables vary together.
  • 24.
    24 Variance  X σ²= ss/N Pop 1 s² = ss/n-1 or ss/df Sample 2 4 5 SS=Σx²-(Σx)²/N SS=Σ( x-μ)² Sum of Squared Deviation from Mean
  • 25.
    25 Covariance  Correlation isbased on a statistic called Covariance (Covxy or Sxy) ….. COVxy=SP/N-1 Correlation-- r=sp/√ssx.ssy  Covariance is a number that reflects the degree to which 2 variables vary together.  Original Data X Y 1 3 2 6 4 4 5 7
  • 26.
    26 Covariance  Correlation isbased on a statistic called Covariance (Covxy or Sxy) ….. COVxy=SP/N-1 Correlation-- r=sp/√ssx.ssy  Covariance is a number that reflects the degree to which 2 variables vary together.  Original Data X Y 8 1 1 0 3 6 0 1
  • 27.
  • 28.
  • 29.
  • 30.
    30 Descriptive Statistics for DichotomousData Item Variance & Covariance
  • 31.
    FACTORS THAT AFFECT VARIABILITY 1. Extreme Scores i.e. 1, 3, 8, 11, 1,000,000.00 . We can’t use the Range in this situation but we can use the other measures of variability.  2. Sample Size If we increase the sample size will change the Range therefore we can’t use the Range in this situation but we can use the other measures of variability.  3. Stability Under Sampling (see next slide) p.130 The S and S² for all samples should be the same because they come from same population (all slices of a pizza should taste the same).  4. Open-Ended Distribution When we don’t have highest score and lowest score in a distribution 31
  • 32.