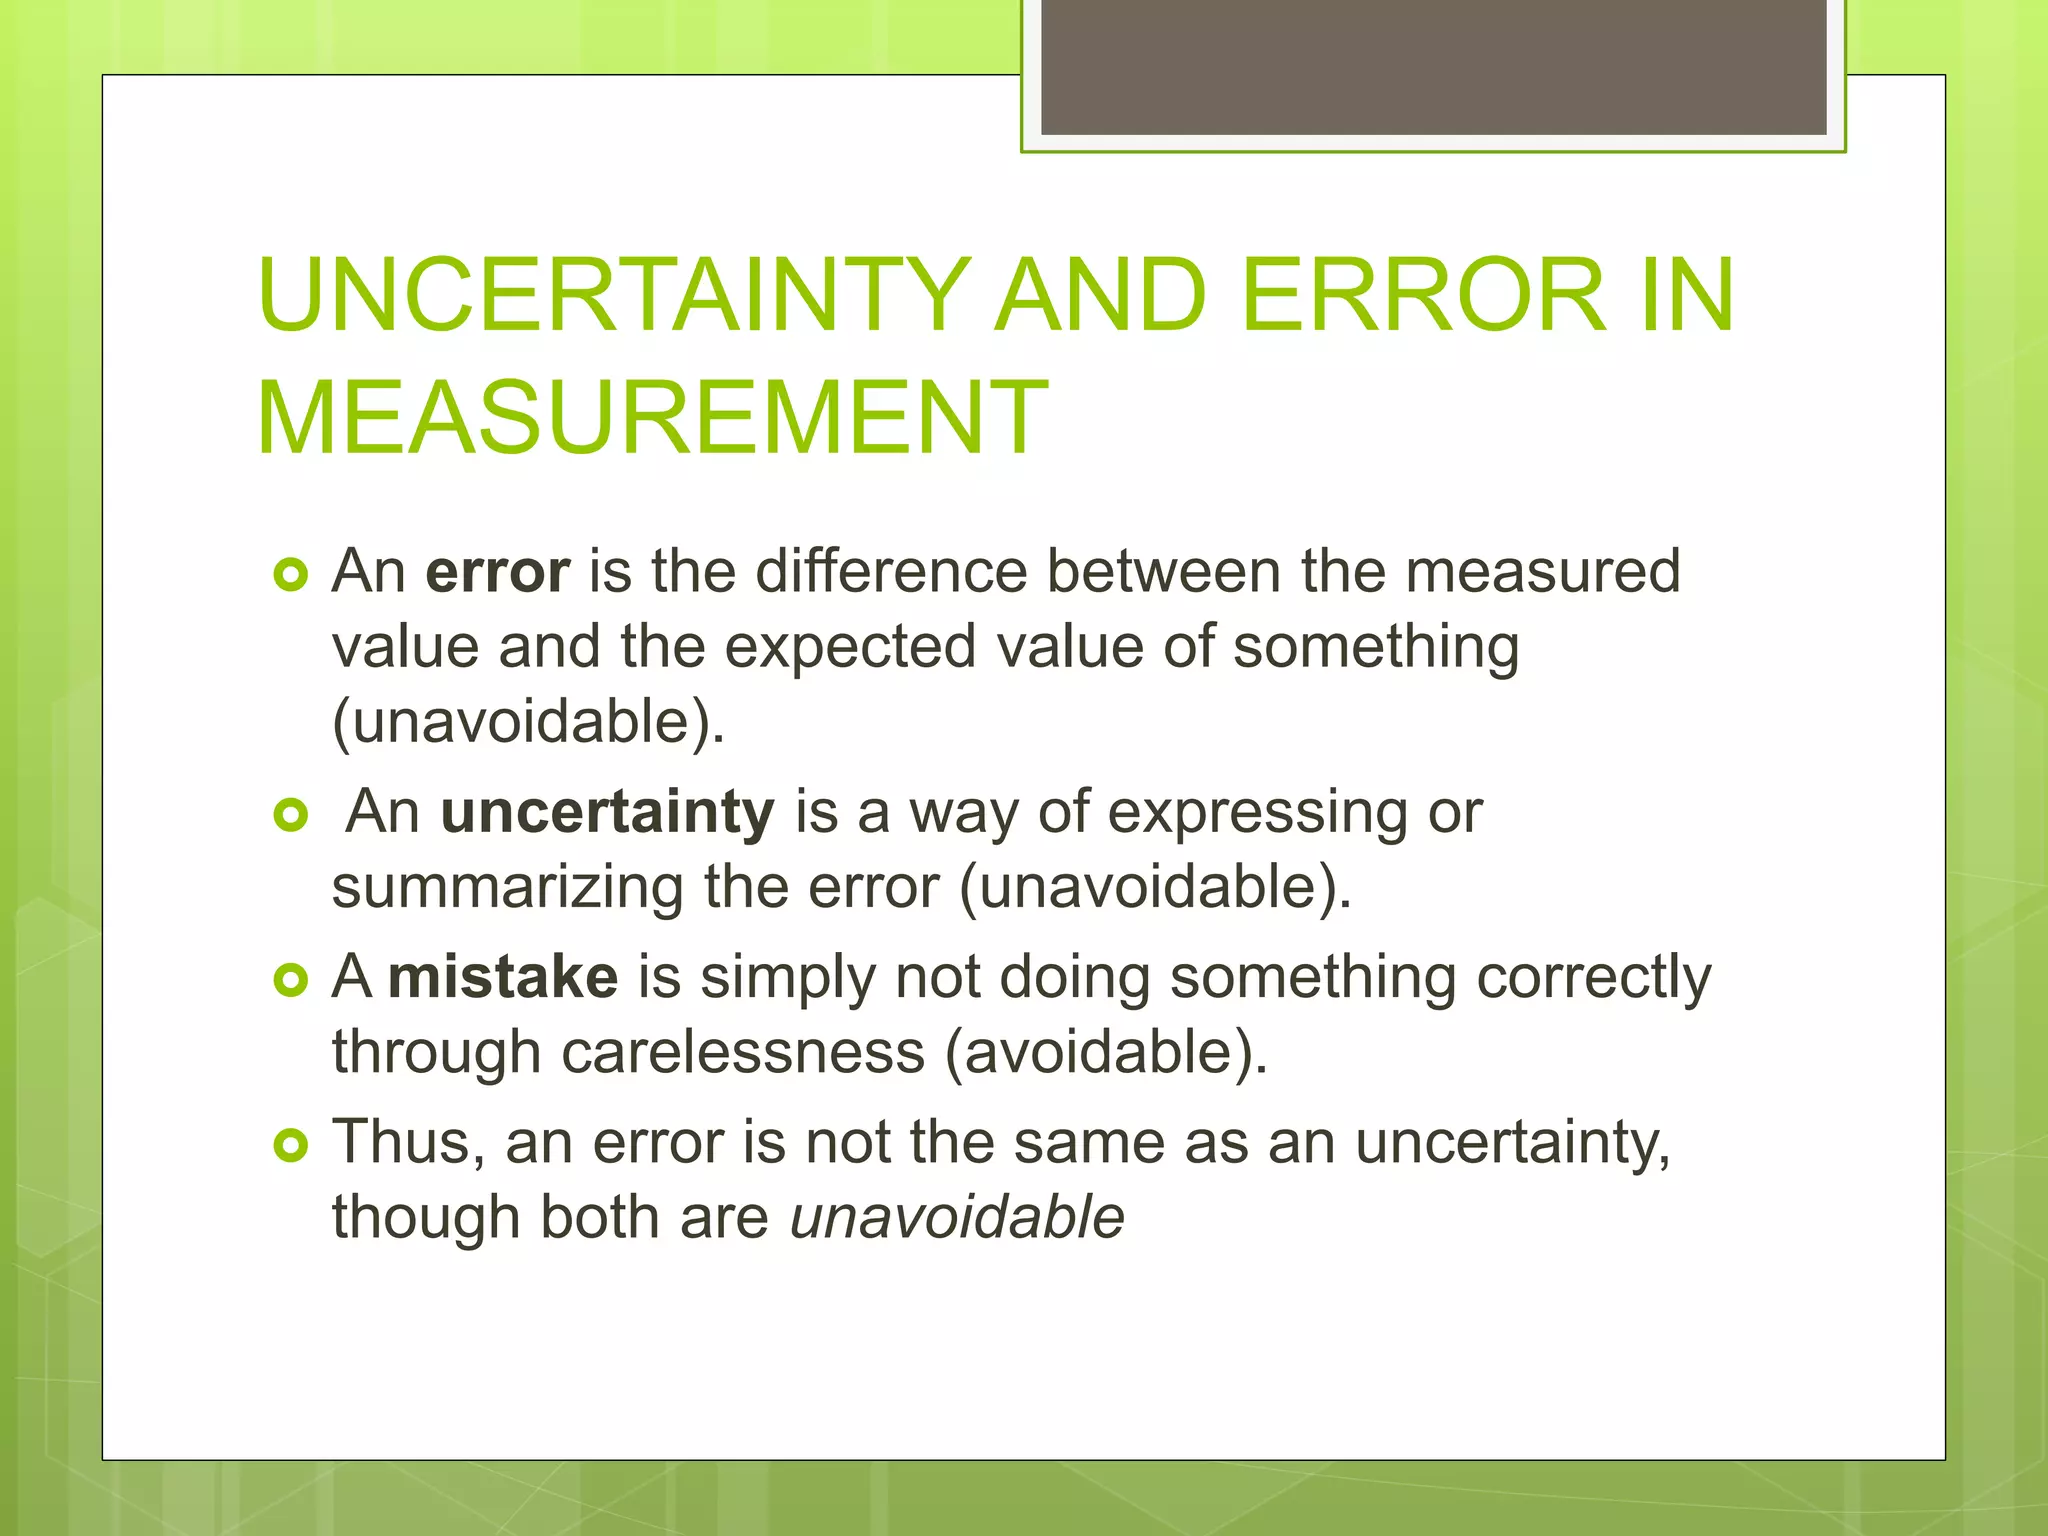
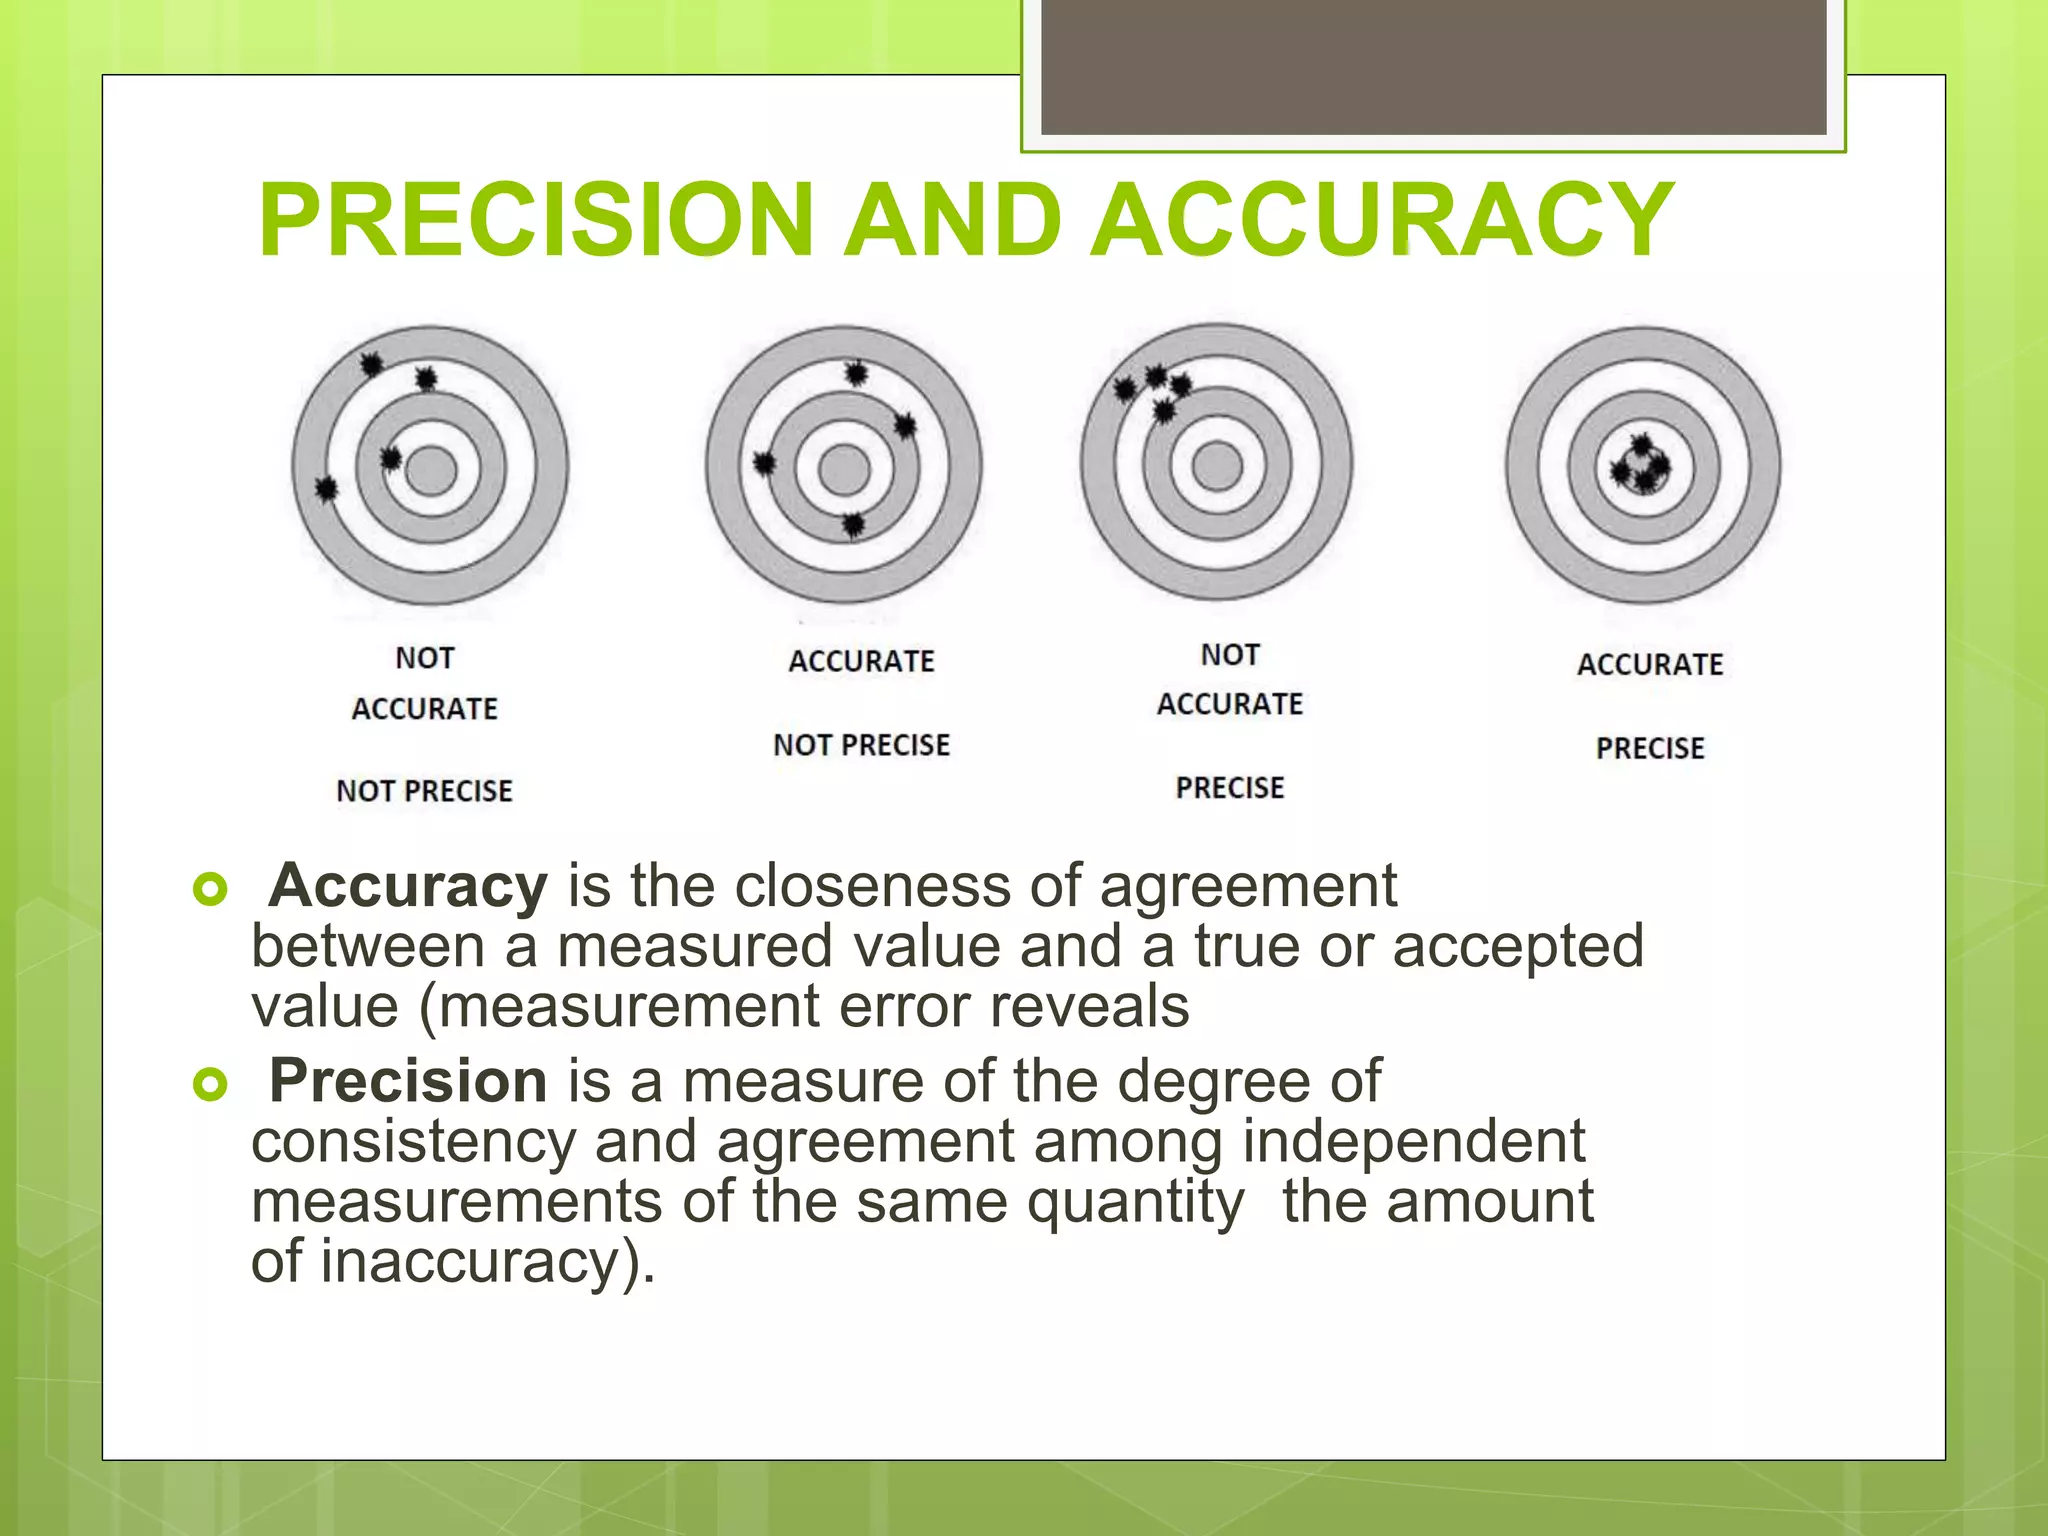
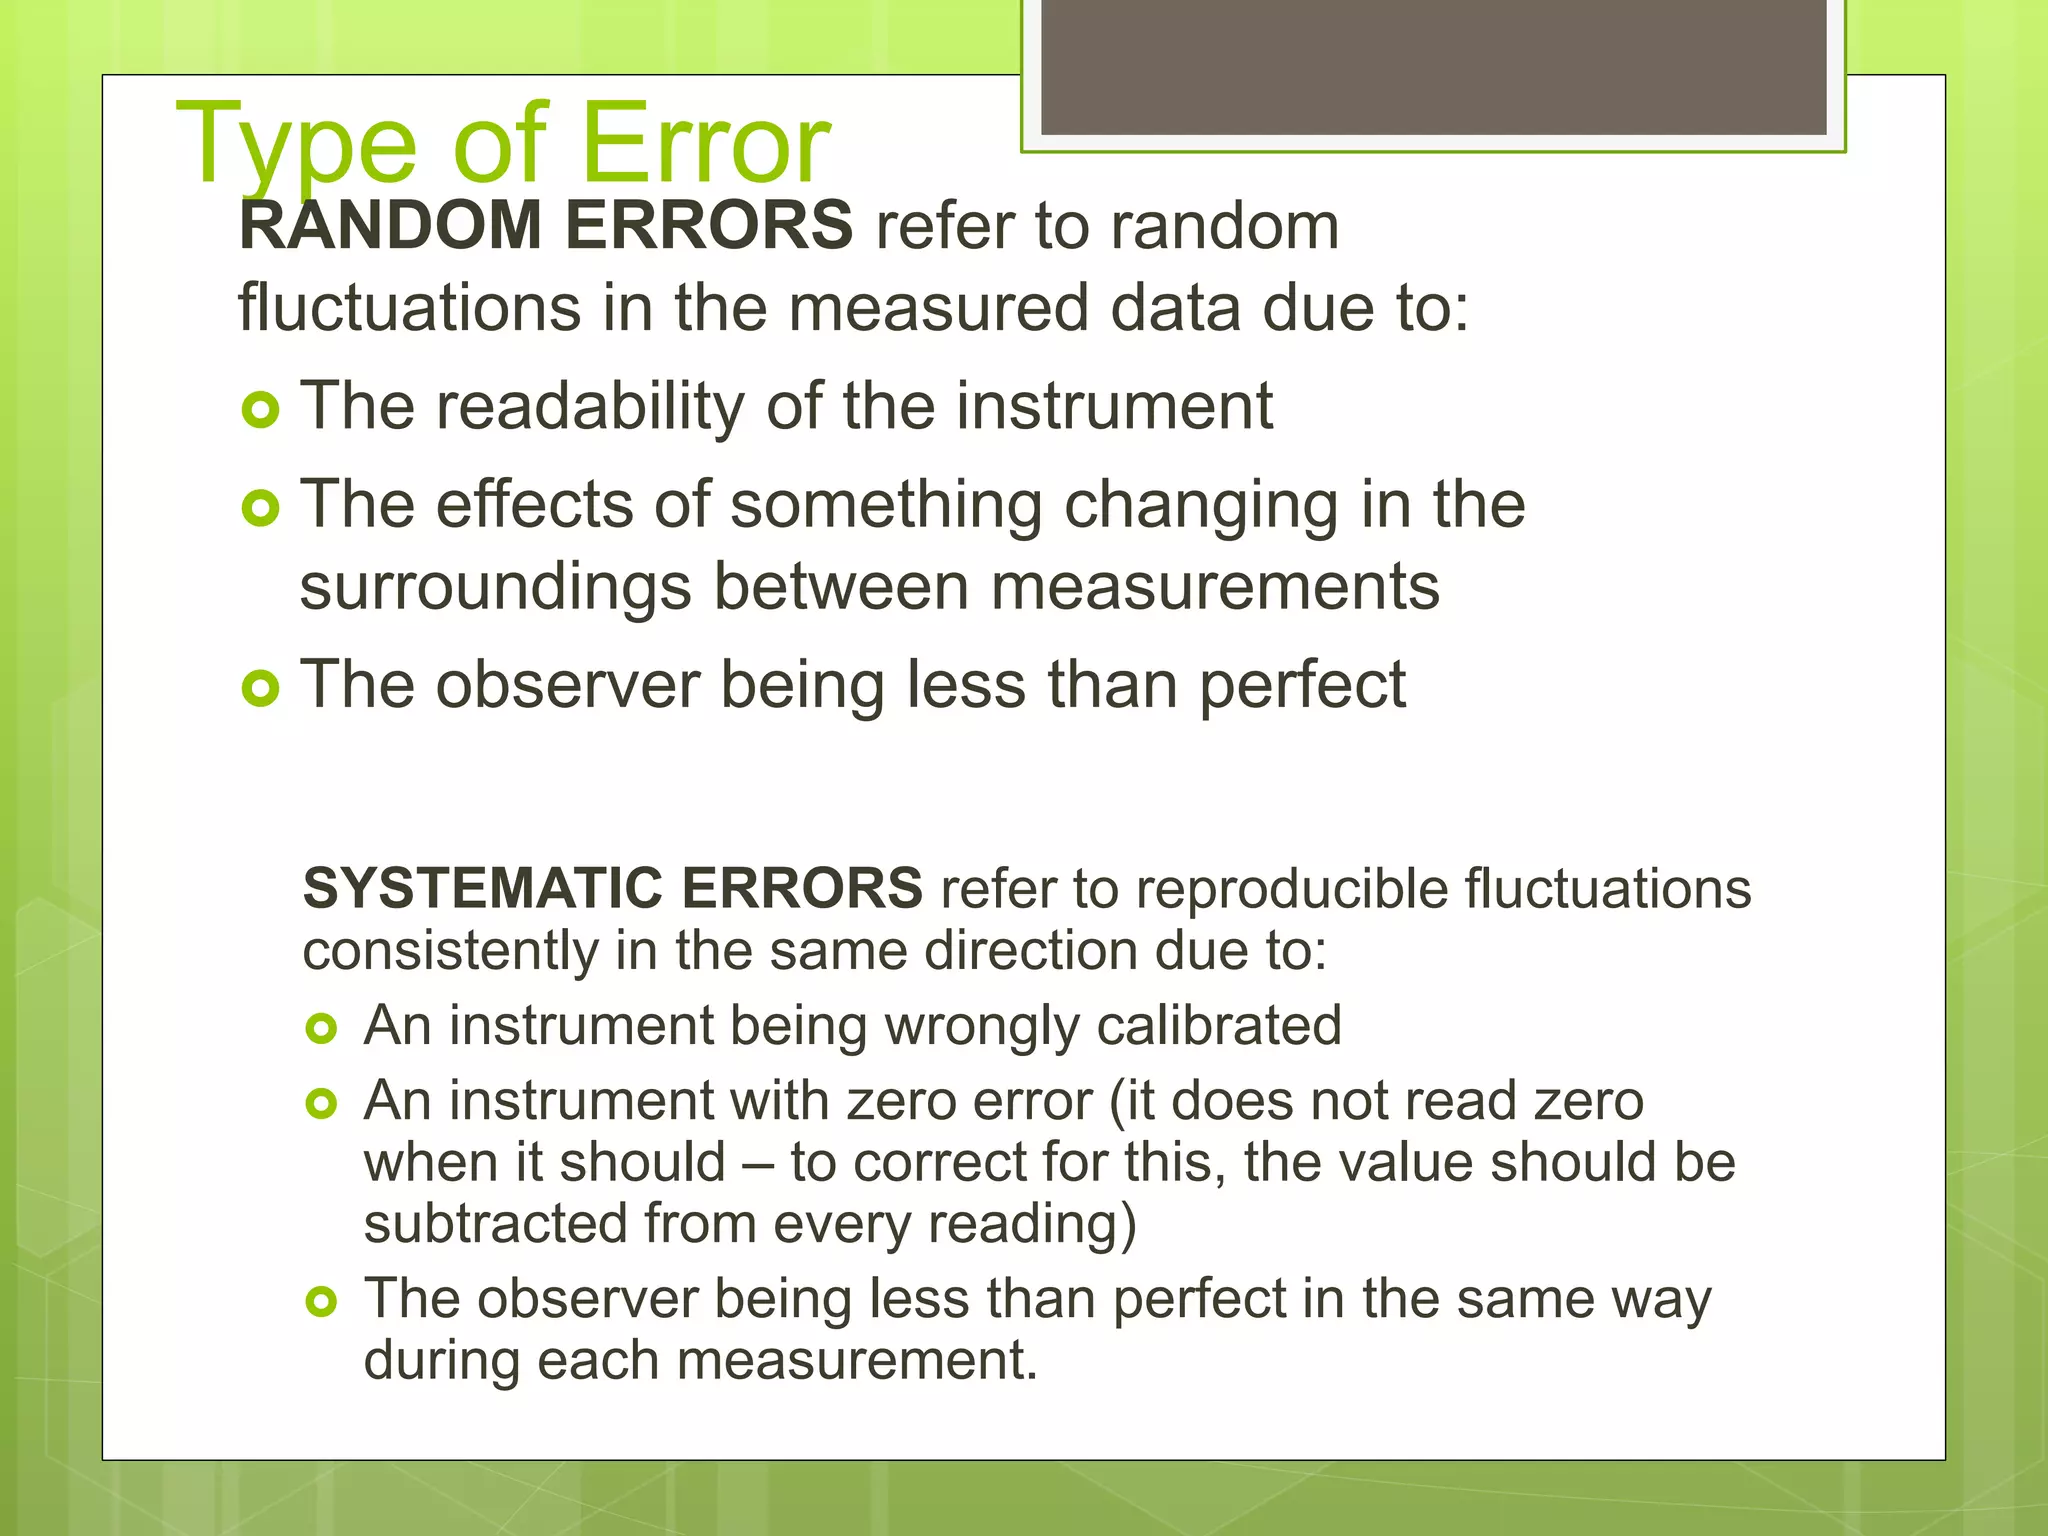
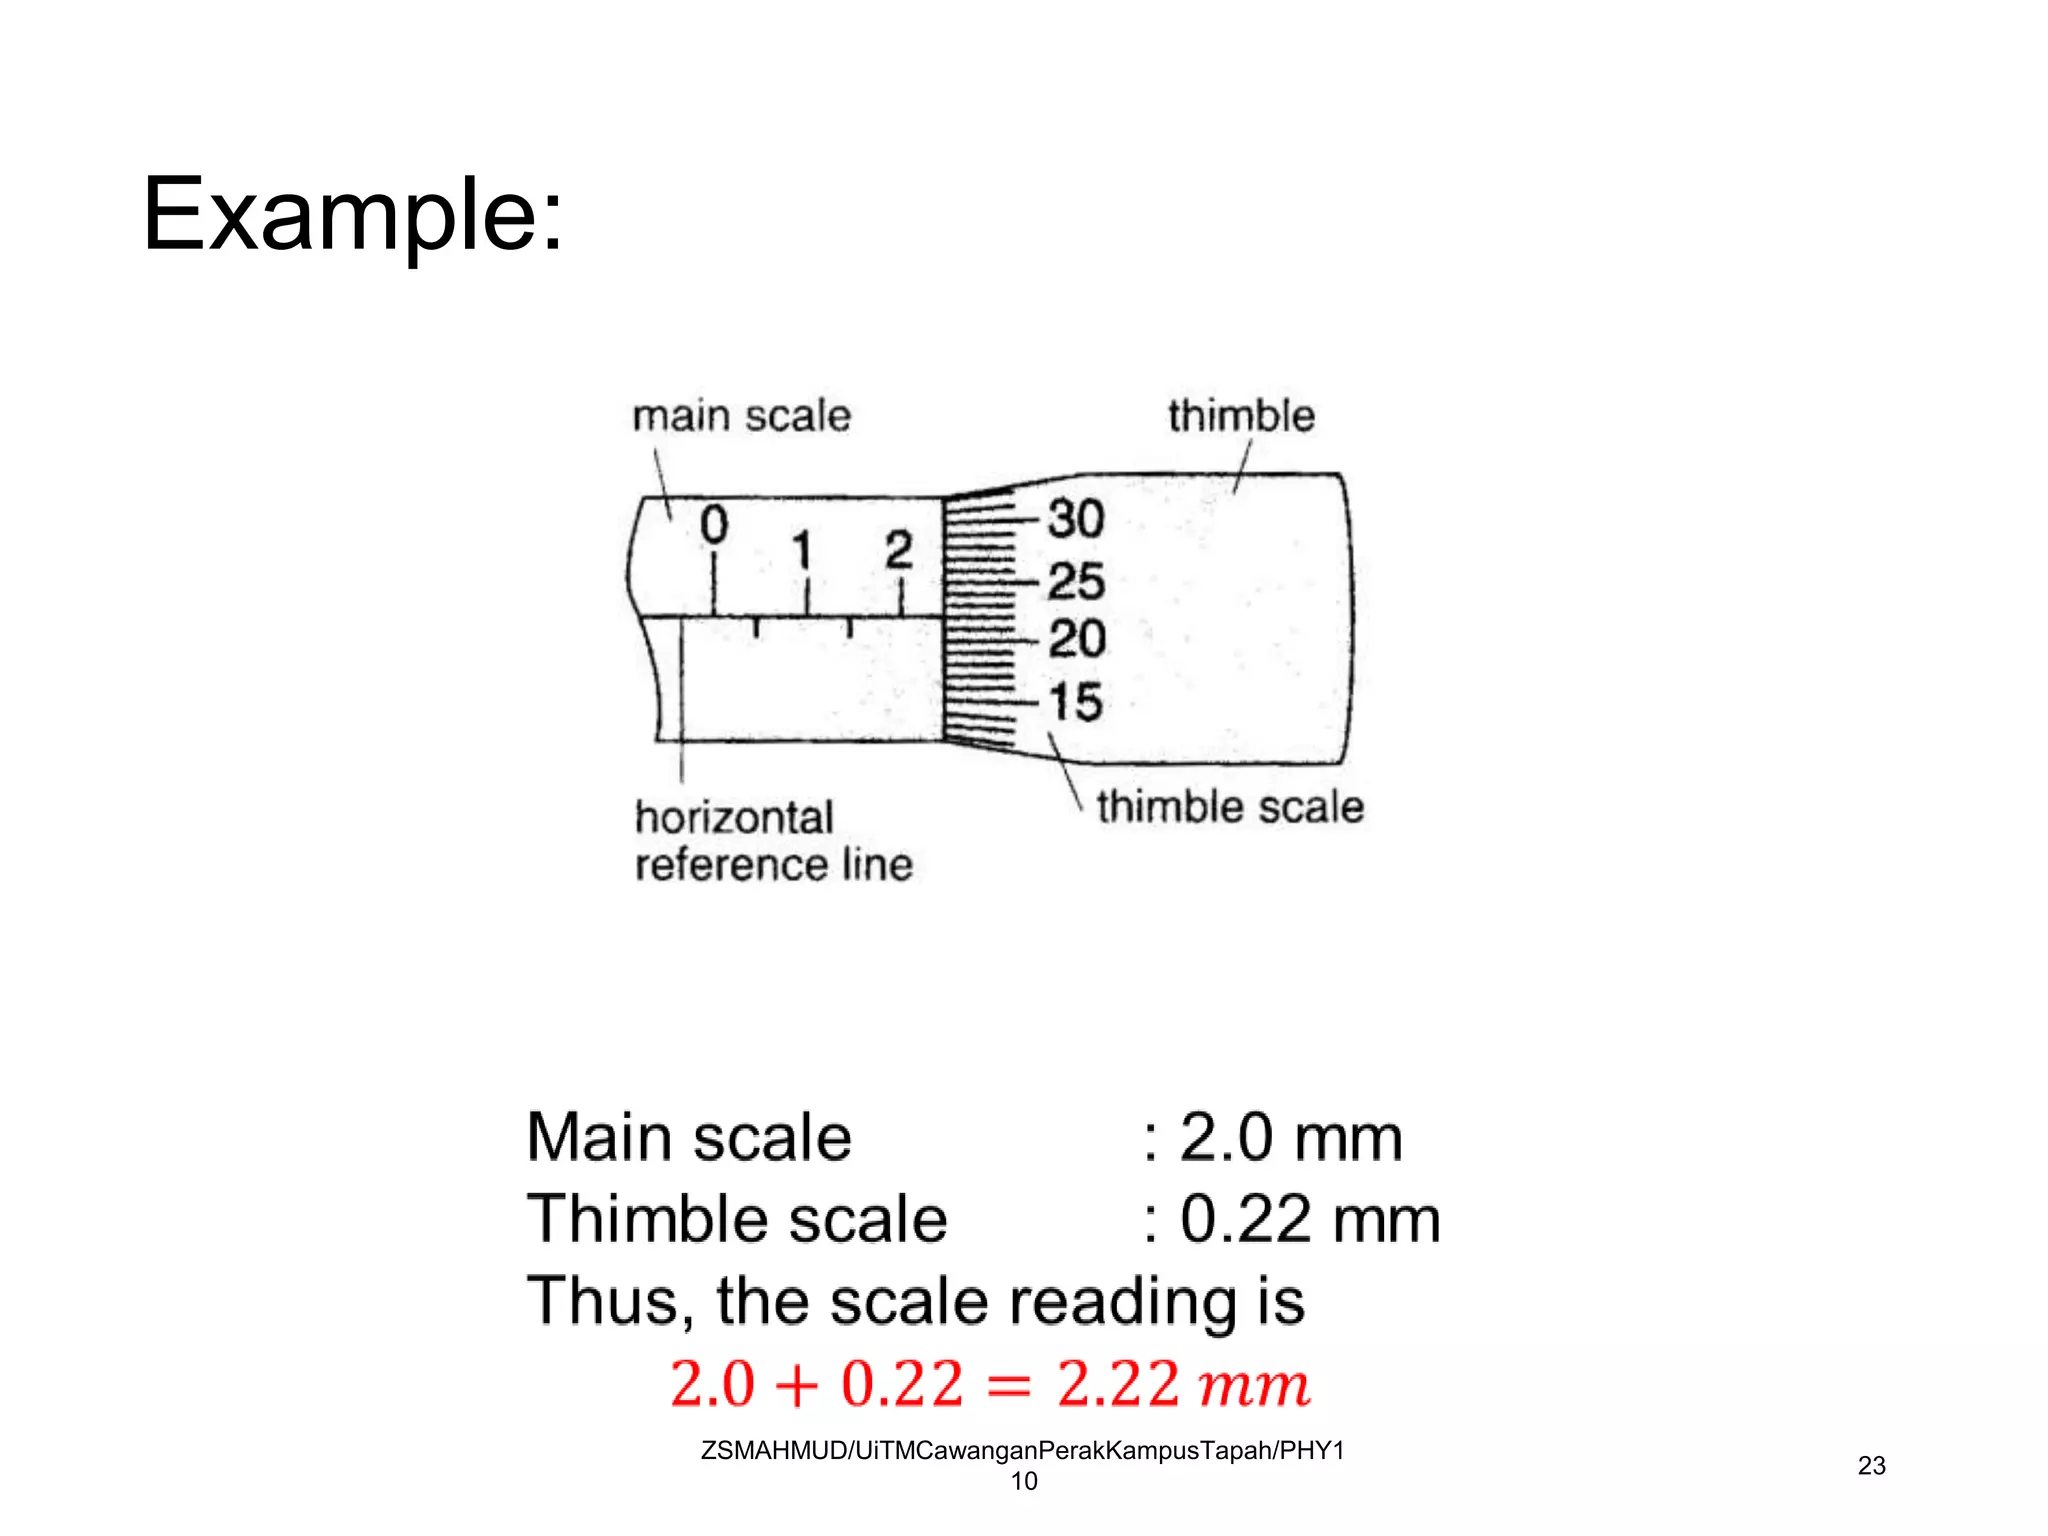
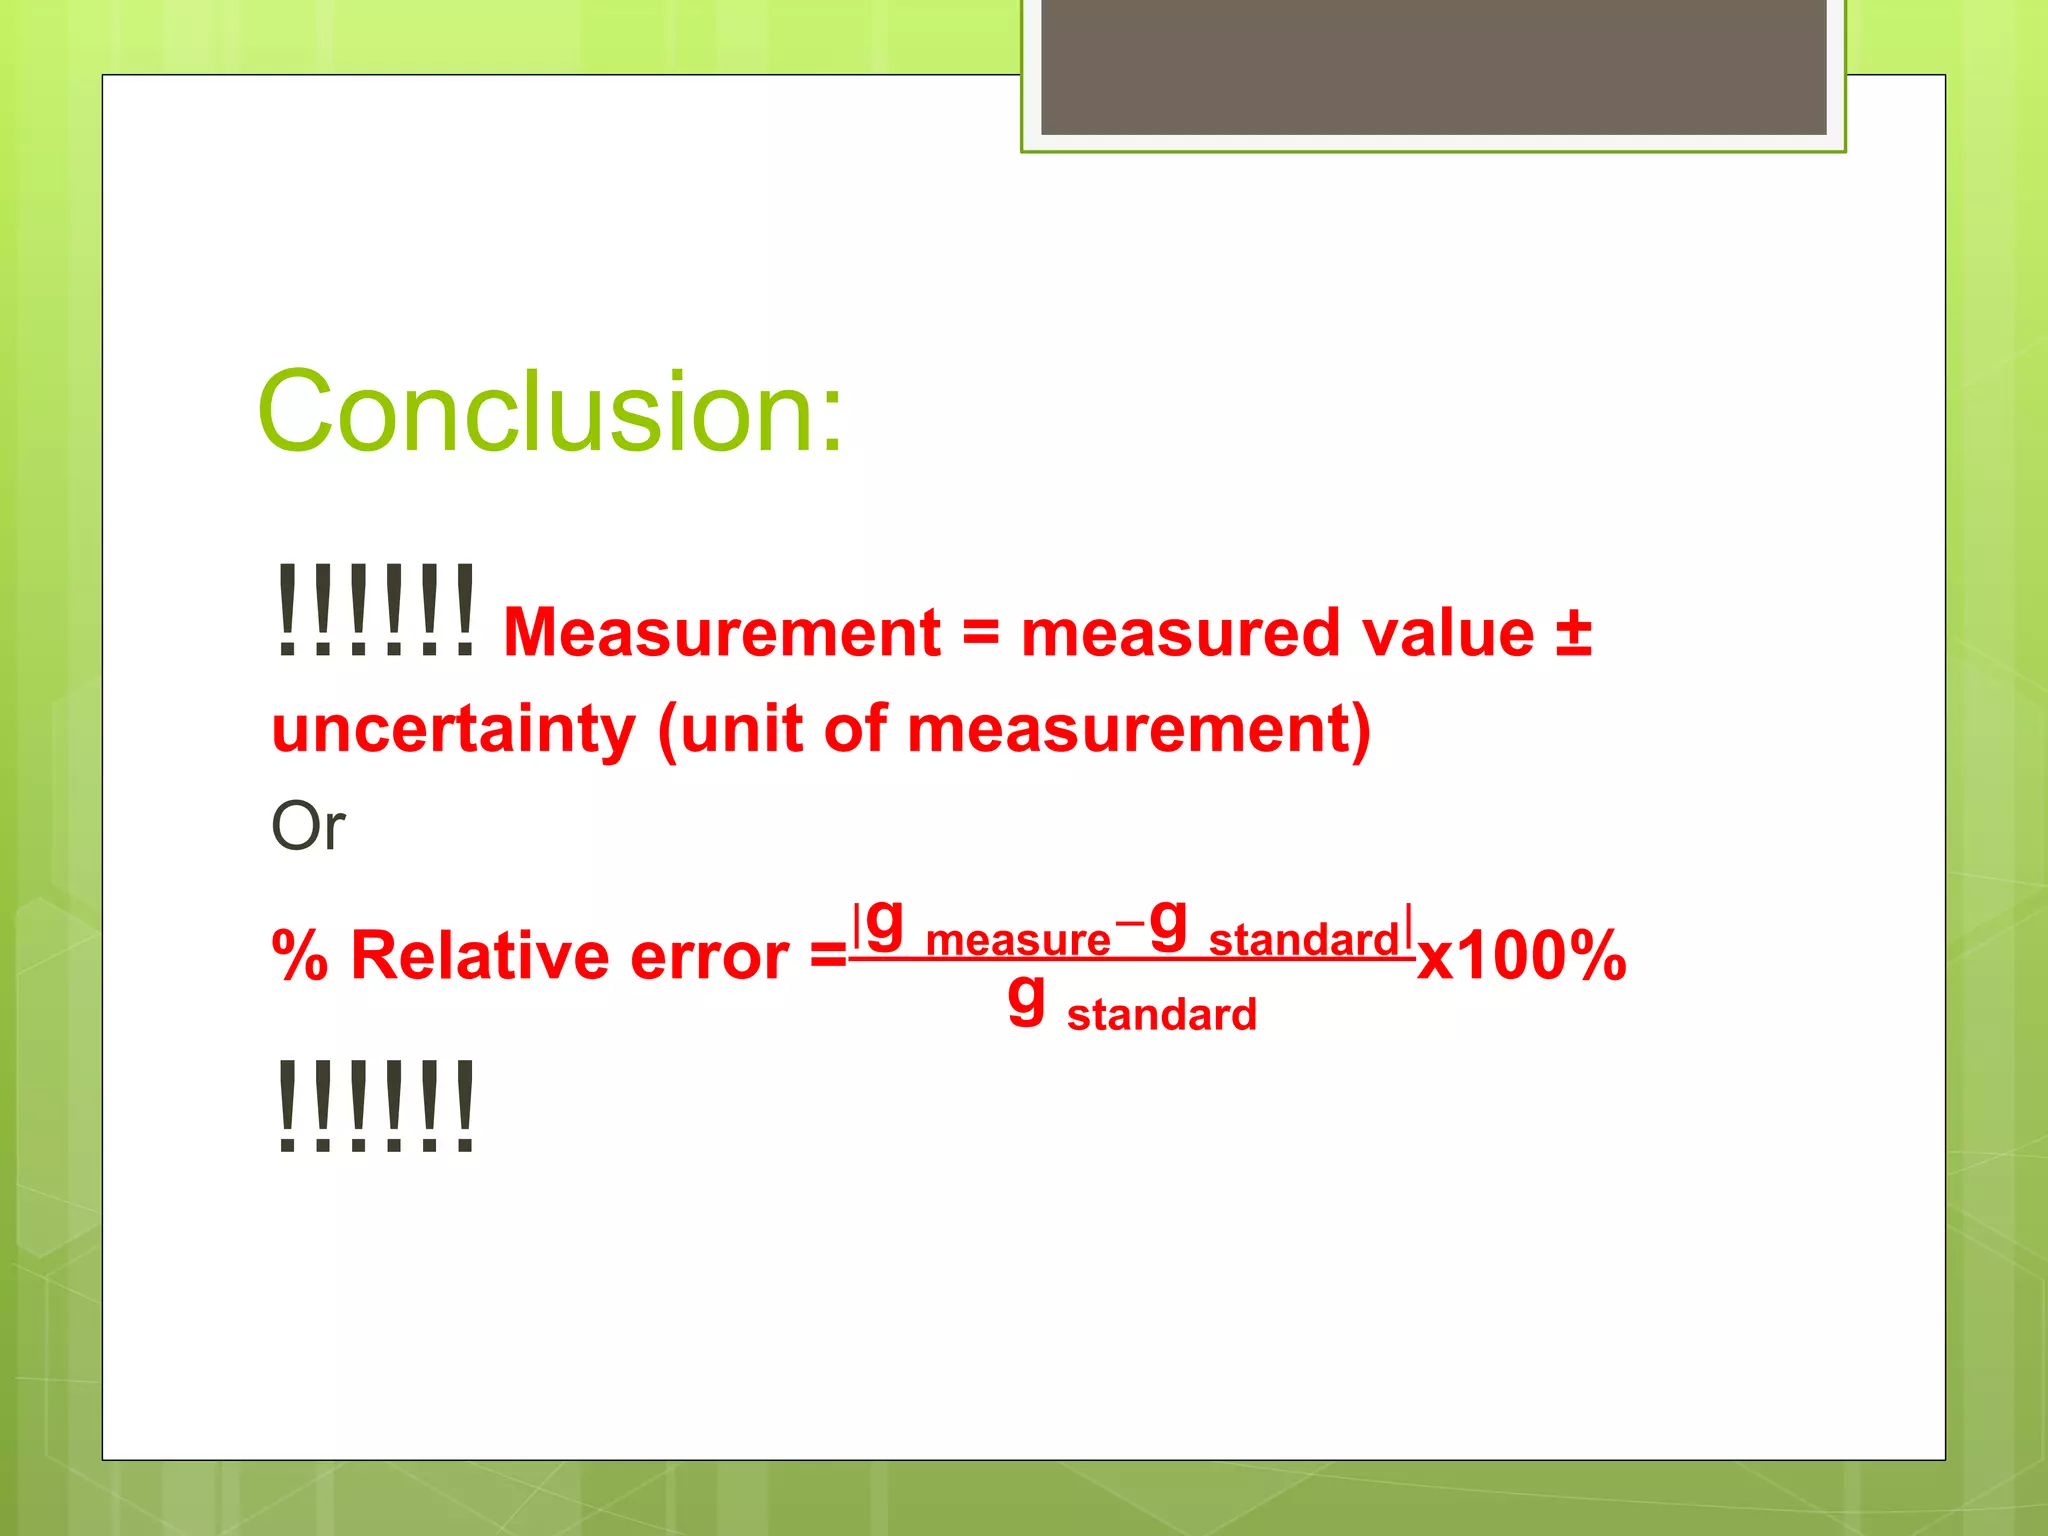
UNCERTAINTY AND ERROR IN
MEASUREMENT
 An error is the difference between the measured
value and the expected value of something
(unavoidable).
 An uncertainty is a way of expressing or
summarizing the error (unavoidable).
 A mistake is simply not doing something correctly
through carelessness (avoidable).
 Thus, an error is not the same as an uncertainty,
though both are unavoidable
PRECISION AND ACCURACY
 Accuracy is the closeness of agreement
between a measured value and a true or accepted
value (measurement error reveals
 Precision is a measure of the degree of
consistency and agreement among independent
measurements of the same quantity the amount
of inaccuracy).
Type of Error
RANDOM ERRORS refer to random
fluctuations in the measured data due to:
 The readability of the instrument
 The effects of something changing in the
surroundings between measurements
 The observer being less than perfect
SYSTEMATIC ERRORS refer to reproducible fluctuations
consistently in the same direction due to:
 An instrument being wrongly calibrated
 An instrument with zero error (it does not read zero
when it should – to correct for this, the value should be
subtracted from every reading)
 The observer being less than perfect in the same way
during each measurement.
ABSOLUTE AND
PERCENTAGE
UNCERTAINTIES
Measurement = measured value ±
uncertainty (unit of measurement)
How?
ABSOLUTE AND
PERCENTAGE
UNCERTAINTIES
1. The min value of the smallest scale of the
instrument (scale measurement Error)
Example 1:
The smallest scale is 0.1 cm
Therefore, Δ L = 0.1/2 = 0.05cm
The value of line is , L Δ L = 8.60 ±0.05 cm
ABSOLUTE AND
PERCENTAGE
UNCERTAINTIES
The smallest scale is 1 s
Therefore, Δ t = 1/2 = 0.5 s
The measurement 4.5 ± 0.5s
Example 2:
ABSOLUTE AND
PERCENTAGE
UNCERTAINTIES
2. If the experimental has different value for
repeating measurement, the uncertainty is
associated with the average of deviation
Example:
a (mm) 1.55 1.52 1.54 1.53
<a> = (1.55 +1.52+1.54+1.53)/4=1.535
Deviation d1 = |1.55-1.535|=0.015
d2 = |1.52-1.535|=0.015
d3 = |1.54-1.535|=0.005
d4 = |1.53-1.535|=0.005
Average, <d> = (0.015+0.015+0.005+0.005)/4=0.01
The measurement, a = (1.535±0.010) mm
ABSOLUTE AND
PERCENTAGE
UNCERTAINTIES
3. If we know the standard value. The
uncertainties normally we calculate the
percentage relative error:
Example: g measure = 10.0 m/s2
g standard = 9.81 m/s2
% error =
|g measure−g standard|
g standard
x100% = 1.936%
ABSOLUTE AND PERCENTAGE
UNCERTAINTIES
4. For the graphical analysis of data, we use the
maximum and minimum best-fit lines to determine the
final uncertainty.
Example:
Gradient of best fit, m = 9.78 m/s2
Max gradient, mmax = 9.88 m/s2
Min gradient, mmin = 9.72 m/s2
Δ m = ½ (mmax - mmin )
Therefore, gradient m = (9.78±
0.08 ) m/s2
Same method for calculating the intercept
ABSOLUTE AND
PERCENTAGE
UNCERTAINTIES
5. Sometimes, the final result involving
mathematical equations, so we need to be
concerned with how we treat uncertainties in
calculated values using experimental data
I. If data are to be added or subtracted, add
the absolute uncertainty:
A = p ± q , ΔA = Δp + Δ q
Example: Mass of empty beaker is (50 ± 1 ) g
Mass of beaker and water is (100 ± 1 ) g
Mass of water = 100-50 = 50 g
Error of m = 1+1 =2 g
Therefore, mass of water = 50 ± 2 g
ABSOLUTE AND
PERCENTAGE
UNCERTAINTIES
II. If data are to be multiplied or divided, add
the percentage uncertainty:
A = p x q ,
ΔA
A
=
Δp
p
+
Δ q
q
A = p / q,
ΔA
A
=
Δp
p
+
Δ q
q
Example: the mass of water is mass of water = 50 ±
2 g. The volume of 2.1 ±0.1 m3. Density=?
Error of density is
Δρ
ρ
=
Δm
m
+
Δ V
V
=
ABSOLUTE AND
PERCENTAGE
UNCERTAINTIES
III. If data are raised to a power, multiply the
percentage uncertainty by that power:
A = pn ,
ΔA
A
=n
Δp
p
Example: A cylinder has a radius of 1.60 ± 0.01 cm
and a height of 11.5 ± 0.1 cm. Find the volume.
V = π r2 h = π (1.60)2 x 11.5 = 92.488 cm3 = 92 cm3
ΔV
V
=2
Δr
r
+
Δℎ
ℎ
= 2 cm3
V is (92 ± 2 ) cm3
Exercises
Exercises
Exercises
In experiment simple resistor, the following data
obtain.
Find the resistance and its uncertainty.
Voltage (V) Current (A)
1 0.88
2 3
3 3.7
4 3.6
5 6.5
6 9
7 10.6
8 12.3
10 15
18
 A vernier caliper is used to measure an object with
dimensions up to 12 cm with an accuracy of 0.01 cm.
 Comprises of a main scale and a vernier scale.
Examples of Measuring Instruments
-Vernier Calliper
19
 The reading on the main scale is determined with
reference to the `0' mark on the vernier scale.
 The reading to be taken on the vernier scale is
indicated by the mark on the vernier scale which is
exactly in line or coincides with any main scale
division line.
ZSMAHMUD/UiTMCawanganPerakKampusTapah/PHY1
10
20
 Example in Figure below:
ZSMAHMUD/UiTMCawanganPerakKampusTapah/PHY1
10
21
This instrument can be used to measure
diameters of wires and thicknesses of steel plates
to an accuracy of 0.01 mm.
Examples of Measuring Instruments
-Micrometer Screw Gauge
ZSMAHMUD/UiTMCawanganPerakKampusTapah/PHY1
10
22
 The micrometer scale comprises a main scale marked on
the sleeve and a scale marked on the thimble called the
thimble scale.
 One division on the thimble scale is 0.01 mm
ZSMAHMUD/UiTMCawanganPerakKampusTapah/PHY1
10
23
Example:
Conclusion:
!!!!!!Measurement = measured value ±
uncertainty (unit of measurement)
Or
% Relative error =
|g measure−g standard|
g standard
x100%
!!!!!!

Error analysis

  • 2.
    UNCERTAINTY AND ERRORIN MEASUREMENT  An error is the difference between the measured value and the expected value of something (unavoidable).  An uncertainty is a way of expressing or summarizing the error (unavoidable).  A mistake is simply not doing something correctly through carelessness (avoidable).  Thus, an error is not the same as an uncertainty, though both are unavoidable
  • 3.
    PRECISION AND ACCURACY Accuracy is the closeness of agreement between a measured value and a true or accepted value (measurement error reveals  Precision is a measure of the degree of consistency and agreement among independent measurements of the same quantity the amount of inaccuracy).
  • 4.
    Type of Error RANDOMERRORS refer to random fluctuations in the measured data due to:  The readability of the instrument  The effects of something changing in the surroundings between measurements  The observer being less than perfect SYSTEMATIC ERRORS refer to reproducible fluctuations consistently in the same direction due to:  An instrument being wrongly calibrated  An instrument with zero error (it does not read zero when it should – to correct for this, the value should be subtracted from every reading)  The observer being less than perfect in the same way during each measurement.
  • 5.
    ABSOLUTE AND PERCENTAGE UNCERTAINTIES Measurement =measured value ± uncertainty (unit of measurement) How?
  • 6.
    ABSOLUTE AND PERCENTAGE UNCERTAINTIES 1. Themin value of the smallest scale of the instrument (scale measurement Error) Example 1: The smallest scale is 0.1 cm Therefore, Δ L = 0.1/2 = 0.05cm The value of line is , L Δ L = 8.60 ±0.05 cm
  • 7.
    ABSOLUTE AND PERCENTAGE UNCERTAINTIES The smallestscale is 1 s Therefore, Δ t = 1/2 = 0.5 s The measurement 4.5 ± 0.5s Example 2:
  • 8.
    ABSOLUTE AND PERCENTAGE UNCERTAINTIES 2. Ifthe experimental has different value for repeating measurement, the uncertainty is associated with the average of deviation Example: a (mm) 1.55 1.52 1.54 1.53 <a> = (1.55 +1.52+1.54+1.53)/4=1.535 Deviation d1 = |1.55-1.535|=0.015 d2 = |1.52-1.535|=0.015 d3 = |1.54-1.535|=0.005 d4 = |1.53-1.535|=0.005 Average, <d> = (0.015+0.015+0.005+0.005)/4=0.01 The measurement, a = (1.535±0.010) mm
  • 9.
    ABSOLUTE AND PERCENTAGE UNCERTAINTIES 3. Ifwe know the standard value. The uncertainties normally we calculate the percentage relative error: Example: g measure = 10.0 m/s2 g standard = 9.81 m/s2 % error = |g measure−g standard| g standard x100% = 1.936%
  • 10.
    ABSOLUTE AND PERCENTAGE UNCERTAINTIES 4.For the graphical analysis of data, we use the maximum and minimum best-fit lines to determine the final uncertainty. Example: Gradient of best fit, m = 9.78 m/s2 Max gradient, mmax = 9.88 m/s2 Min gradient, mmin = 9.72 m/s2 Δ m = ½ (mmax - mmin ) Therefore, gradient m = (9.78± 0.08 ) m/s2 Same method for calculating the intercept
  • 11.
    ABSOLUTE AND PERCENTAGE UNCERTAINTIES 5. Sometimes,the final result involving mathematical equations, so we need to be concerned with how we treat uncertainties in calculated values using experimental data I. If data are to be added or subtracted, add the absolute uncertainty: A = p ± q , ΔA = Δp + Δ q Example: Mass of empty beaker is (50 ± 1 ) g Mass of beaker and water is (100 ± 1 ) g Mass of water = 100-50 = 50 g Error of m = 1+1 =2 g Therefore, mass of water = 50 ± 2 g
  • 12.
    ABSOLUTE AND PERCENTAGE UNCERTAINTIES II. Ifdata are to be multiplied or divided, add the percentage uncertainty: A = p x q , ΔA A = Δp p + Δ q q A = p / q, ΔA A = Δp p + Δ q q Example: the mass of water is mass of water = 50 ± 2 g. The volume of 2.1 ±0.1 m3. Density=? Error of density is Δρ ρ = Δm m + Δ V V =
  • 13.
    ABSOLUTE AND PERCENTAGE UNCERTAINTIES III. Ifdata are raised to a power, multiply the percentage uncertainty by that power: A = pn , ΔA A =n Δp p Example: A cylinder has a radius of 1.60 ± 0.01 cm and a height of 11.5 ± 0.1 cm. Find the volume. V = π r2 h = π (1.60)2 x 11.5 = 92.488 cm3 = 92 cm3 ΔV V =2 Δr r + Δℎ ℎ = 2 cm3 V is (92 ± 2 ) cm3
  • 14.
  • 15.
  • 16.
    Exercises In experiment simpleresistor, the following data obtain. Find the resistance and its uncertainty. Voltage (V) Current (A) 1 0.88 2 3 3 3.7 4 3.6 5 6.5 6 9 7 10.6 8 12.3 10 15
  • 18.
    18  A verniercaliper is used to measure an object with dimensions up to 12 cm with an accuracy of 0.01 cm.  Comprises of a main scale and a vernier scale. Examples of Measuring Instruments -Vernier Calliper
  • 19.
    19  The readingon the main scale is determined with reference to the `0' mark on the vernier scale.  The reading to be taken on the vernier scale is indicated by the mark on the vernier scale which is exactly in line or coincides with any main scale division line.
  • 20.
  • 21.
    ZSMAHMUD/UiTMCawanganPerakKampusTapah/PHY1 10 21 This instrument canbe used to measure diameters of wires and thicknesses of steel plates to an accuracy of 0.01 mm. Examples of Measuring Instruments -Micrometer Screw Gauge
  • 22.
    ZSMAHMUD/UiTMCawanganPerakKampusTapah/PHY1 10 22  The micrometerscale comprises a main scale marked on the sleeve and a scale marked on the thimble called the thimble scale.  One division on the thimble scale is 0.01 mm
  • 23.
  • 24.
    Conclusion: !!!!!!Measurement = measuredvalue ± uncertainty (unit of measurement) Or % Relative error = |g measure−g standard| g standard x100% !!!!!!