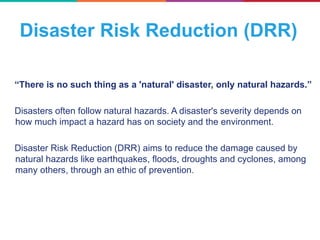
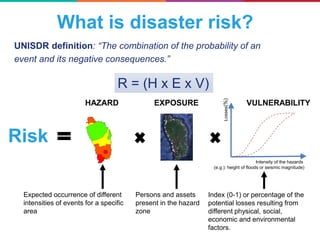
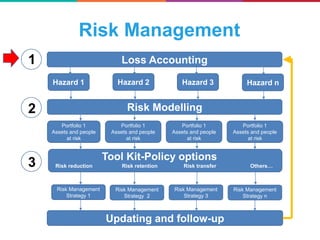
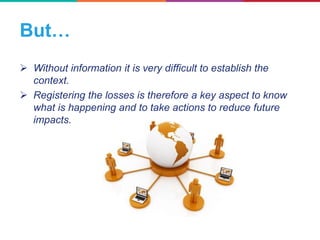
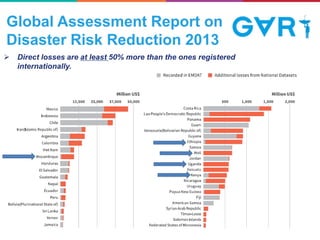
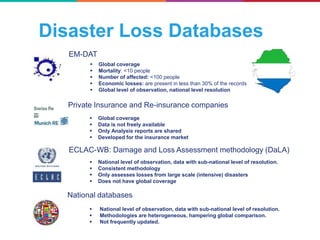
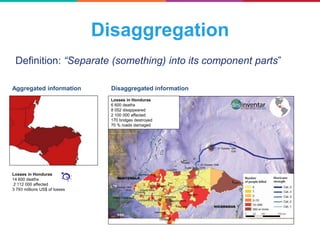
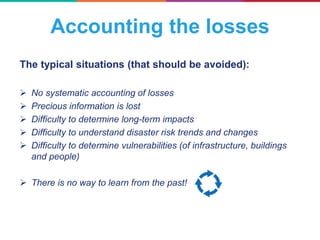
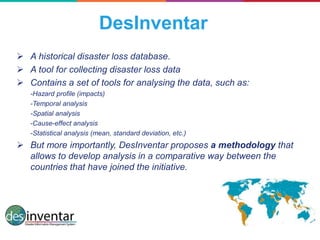
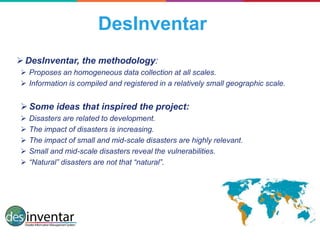
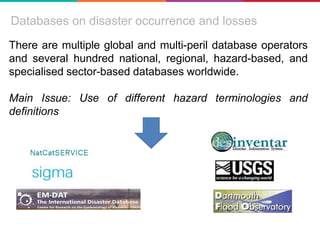
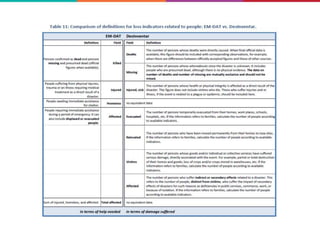
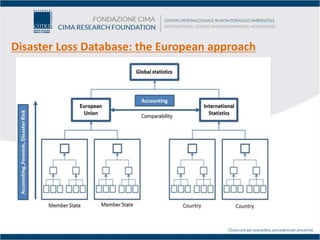
”
Collecting, Registering and Harind
Disaster loss Data
An Overview of DesInventar
Methodology and EU Guidelines
Marco Massabò, Ph.D.
CIMA Research Foundation
Disasters: UNISDR definition
A serious disruption of the functioning of a community
or a society involving widespread human, material,
economic or environmental losses and impacts, which
exceeds the ability of the affected community or society
to cope using its own resources.
There is not general agreement on the definition,
disaster are events that generate any kind of
damages or losses
Disasters are not that
“natural”
A debate opposed Rousseau and Voltaire regarding the earthquake
of Lisbon in November 1755 (more than 60’000 deaths).
“You say, seeing this mass of victims: Is God’s revenge, they
are paying the price for their crimes?"
Voltaire, December 1755
"Without leaving your subject regarding Lisbon, agree, for example, that nature had not
collected there twenty thousand houses of six to seven floors; and if the people of this great
city had been more equally dispersed and more lightly lodged, the damage would have been
much less, even perhaps zero.”
J.J. Rousseau 18 August 1756
Less than one year later, Lisbon was already clear from its ruins and in
reconstruction process.
Buildings constructed under the Pombal regulations figure among the first
examples of earthquake-resistant buildings in the world.
Disasters are not that
“natural”
Disaster Risk Reduction (DRR)
“There is no such thing as a 'natural' disaster, only natural hazards.”
Disasters often follow natural hazards. A disaster's severity depends on
how much impact a hazard has on society and the environment.
Disaster Risk Reduction (DRR) aims to reduce the damage caused by
natural hazards like earthquakes, floods, droughts and cyclones, among
many others, through an ethic of prevention.
The scale of the impact of a disaster, in turn, depends on different factors
that are linked to human activities. Some examples:
Development and effective implementation of building codes.
Land use regulations.
Institutional organization and policy.
Education and knowledge development.
Public awareness and early warning.
Finance and contingency planning.
 Each decision and action makes us more vulnerable to disasters -
or more resilient to them.
Disaster Risk Reduction (DRR)
Good
DRR
Bad
DRR
RiskVulnerability Resilience
Disaster Risk Reduction (DRR)
In some cases, it is difficult to avoid hazards. However, we can reduce the risks that are
related to them, reducing the impact of disasters. Therefore, DRR has to be considered
in all the phases of the disaster risk management (DRM) cycle.
Disaster Risk Reduction (DRR)
Relief
Contingency
and
risk financing
Risk
knowledge
and education
Preparedness
and
mitigation
Disaster
Early warning Recovery
DRM
DRR
DRRDRR
DRR
DRR DRR
Making development sustainable: the future of
disaster risk management
http://www.unisdr.org/we/inform/publications/42809
Economic losses in Europe
Three consecutive years: annual economic losses have
exceeded $100 billion globally due to enormous increase
in exposure of industrial assets and private property to
extreme disaster events.
Europe’s 10-year average of disaster losses totaling to
US$ 13.4 billion makes it the third most affected region
in the world after the Americas and Asia;
The Global Assessment Report on Disaster Risk Reduction released in 2011
indicates that in OECD countries disaster economic losses tend to grow
faster than their average GDP growth;
Most of the damages are due to climatological and hydrometeorological events;
Reduced number of casualties, but high economic losses.
Italy: a disaster prone country
The largest Cultural Heritage patrimonium
worldwide
Emilia Romagna Earthquake 2012
Side effects – financial impact
Biomedical factories
Ceramics
Parmesan
Balsamic vinegar
fodder for livestock
.....
1,5% GDPGross Domestic Product
Serbia Flood 2014
• The private sector sustained higher values of
destroyed assets than the public sector, and that
production losses were higher in the public
sector domain because of the impact on the
mining and energy sector
• Social impact
Summary of estimated damages and losses
Source: SERBIA FLOODS 2014
Serbia Flood 2014
Sector Post-Disaster Needs, million EUR
Recovery Reconstruction Total*
Agriculture 40.8 111.4 152.1
Manufacturing 16.6 53.3 69.8
Trade 12.9 144.0 157.0
Tourism 0.5 0.7 1.2
Mining and energy 211.8 202.0 413.8
Housing 58.8 204.5 263.3
Education 2.0 4.3 6.3
Health 2.7 4.4 7.1
Culture 0.1 1.2 1.3
Transport - 128.2 128.2
Communications - 12.6 12.6
Waterand sanitation 3.5 24.0 27.5
Environment 2.8 38.7 41.5
Governance 2.3 14.1 16.4
Employment 46.4 46.4
Gender 2.0 2.0
Totals 403.0 943.5 1,346.4
Summary of estimated recovery and reconstruction needs
• Recession of 0,5% instead of growth 0,5%1% GDP
• Reduction od exportation and increasing of importations
results in 1% of GDP
• Fiscal position will deteriorate further by about 1% of GDP
Only 2% of damage and losses covered by insurance and
reinsurance (source Ministry of Finance of Serbia)
The topic raising at the top
of the international agenda:
Attendance to the WCDRR
Innovations
• Shift from disaster loss to disaster risk
• Shift from disaster management to disaster risk
management;
• Shift from “what to do?” to “how to do?”
• Focus on people-centred preventive approach to DRR
• Primary responsibility of States for DRR
• Shared responsibility for DRR with stakeholders
• Scope includes slow-onset, man-made and bio hazards;
• Set of global targets; Set of guiding principles;
• Promoting Coherence across post-2015 development
agenda
Innovations
• Articulation of governance to manage disaster risk,
including role of national platforms;
• Understanding, tackling disaster risk drivers;
• Preparedness to “build back better”;
• Strengthened accountability for disaster risk management;
• Recognition of stakeholders and their roles;
• Mobilization of risk-sensitive investment;
• Global and Regional Platforms vehicles for coherence,
monitoring and periodic reviews;
• Resilience of health infrastructures, cultural heritage, and
work places;
Expected Outcome
• Focus on disaster risk in addition to earlier focus on
disaster loss in Hyogo Framework for Action (HFA)
• Focus on livelihoods, health and physical and cultural
assets, in addition to lives and social, economic and
environmental assets
“The substantial reduction of disaster risk and losses in lives,
livelihoods and health and in the economic, physical, social,
cultural and environmental assets of persons, businesses,
communities and countries” (paragraph 16)
Goal
• Focus on preventing new disaster risks, reducing
existing disaster risks that also strengthen resilience
• Calls various measures to prevent and reduce hazard
exposure and vulnerability, increase preparedness and
recovery
“Prevent new and reduce existing disaster risk through the
implementation of integrated and inclusive economic, structural,
legal, social, health, cultural, educational, environmental,
technological, political and institutional measures that prevent and
reduce hazard exposure and vulnerability to disaster, increase
preparedness for response and recovery, and thus strengthen
resilience” (paragraph 17)
What is disaster risk?
UNISDR definition: “The combination of the probability of an
event and its negative consequences.”
Intensity of the hazards
(e.g.): height of floods or seismic magnitude)
Losses(%)
Risk
Expected occurrence of different
intensities of events for a specific
area
Persons and assets
present in the hazard
zone
Index (0-1) or percentage of the
potential losses resulting from
different physical, social,
economic and environmental
factors.
HAZARD EXPOSURE VULNERABILITY
R = (H x E x V)
Risk Assessment
HAZARD, EXPOSURE AND VULNERABILITY
Landslide Risk
HAZARD EXPOSURE VULNERABILITY
What is disaster risk?
Volcanic Risk
HAZARD EXPOSURE VULNERABILITY
What is disaster risk?
 Risk assessments: a way of reducing disaster impacts?
What is disaster risk?
Risk Assessments are the methodology for determining the
nature and the extent of risks.
How? By examining the technical characteristics of the hazards such as
their localisation, their intensity, their frequency and their probability.
Moreover, it’s about the analysis of the social exposure and vulnerability,
including physical, economic, environmental and health factors. This allows
to evaluate the efficiency of the capacities to respond and to cope with the
probable risks.
• Implies a large amount of information
• Complex models are needed
• Focuses in certain hazards
• Varies over time!
Risk Management
Loss Accounting
Risk Modelling
Hazard 1 Hazard 2 Hazard 3 Hazard n
Portfolio 1
Assets and people
at risk
Risk retention Risk transferRisk reduction Others…
Updating and follow-up
Risk Management
Strategy 1
Risk Management
Strategy 2
Risk Management
Strategy 3
Risk Management
Strategy n
Portfolio 1
Assets and people
at risk
Portfolio 1
Assets and people
at risk
Portfolio 1
Assets and people
at risk
1
2
3 Tool Kit-Policy options
But…
 Without information it is very difficult to establish the
context.
 Registering the losses is therefore a key aspect to know
what is happening and to take actions to reduce future
impacts.
Global Assessment Report on
Disaster Risk Reduction 2013
 Direct losses are at least 50% more than the ones registered
internationally.
Disaster Loss Databases
EM-DAT
Private Insurance and Re-insurance companies
ECLAC-WB: Damage and Loss Assessment methodology (DaLA)
National databases
 Global coverage
 Data is not freely available
 Only Analysis reports are shared
 Developed for the insurance market
 National level of observation, data with sub-national level of resolution.
 Methodologies are heterogeneous, hampering global comparison.
 Not frequently updated.
 National level of observation, data with sub-national level of resolution.
 Consistent methodology
 Only assesses losses from large scale (intensive) disasters
 Does not have global coverage
 Global coverage
 Mortality: <10 people
 Number of affected: <100 people
 Economic losses: are present in less than 30% of the records
 Global level of observation, national level resolution
EM-DAT Profile: Belarus
 Frequency (number of events
registered)
EM-DAT Profile: Belarus
 Mortality (number of deaths)
EM-DAT Profile: Belarus
 Affected people (number of affected)
EM-DAT Profile: Belarus
 Economic Loss (Damages in US$ millions)
Disaggregation
Definition: “Separate (something) into its component parts”
Losses in Honduras
6 600 deaths
8 052 disappeared
2 100 000 affected
170 bridges destroyed
70 % roads damaged
Losses in Honduras
14 600 deaths
2 112 000 affected
3 793 millions US$ of losses
Aggregated information Disaggregated information
Extensive and Intensive disasters
Intensive disasters: is used to describe high-severity, mid to low-frequency disasters,
mainly associated with major hazards.
Extensive disasters: is used to describe low-severity, high-frequency disasters, mainly but
not exclusively associated with highly localized hazards.
After a series of statistical and mathematical analyses, the thresholds for extensive disaster
finally obtained that an extensive disaster is when:
 Mortality: less than 30 people killed.
 Housing destruction: less than 600 houses destroyed
100 – 1 000
1 000 – 10 000
1
1- 10
10 – 100
> 10 000
No data
Extensive Intensive
Frequency 10
times per year
Frequency 1
time every 10
years
Frequency 1
time every
10’000 years
1 million USD 1 billion
USD
Extensive
Intensive
High frequency
Low severity
Low frequency
High severity
Extensive and Intensive disasters
Extensive and Intensive Risk Management
Loss Accounting
Risk Modelling
Hazard 1 Hazard 2 Hazard 3 Hazard n
Portfolio 1
Assets and people
at risk
Risk retention Risk transferRisk reduction Others…
Updating and follow-up
Risk Management
Strategy 1
Risk Management
Strategy 2
Risk Management
Strategy 3
Risk Management
Strategy n
Portfolio 1
Assets and people
at risk
Portfolio 1
Assets and people
at risk
Portfolio 1
Assets and people
at risk
Tool Kit-Policy options
Extensive
Intensive
Extensive and Intensive disasters
The risk we will have “to live
with…”
4
Residual
risk
4
Residual
risk
High frequency
Low severity
Low frequency
High severity
1
Risk
reduction
Risk
reduction
1
Corrective: Building retrofitting,
mitigation strategies.
2
Risk
retention2 Risk
retention
Prospective: Financial reserves,
public investment, laws and
regulations.
Compensatory: Insurance,
contingency funds.
3
Risk
transfer
3 Risk
transfer
The typical situations (that should be avoided):
 No systematic accounting of losses
 Precious information is lost
 Difficulty to determine long-term impacts
 Difficulty to understand disaster risk trends and changes
 Difficulty to determine vulnerabilities (of infrastructure, buildings
and people)
 There is no way to learn from the past!
Accounting the losses
DesInventar
 A historical disaster loss database.
 A tool for collecting disaster loss data
 Contains a set of tools for analysing the data, such as:
-Hazard profile (impacts)
-Temporal analysis
-Spatial analysis
-Cause-effect analysis
-Statistical analysis (mean, standard deviation, etc.)
 But more importantly, DesInventar proposes a methodology that
allows to develop analysis in a comparative way between the
countries that have joined the initiative.
DesInventar
DesInventar, the methodology:
 Proposes an homogeneous data collection at all scales.
 Information is compiled and registered in a relatively small geographic scale.
Some ideas that inspired the project:
 Disasters are related to development.
 The impact of disasters is increasing.
 The impact of small and mid-scale disasters are highly relevant.
 Small and mid-scale disasters reveal the vulnerabilities.
 “Natural” disasters are not that “natural”.
Databases on disaster occurrence and losses
There are multiple global and multi-peril database operators
and several hundred national, regional, hazard-based, and
specialised sector-based databases worldwide.
Main Issue: Use of different hazard terminologies and
definitions
DesInventar
(data from 1851
- 2013)
DesInventa
r (data from
1980 -
2010)
EM-DAT (data
from 1980 -
2010)
Number of
events
4,305 2,746 23
Number of
people killed
1,652 484 163
The event with
the highest
mortality
Earthquake Snowstorm Extreme temperature
Economic
damage ($ X
1,000)
95,552 89,758 24,673
The event with
the highest
economic loss
Flood of 2010
Floods and flash
floods of 2010
Flood of 2002
The most
frequent events
Forest fires (957 events)
Forest fires
(662)
Floods (9 events)
Recommendations
 Choose an optimal scale and the administrative boundaries
 Select specific names and codes
 Search for data from 1980 or 1990
 Select the sources
How to do if…
 Disaggregated data is not available?
 There are differences between the sources regarding the same
event?
 If an event is followed by another event?
 If an event hits different geographical units?
 Slow-onset events?
DesInventar
Situation in Europe
5521 December 2015
Main differences
• Data structure
• Methodology/standard used
• Mandated organizations
• Hazard types covered
…revealed so far
Detected activites in loss recording
Planning loss database
Important similarities
• At least municipality scale
• By sectors
…sometimes there is even more than one
initative within a country, usually not related,
to serve different application areas
(governemntal, academic, insurances, …)
Detected activites in loss recording but
no contacts
Disaster loss data are key for DRR
Loss Data is important for DRR
• Carnegie meeting 2012
• Global Platform for DRR
• EU-US dialogue
Existing initiatives
• CRED EM-DAT
• UN: UNDP, UNISDR (GAR)
• IRDR Loss Data WG
• Insurance industry
• PDNA, DALA
Loss data for DRR: accounting
• Prioritize DRR actions
• Assess effectiveness of DRR
Loss data beyond DRR
• Risk modelling
 Validation and calibration
• Forensics
 What went wrong?
• Accounting
 Risk transfer, Solidarity Fund,
etc.
5621 December 2015
Study of Commission: opportunities
and challenges in EU context
• Why loss data: various policies in EU
• What is loss data: definitions, scope of work
 Direct, indirect, private, public, etc.
• Conceptual model
 3 application areas: accounting, forensics, risk assessment
 Dimensions: Scale (precision) and scope (coverage)
• State of the art: ISDR, EM-DAT, DALA, MunichRe, UNDP, US,
SL
• Technical recommendation: using existing standards
• Implementation issues: options, given existing systems in MS
• Way forward: dedicated working group with MS
5721 December 2015
Applications: more than accounting
5821 December 2015
Disaster Loss Database: the European approach
EU guidelines - JRC – European Commission
1. Recommendations of technical
requirements for recording disaster losses
at EU level, 2013
2. Current status and Best Practices for
Disaster Loss Data recording in EU Member
States, 2014
3. Guidance for recording and sharing Disaster
Damage and Loss Data, 2015
Guidance for recording and sharing Disaster Damage and
Loss Data, 2015
1. Propose a minimum set of loss indicators for
sharing loss data among organizations, among
Member States and with EU and international
institutions
2. Recommends simplified aggregate figures
following a common data exchange format
3. Address not only national levels but also
subnational and extends to the European and
international dimensions of disaster loss
recording
Time for questions?
Thanks

Massabo lecture day 6

  • 1.
    ” Collecting, Registering andHarind Disaster loss Data An Overview of DesInventar Methodology and EU Guidelines Marco Massabò, Ph.D. CIMA Research Foundation
  • 2.
    Disasters: UNISDR definition Aserious disruption of the functioning of a community or a society involving widespread human, material, economic or environmental losses and impacts, which exceeds the ability of the affected community or society to cope using its own resources. There is not general agreement on the definition, disaster are events that generate any kind of damages or losses
  • 3.
    Disasters are notthat “natural” A debate opposed Rousseau and Voltaire regarding the earthquake of Lisbon in November 1755 (more than 60’000 deaths). “You say, seeing this mass of victims: Is God’s revenge, they are paying the price for their crimes?" Voltaire, December 1755 "Without leaving your subject regarding Lisbon, agree, for example, that nature had not collected there twenty thousand houses of six to seven floors; and if the people of this great city had been more equally dispersed and more lightly lodged, the damage would have been much less, even perhaps zero.” J.J. Rousseau 18 August 1756
  • 4.
    Less than oneyear later, Lisbon was already clear from its ruins and in reconstruction process. Buildings constructed under the Pombal regulations figure among the first examples of earthquake-resistant buildings in the world. Disasters are not that “natural”
  • 5.
    Disaster Risk Reduction(DRR) “There is no such thing as a 'natural' disaster, only natural hazards.” Disasters often follow natural hazards. A disaster's severity depends on how much impact a hazard has on society and the environment. Disaster Risk Reduction (DRR) aims to reduce the damage caused by natural hazards like earthquakes, floods, droughts and cyclones, among many others, through an ethic of prevention.
  • 6.
    The scale ofthe impact of a disaster, in turn, depends on different factors that are linked to human activities. Some examples: Development and effective implementation of building codes. Land use regulations. Institutional organization and policy. Education and knowledge development. Public awareness and early warning. Finance and contingency planning.  Each decision and action makes us more vulnerable to disasters - or more resilient to them. Disaster Risk Reduction (DRR)
  • 7.
  • 8.
    In some cases,it is difficult to avoid hazards. However, we can reduce the risks that are related to them, reducing the impact of disasters. Therefore, DRR has to be considered in all the phases of the disaster risk management (DRM) cycle. Disaster Risk Reduction (DRR) Relief Contingency and risk financing Risk knowledge and education Preparedness and mitigation Disaster Early warning Recovery DRM DRR DRRDRR DRR DRR DRR
  • 9.
    Making development sustainable:the future of disaster risk management http://www.unisdr.org/we/inform/publications/42809
  • 11.
    Economic losses inEurope Three consecutive years: annual economic losses have exceeded $100 billion globally due to enormous increase in exposure of industrial assets and private property to extreme disaster events. Europe’s 10-year average of disaster losses totaling to US$ 13.4 billion makes it the third most affected region in the world after the Americas and Asia; The Global Assessment Report on Disaster Risk Reduction released in 2011 indicates that in OECD countries disaster economic losses tend to grow faster than their average GDP growth; Most of the damages are due to climatological and hydrometeorological events; Reduced number of casualties, but high economic losses.
  • 12.
    Italy: a disasterprone country
  • 13.
    The largest CulturalHeritage patrimonium worldwide
  • 14.
    Emilia Romagna Earthquake2012 Side effects – financial impact Biomedical factories Ceramics Parmesan Balsamic vinegar fodder for livestock ..... 1,5% GDPGross Domestic Product
  • 15.
    Serbia Flood 2014 •The private sector sustained higher values of destroyed assets than the public sector, and that production losses were higher in the public sector domain because of the impact on the mining and energy sector • Social impact Summary of estimated damages and losses Source: SERBIA FLOODS 2014
  • 16.
    Serbia Flood 2014 SectorPost-Disaster Needs, million EUR Recovery Reconstruction Total* Agriculture 40.8 111.4 152.1 Manufacturing 16.6 53.3 69.8 Trade 12.9 144.0 157.0 Tourism 0.5 0.7 1.2 Mining and energy 211.8 202.0 413.8 Housing 58.8 204.5 263.3 Education 2.0 4.3 6.3 Health 2.7 4.4 7.1 Culture 0.1 1.2 1.3 Transport - 128.2 128.2 Communications - 12.6 12.6 Waterand sanitation 3.5 24.0 27.5 Environment 2.8 38.7 41.5 Governance 2.3 14.1 16.4 Employment 46.4 46.4 Gender 2.0 2.0 Totals 403.0 943.5 1,346.4 Summary of estimated recovery and reconstruction needs • Recession of 0,5% instead of growth 0,5%1% GDP • Reduction od exportation and increasing of importations results in 1% of GDP • Fiscal position will deteriorate further by about 1% of GDP Only 2% of damage and losses covered by insurance and reinsurance (source Ministry of Finance of Serbia)
  • 17.
    The topic raisingat the top of the international agenda: Attendance to the WCDRR
  • 20.
    Innovations • Shift fromdisaster loss to disaster risk • Shift from disaster management to disaster risk management; • Shift from “what to do?” to “how to do?” • Focus on people-centred preventive approach to DRR • Primary responsibility of States for DRR • Shared responsibility for DRR with stakeholders • Scope includes slow-onset, man-made and bio hazards; • Set of global targets; Set of guiding principles; • Promoting Coherence across post-2015 development agenda
  • 21.
    Innovations • Articulation ofgovernance to manage disaster risk, including role of national platforms; • Understanding, tackling disaster risk drivers; • Preparedness to “build back better”; • Strengthened accountability for disaster risk management; • Recognition of stakeholders and their roles; • Mobilization of risk-sensitive investment; • Global and Regional Platforms vehicles for coherence, monitoring and periodic reviews; • Resilience of health infrastructures, cultural heritage, and work places;
  • 22.
    Expected Outcome • Focuson disaster risk in addition to earlier focus on disaster loss in Hyogo Framework for Action (HFA) • Focus on livelihoods, health and physical and cultural assets, in addition to lives and social, economic and environmental assets “The substantial reduction of disaster risk and losses in lives, livelihoods and health and in the economic, physical, social, cultural and environmental assets of persons, businesses, communities and countries” (paragraph 16)
  • 23.
    Goal • Focus onpreventing new disaster risks, reducing existing disaster risks that also strengthen resilience • Calls various measures to prevent and reduce hazard exposure and vulnerability, increase preparedness and recovery “Prevent new and reduce existing disaster risk through the implementation of integrated and inclusive economic, structural, legal, social, health, cultural, educational, environmental, technological, political and institutional measures that prevent and reduce hazard exposure and vulnerability to disaster, increase preparedness for response and recovery, and thus strengthen resilience” (paragraph 17)
  • 27.
    What is disasterrisk? UNISDR definition: “The combination of the probability of an event and its negative consequences.” Intensity of the hazards (e.g.): height of floods or seismic magnitude) Losses(%) Risk Expected occurrence of different intensities of events for a specific area Persons and assets present in the hazard zone Index (0-1) or percentage of the potential losses resulting from different physical, social, economic and environmental factors. HAZARD EXPOSURE VULNERABILITY R = (H x E x V)
  • 28.
  • 29.
    Landslide Risk HAZARD EXPOSUREVULNERABILITY What is disaster risk?
  • 30.
    Volcanic Risk HAZARD EXPOSUREVULNERABILITY What is disaster risk?
  • 31.
  • 32.
     Risk assessments:a way of reducing disaster impacts? What is disaster risk? Risk Assessments are the methodology for determining the nature and the extent of risks. How? By examining the technical characteristics of the hazards such as their localisation, their intensity, their frequency and their probability. Moreover, it’s about the analysis of the social exposure and vulnerability, including physical, economic, environmental and health factors. This allows to evaluate the efficiency of the capacities to respond and to cope with the probable risks. • Implies a large amount of information • Complex models are needed • Focuses in certain hazards • Varies over time!
  • 33.
    Risk Management Loss Accounting RiskModelling Hazard 1 Hazard 2 Hazard 3 Hazard n Portfolio 1 Assets and people at risk Risk retention Risk transferRisk reduction Others… Updating and follow-up Risk Management Strategy 1 Risk Management Strategy 2 Risk Management Strategy 3 Risk Management Strategy n Portfolio 1 Assets and people at risk Portfolio 1 Assets and people at risk Portfolio 1 Assets and people at risk 1 2 3 Tool Kit-Policy options
  • 34.
    But…  Without informationit is very difficult to establish the context.  Registering the losses is therefore a key aspect to know what is happening and to take actions to reduce future impacts.
  • 35.
    Global Assessment Reporton Disaster Risk Reduction 2013  Direct losses are at least 50% more than the ones registered internationally.
  • 36.
    Disaster Loss Databases EM-DAT PrivateInsurance and Re-insurance companies ECLAC-WB: Damage and Loss Assessment methodology (DaLA) National databases  Global coverage  Data is not freely available  Only Analysis reports are shared  Developed for the insurance market  National level of observation, data with sub-national level of resolution.  Methodologies are heterogeneous, hampering global comparison.  Not frequently updated.  National level of observation, data with sub-national level of resolution.  Consistent methodology  Only assesses losses from large scale (intensive) disasters  Does not have global coverage  Global coverage  Mortality: <10 people  Number of affected: <100 people  Economic losses: are present in less than 30% of the records  Global level of observation, national level resolution
  • 37.
    EM-DAT Profile: Belarus Frequency (number of events registered)
  • 38.
    EM-DAT Profile: Belarus Mortality (number of deaths)
  • 39.
    EM-DAT Profile: Belarus Affected people (number of affected)
  • 40.
    EM-DAT Profile: Belarus Economic Loss (Damages in US$ millions)
  • 41.
    Disaggregation Definition: “Separate (something)into its component parts” Losses in Honduras 6 600 deaths 8 052 disappeared 2 100 000 affected 170 bridges destroyed 70 % roads damaged Losses in Honduras 14 600 deaths 2 112 000 affected 3 793 millions US$ of losses Aggregated information Disaggregated information
  • 42.
    Extensive and Intensivedisasters Intensive disasters: is used to describe high-severity, mid to low-frequency disasters, mainly associated with major hazards. Extensive disasters: is used to describe low-severity, high-frequency disasters, mainly but not exclusively associated with highly localized hazards. After a series of statistical and mathematical analyses, the thresholds for extensive disaster finally obtained that an extensive disaster is when:  Mortality: less than 30 people killed.  Housing destruction: less than 600 houses destroyed 100 – 1 000 1 000 – 10 000 1 1- 10 10 – 100 > 10 000 No data Extensive Intensive
  • 43.
    Frequency 10 times peryear Frequency 1 time every 10 years Frequency 1 time every 10’000 years 1 million USD 1 billion USD Extensive Intensive High frequency Low severity Low frequency High severity Extensive and Intensive disasters
  • 44.
    Extensive and IntensiveRisk Management Loss Accounting Risk Modelling Hazard 1 Hazard 2 Hazard 3 Hazard n Portfolio 1 Assets and people at risk Risk retention Risk transferRisk reduction Others… Updating and follow-up Risk Management Strategy 1 Risk Management Strategy 2 Risk Management Strategy 3 Risk Management Strategy n Portfolio 1 Assets and people at risk Portfolio 1 Assets and people at risk Portfolio 1 Assets and people at risk Tool Kit-Policy options
  • 45.
    Extensive Intensive Extensive and Intensivedisasters The risk we will have “to live with…” 4 Residual risk 4 Residual risk High frequency Low severity Low frequency High severity 1 Risk reduction Risk reduction 1 Corrective: Building retrofitting, mitigation strategies. 2 Risk retention2 Risk retention Prospective: Financial reserves, public investment, laws and regulations. Compensatory: Insurance, contingency funds. 3 Risk transfer 3 Risk transfer
  • 46.
    The typical situations(that should be avoided):  No systematic accounting of losses  Precious information is lost  Difficulty to determine long-term impacts  Difficulty to understand disaster risk trends and changes  Difficulty to determine vulnerabilities (of infrastructure, buildings and people)  There is no way to learn from the past! Accounting the losses
  • 47.
    DesInventar  A historicaldisaster loss database.  A tool for collecting disaster loss data  Contains a set of tools for analysing the data, such as: -Hazard profile (impacts) -Temporal analysis -Spatial analysis -Cause-effect analysis -Statistical analysis (mean, standard deviation, etc.)  But more importantly, DesInventar proposes a methodology that allows to develop analysis in a comparative way between the countries that have joined the initiative.
  • 48.
    DesInventar DesInventar, the methodology: Proposes an homogeneous data collection at all scales.  Information is compiled and registered in a relatively small geographic scale. Some ideas that inspired the project:  Disasters are related to development.  The impact of disasters is increasing.  The impact of small and mid-scale disasters are highly relevant.  Small and mid-scale disasters reveal the vulnerabilities.  “Natural” disasters are not that “natural”.
  • 49.
    Databases on disasteroccurrence and losses There are multiple global and multi-peril database operators and several hundred national, regional, hazard-based, and specialised sector-based databases worldwide. Main Issue: Use of different hazard terminologies and definitions
  • 52.
    DesInventar (data from 1851 -2013) DesInventa r (data from 1980 - 2010) EM-DAT (data from 1980 - 2010) Number of events 4,305 2,746 23 Number of people killed 1,652 484 163 The event with the highest mortality Earthquake Snowstorm Extreme temperature Economic damage ($ X 1,000) 95,552 89,758 24,673 The event with the highest economic loss Flood of 2010 Floods and flash floods of 2010 Flood of 2002 The most frequent events Forest fires (957 events) Forest fires (662) Floods (9 events)
  • 53.
    Recommendations  Choose anoptimal scale and the administrative boundaries  Select specific names and codes  Search for data from 1980 or 1990  Select the sources How to do if…  Disaggregated data is not available?  There are differences between the sources regarding the same event?  If an event is followed by another event?  If an event hits different geographical units?  Slow-onset events? DesInventar
  • 54.
    Situation in Europe 5521December 2015 Main differences • Data structure • Methodology/standard used • Mandated organizations • Hazard types covered …revealed so far Detected activites in loss recording Planning loss database Important similarities • At least municipality scale • By sectors …sometimes there is even more than one initative within a country, usually not related, to serve different application areas (governemntal, academic, insurances, …) Detected activites in loss recording but no contacts
  • 55.
    Disaster loss dataare key for DRR Loss Data is important for DRR • Carnegie meeting 2012 • Global Platform for DRR • EU-US dialogue Existing initiatives • CRED EM-DAT • UN: UNDP, UNISDR (GAR) • IRDR Loss Data WG • Insurance industry • PDNA, DALA Loss data for DRR: accounting • Prioritize DRR actions • Assess effectiveness of DRR Loss data beyond DRR • Risk modelling  Validation and calibration • Forensics  What went wrong? • Accounting  Risk transfer, Solidarity Fund, etc. 5621 December 2015
  • 56.
    Study of Commission:opportunities and challenges in EU context • Why loss data: various policies in EU • What is loss data: definitions, scope of work  Direct, indirect, private, public, etc. • Conceptual model  3 application areas: accounting, forensics, risk assessment  Dimensions: Scale (precision) and scope (coverage) • State of the art: ISDR, EM-DAT, DALA, MunichRe, UNDP, US, SL • Technical recommendation: using existing standards • Implementation issues: options, given existing systems in MS • Way forward: dedicated working group with MS 5721 December 2015
  • 57.
    Applications: more thanaccounting 5821 December 2015
  • 58.
    Disaster Loss Database:the European approach
  • 59.
    EU guidelines -JRC – European Commission 1. Recommendations of technical requirements for recording disaster losses at EU level, 2013 2. Current status and Best Practices for Disaster Loss Data recording in EU Member States, 2014 3. Guidance for recording and sharing Disaster Damage and Loss Data, 2015
  • 60.
    Guidance for recordingand sharing Disaster Damage and Loss Data, 2015 1. Propose a minimum set of loss indicators for sharing loss data among organizations, among Member States and with EU and international institutions 2. Recommends simplified aggregate figures following a common data exchange format 3. Address not only national levels but also subnational and extends to the European and international dimensions of disaster loss recording
  • 61.