Downloaded 362 times


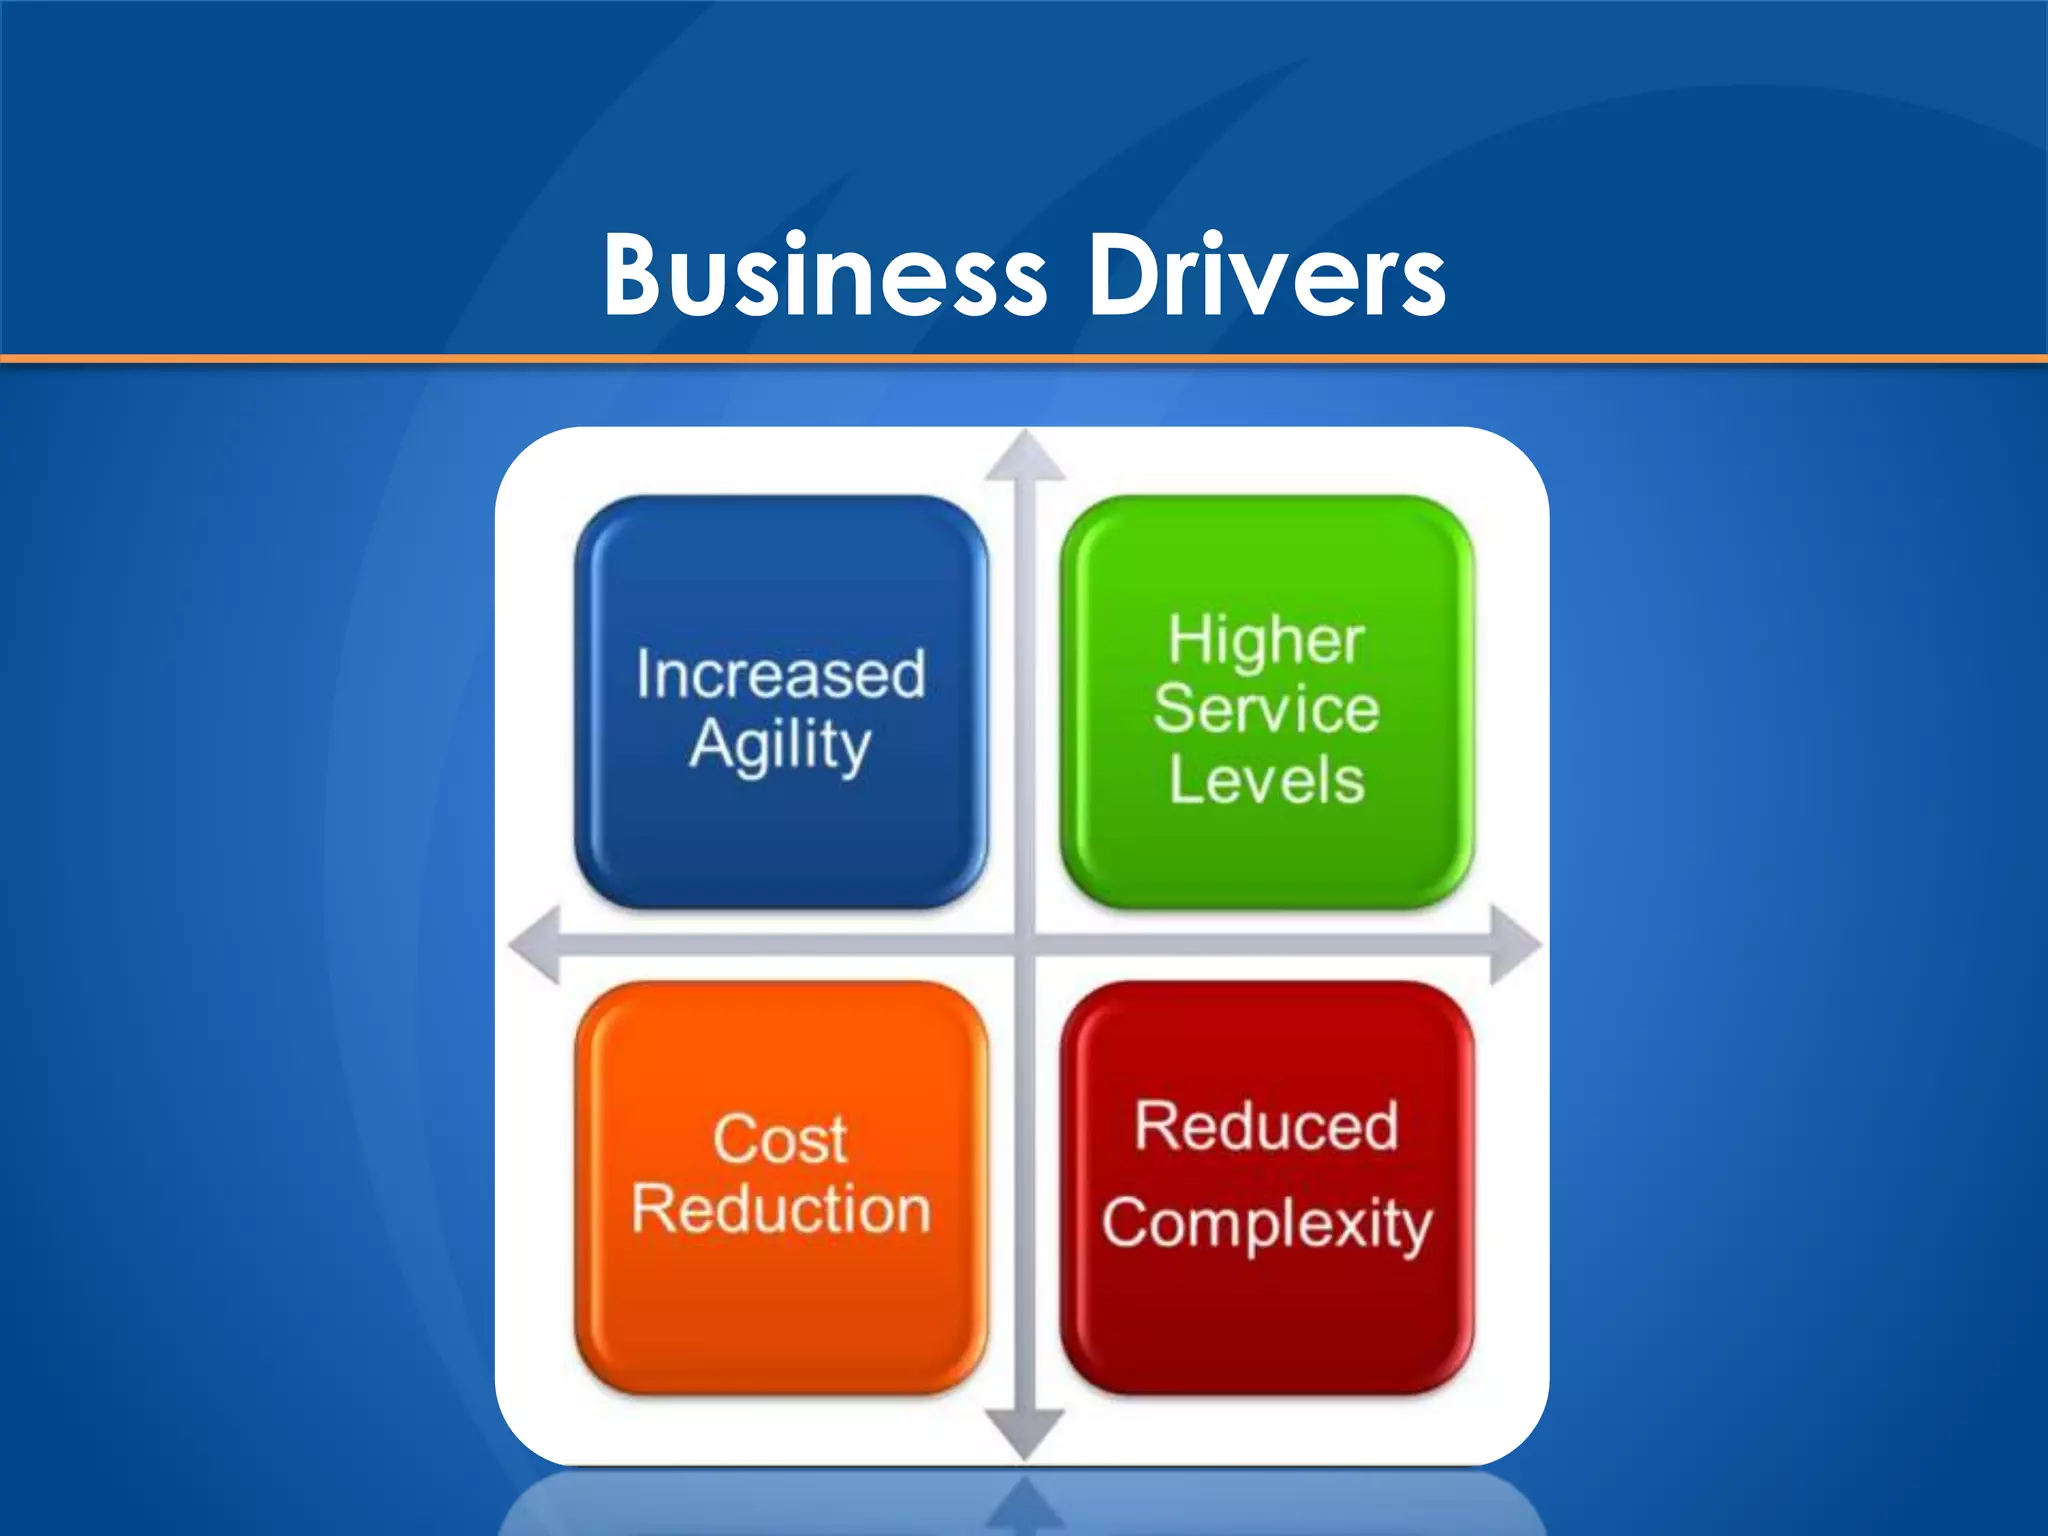
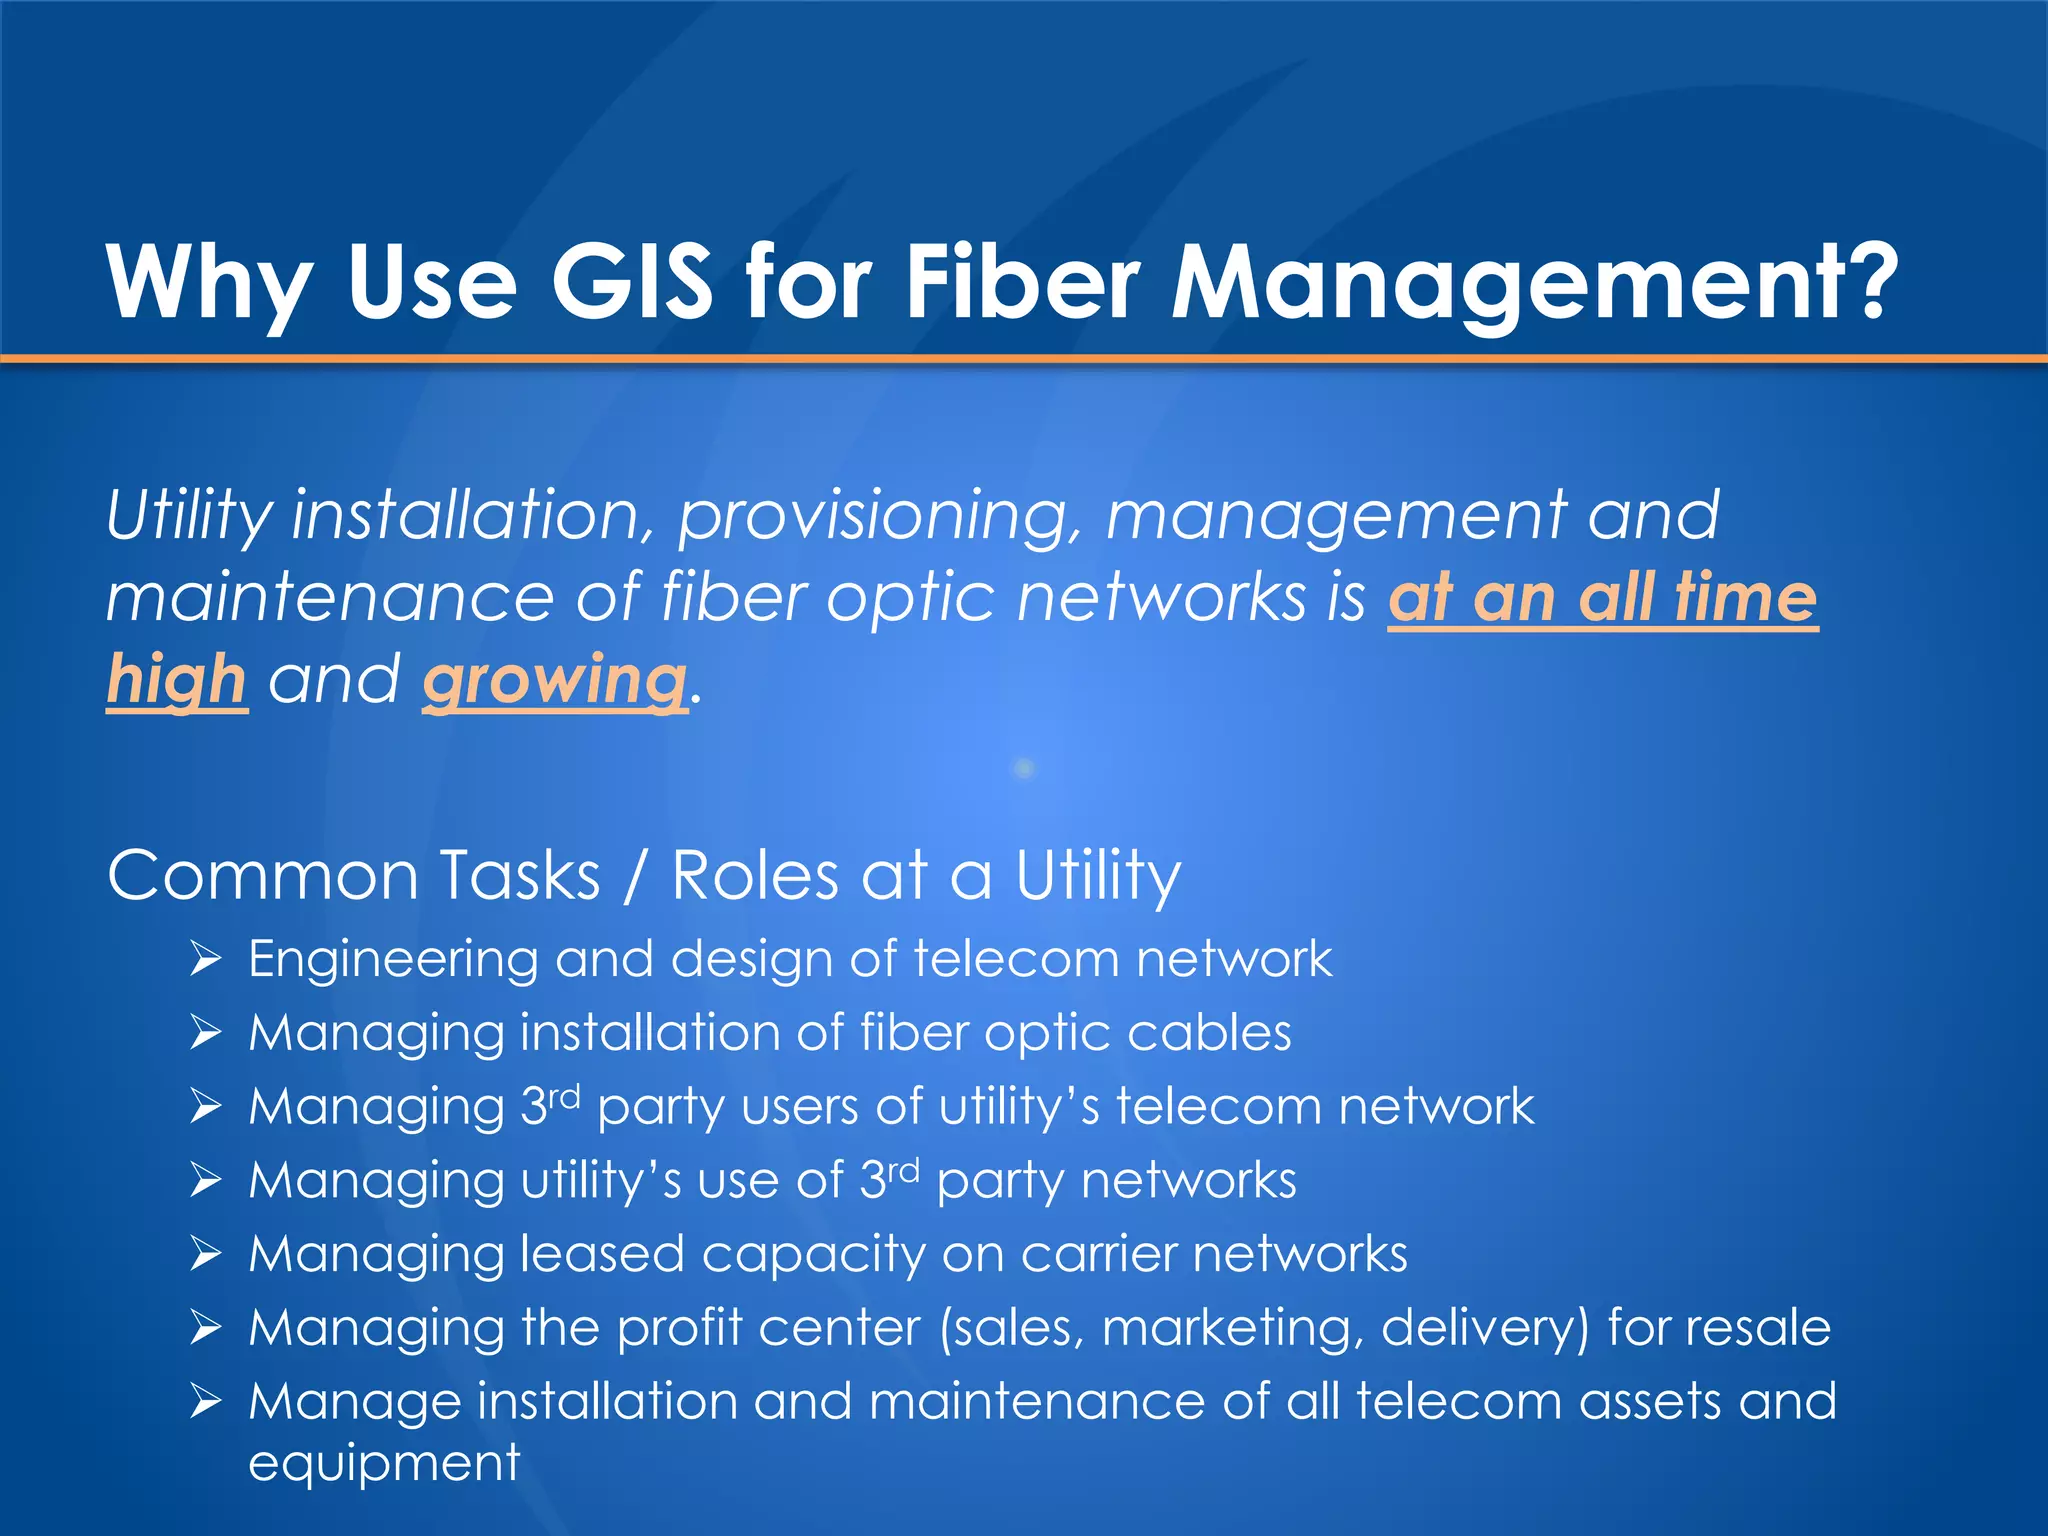
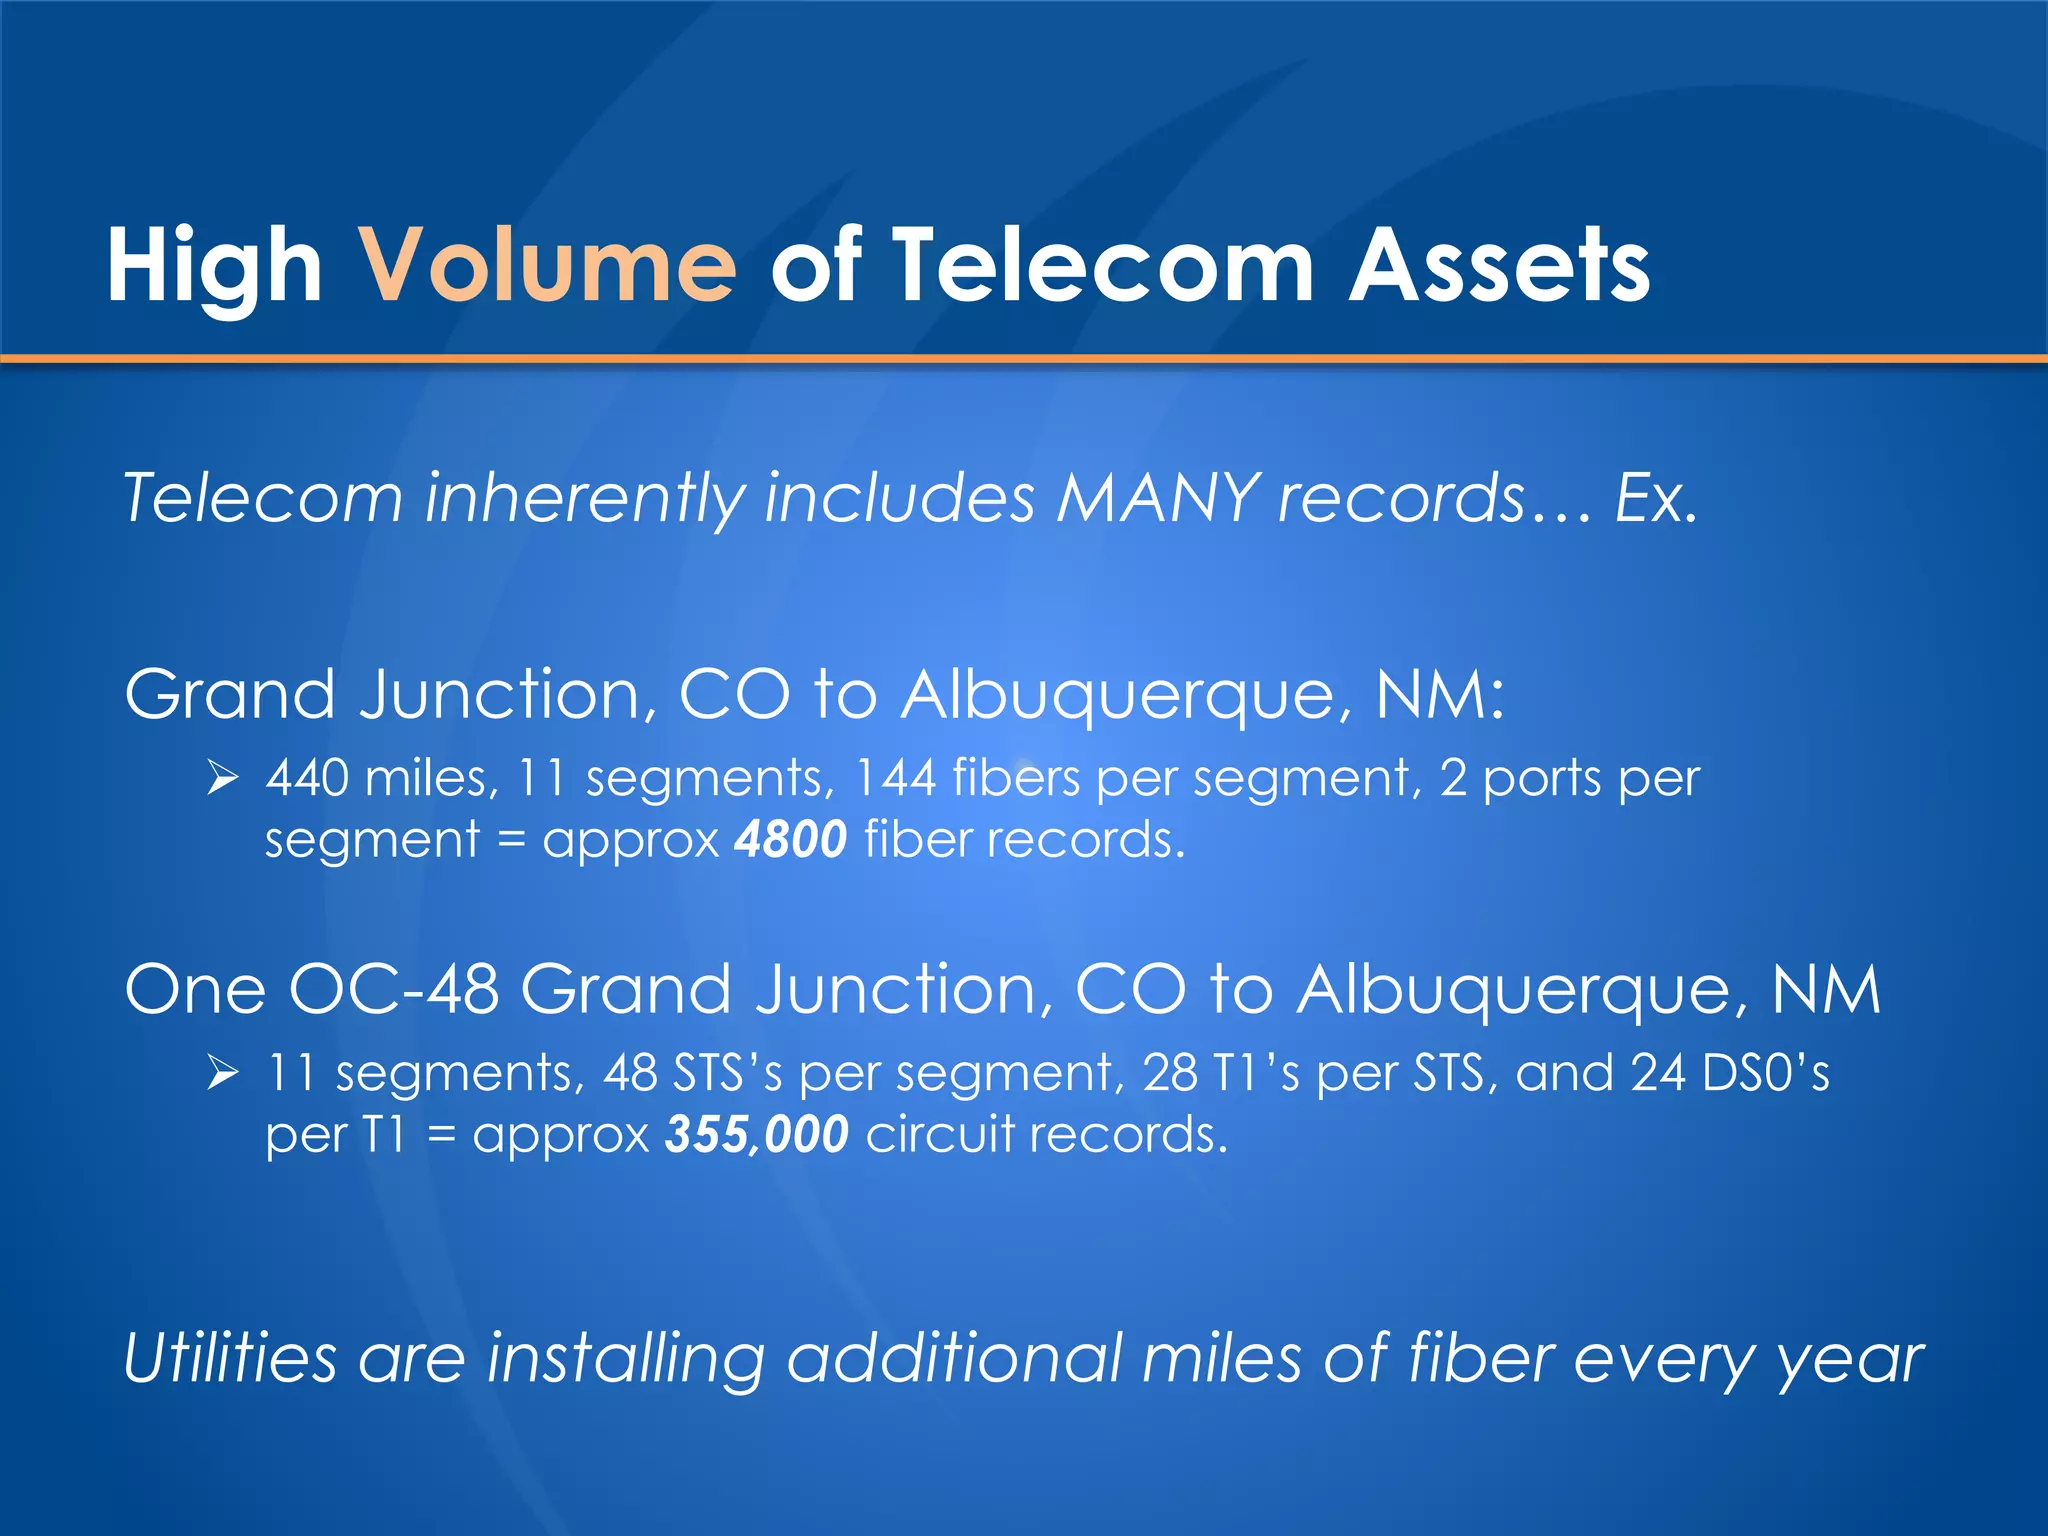

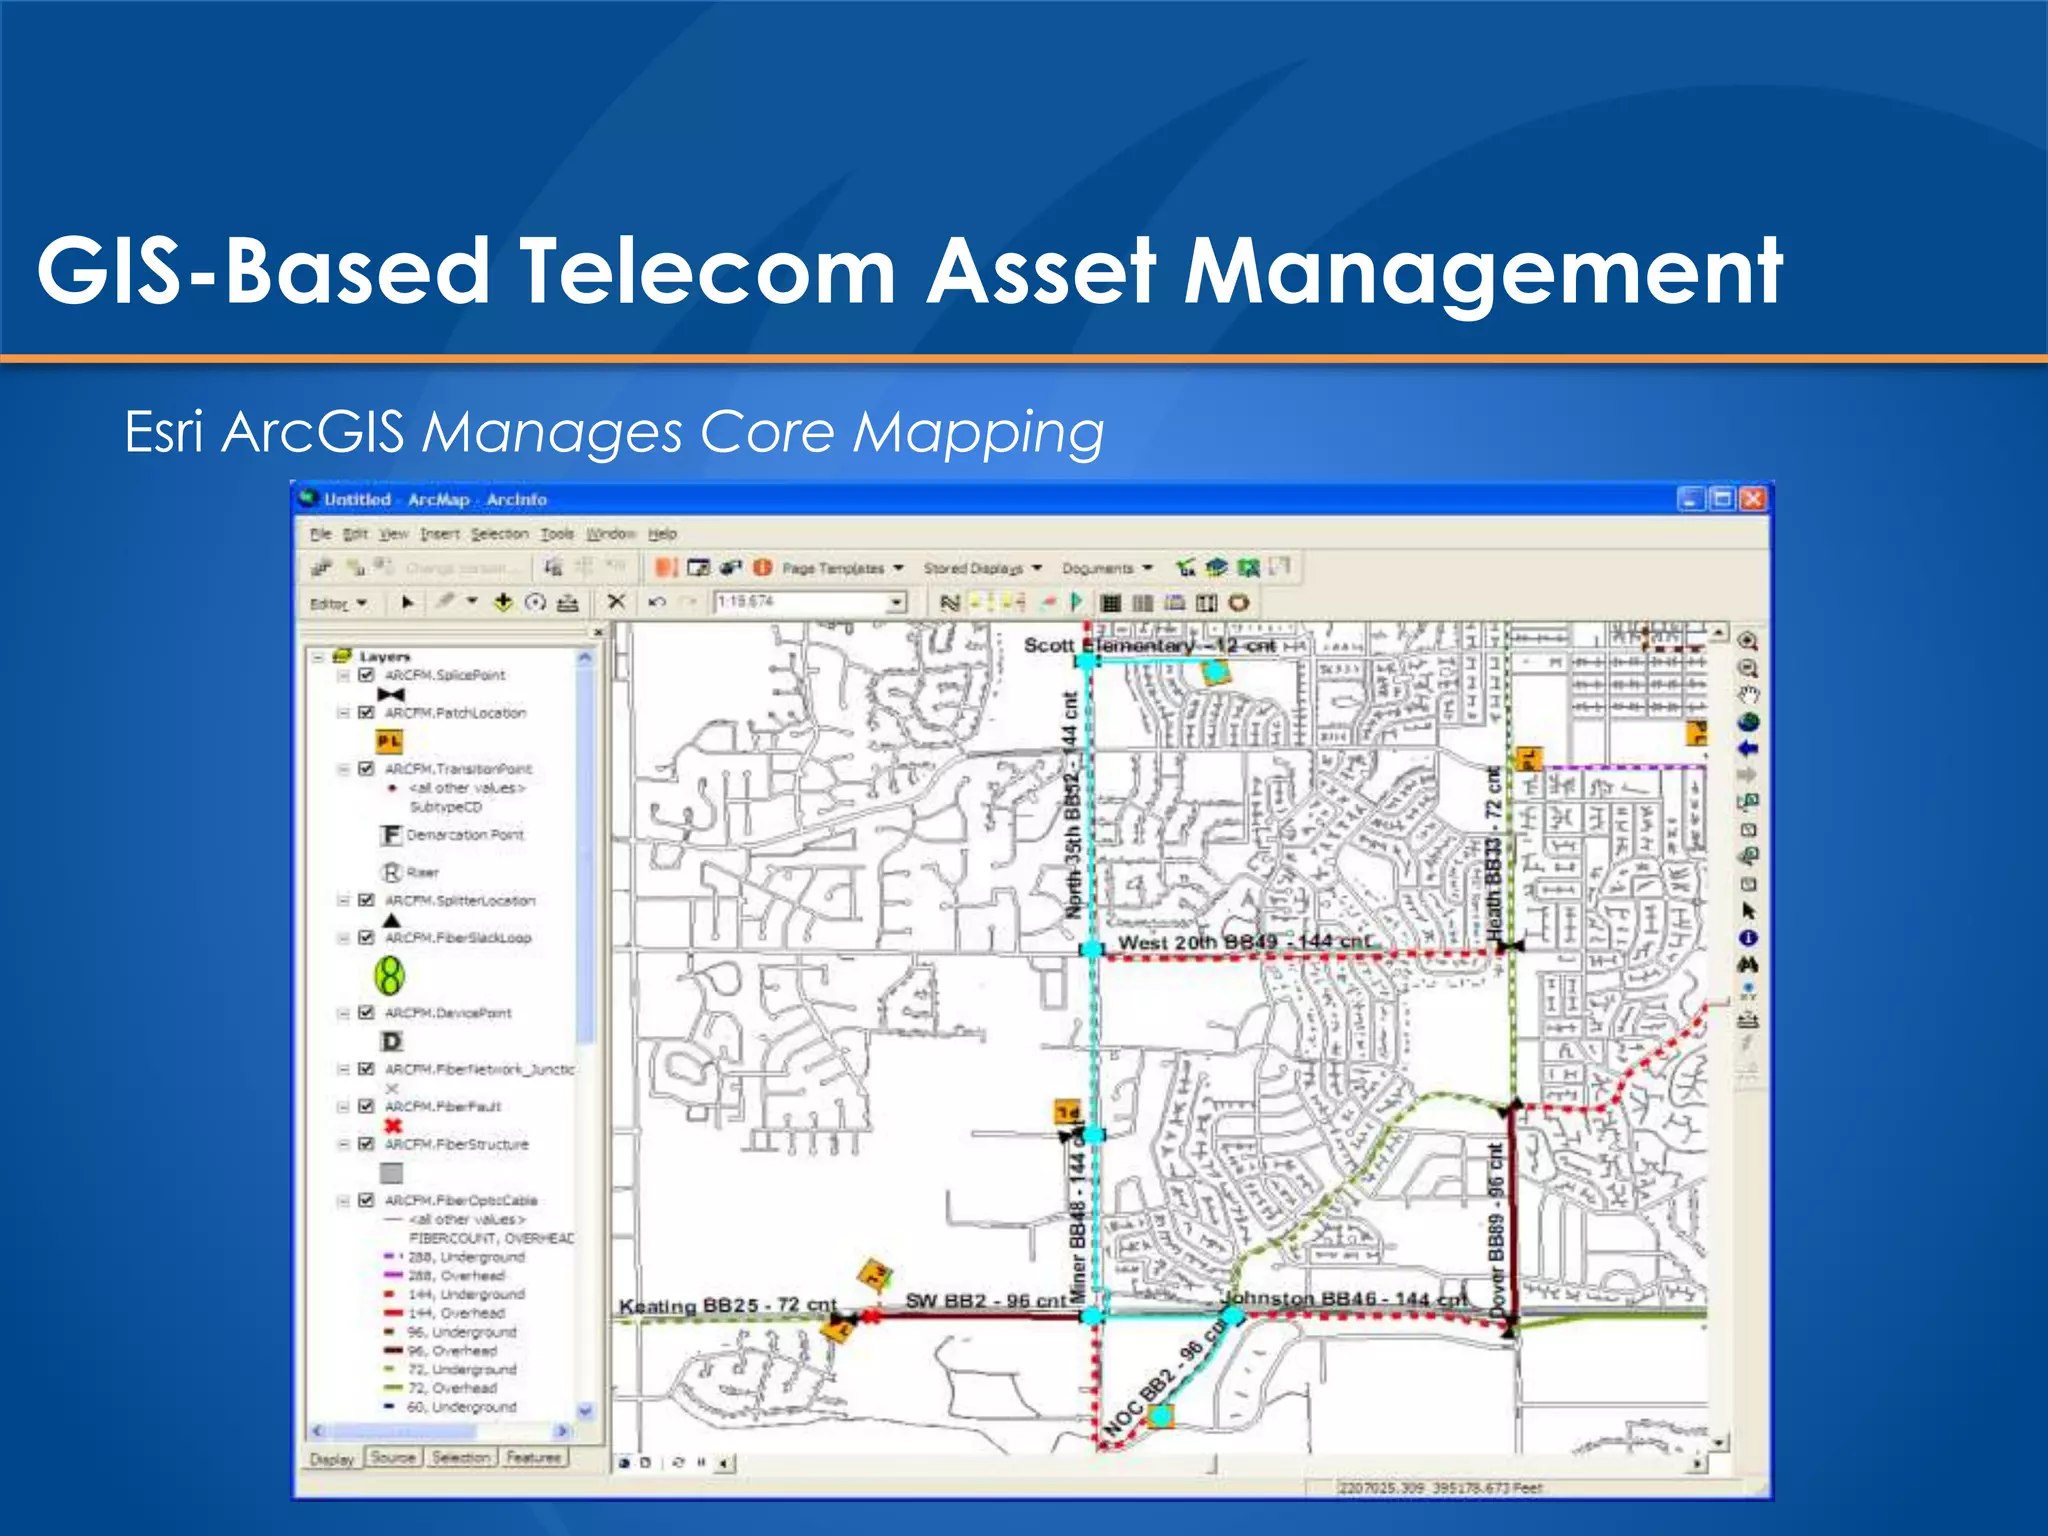
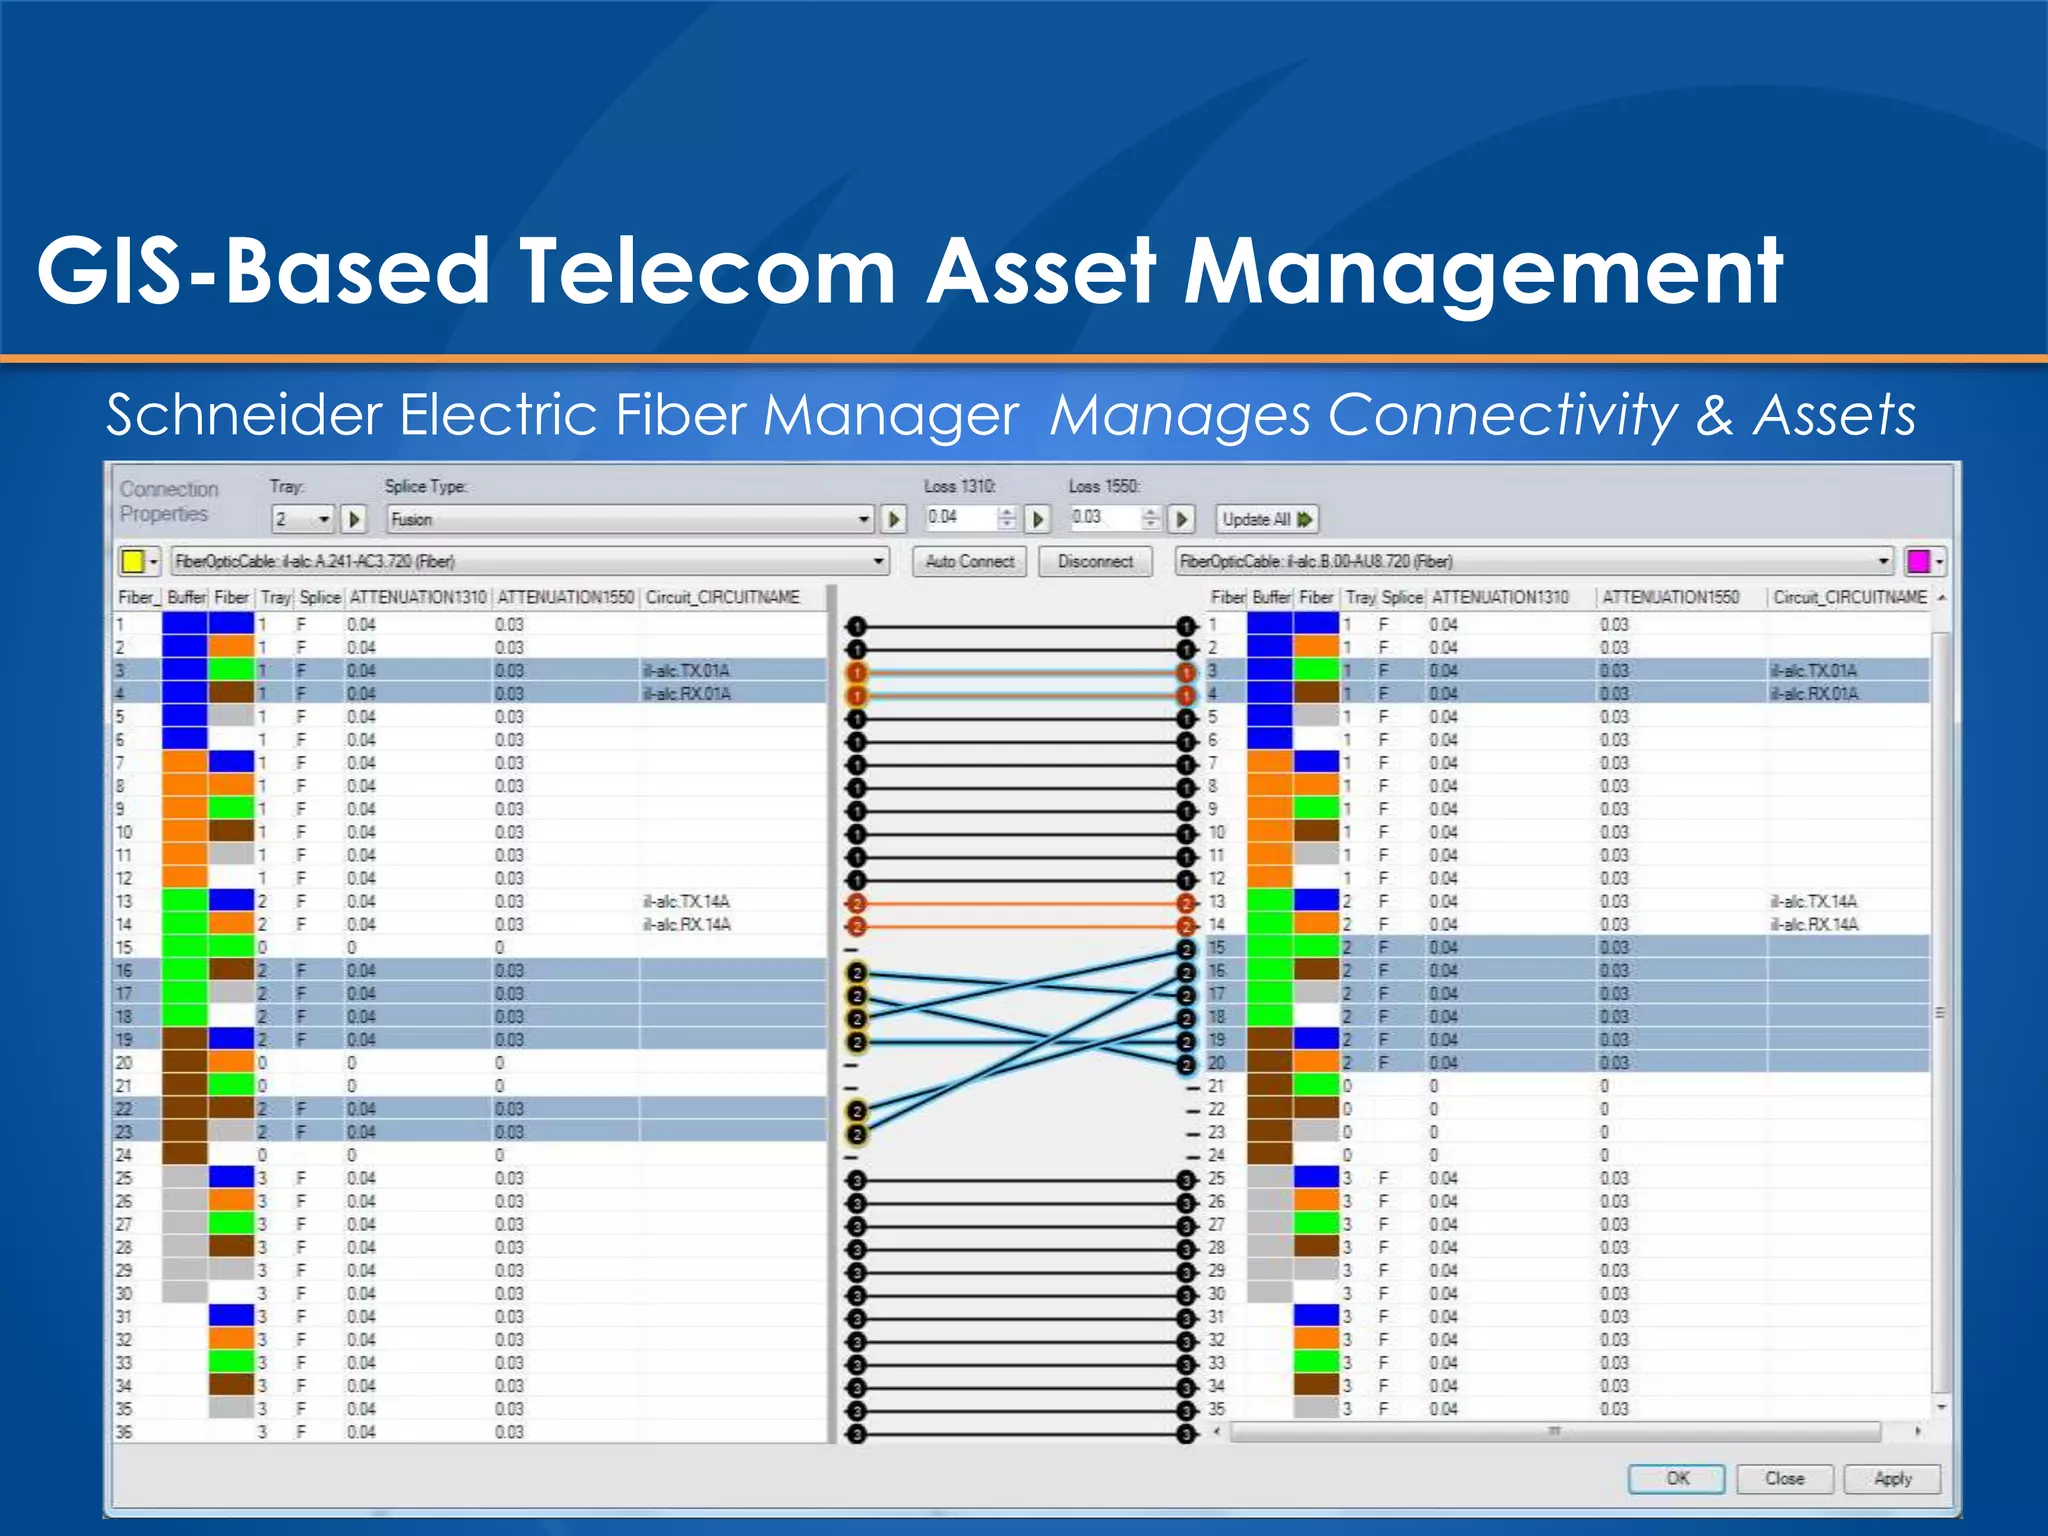
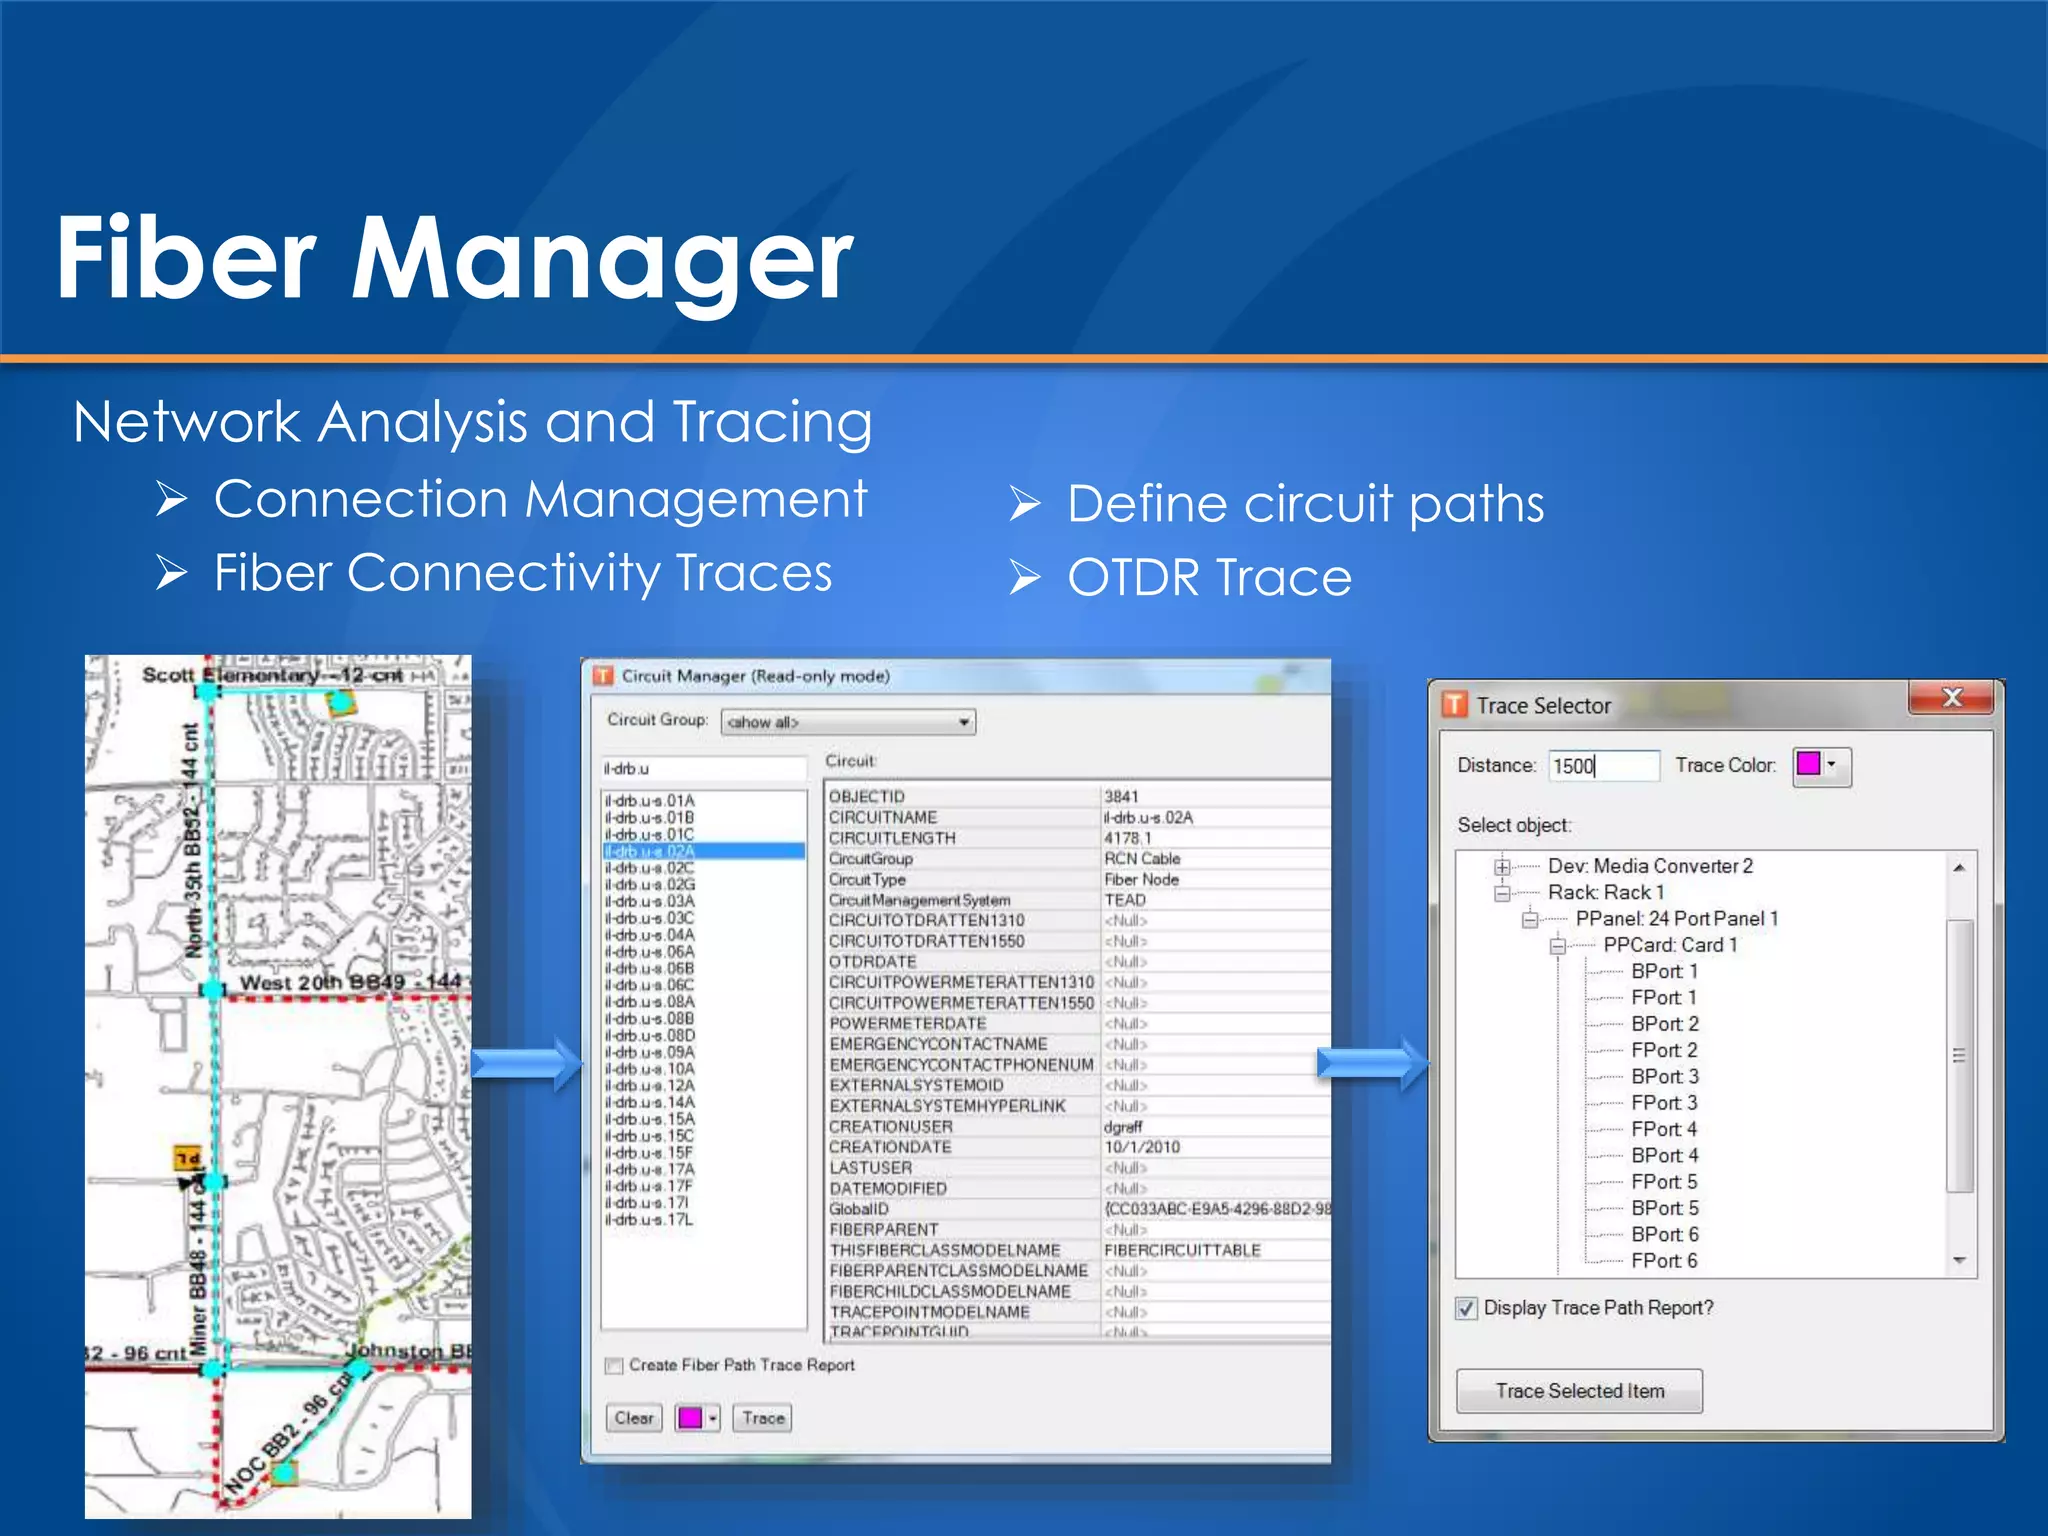
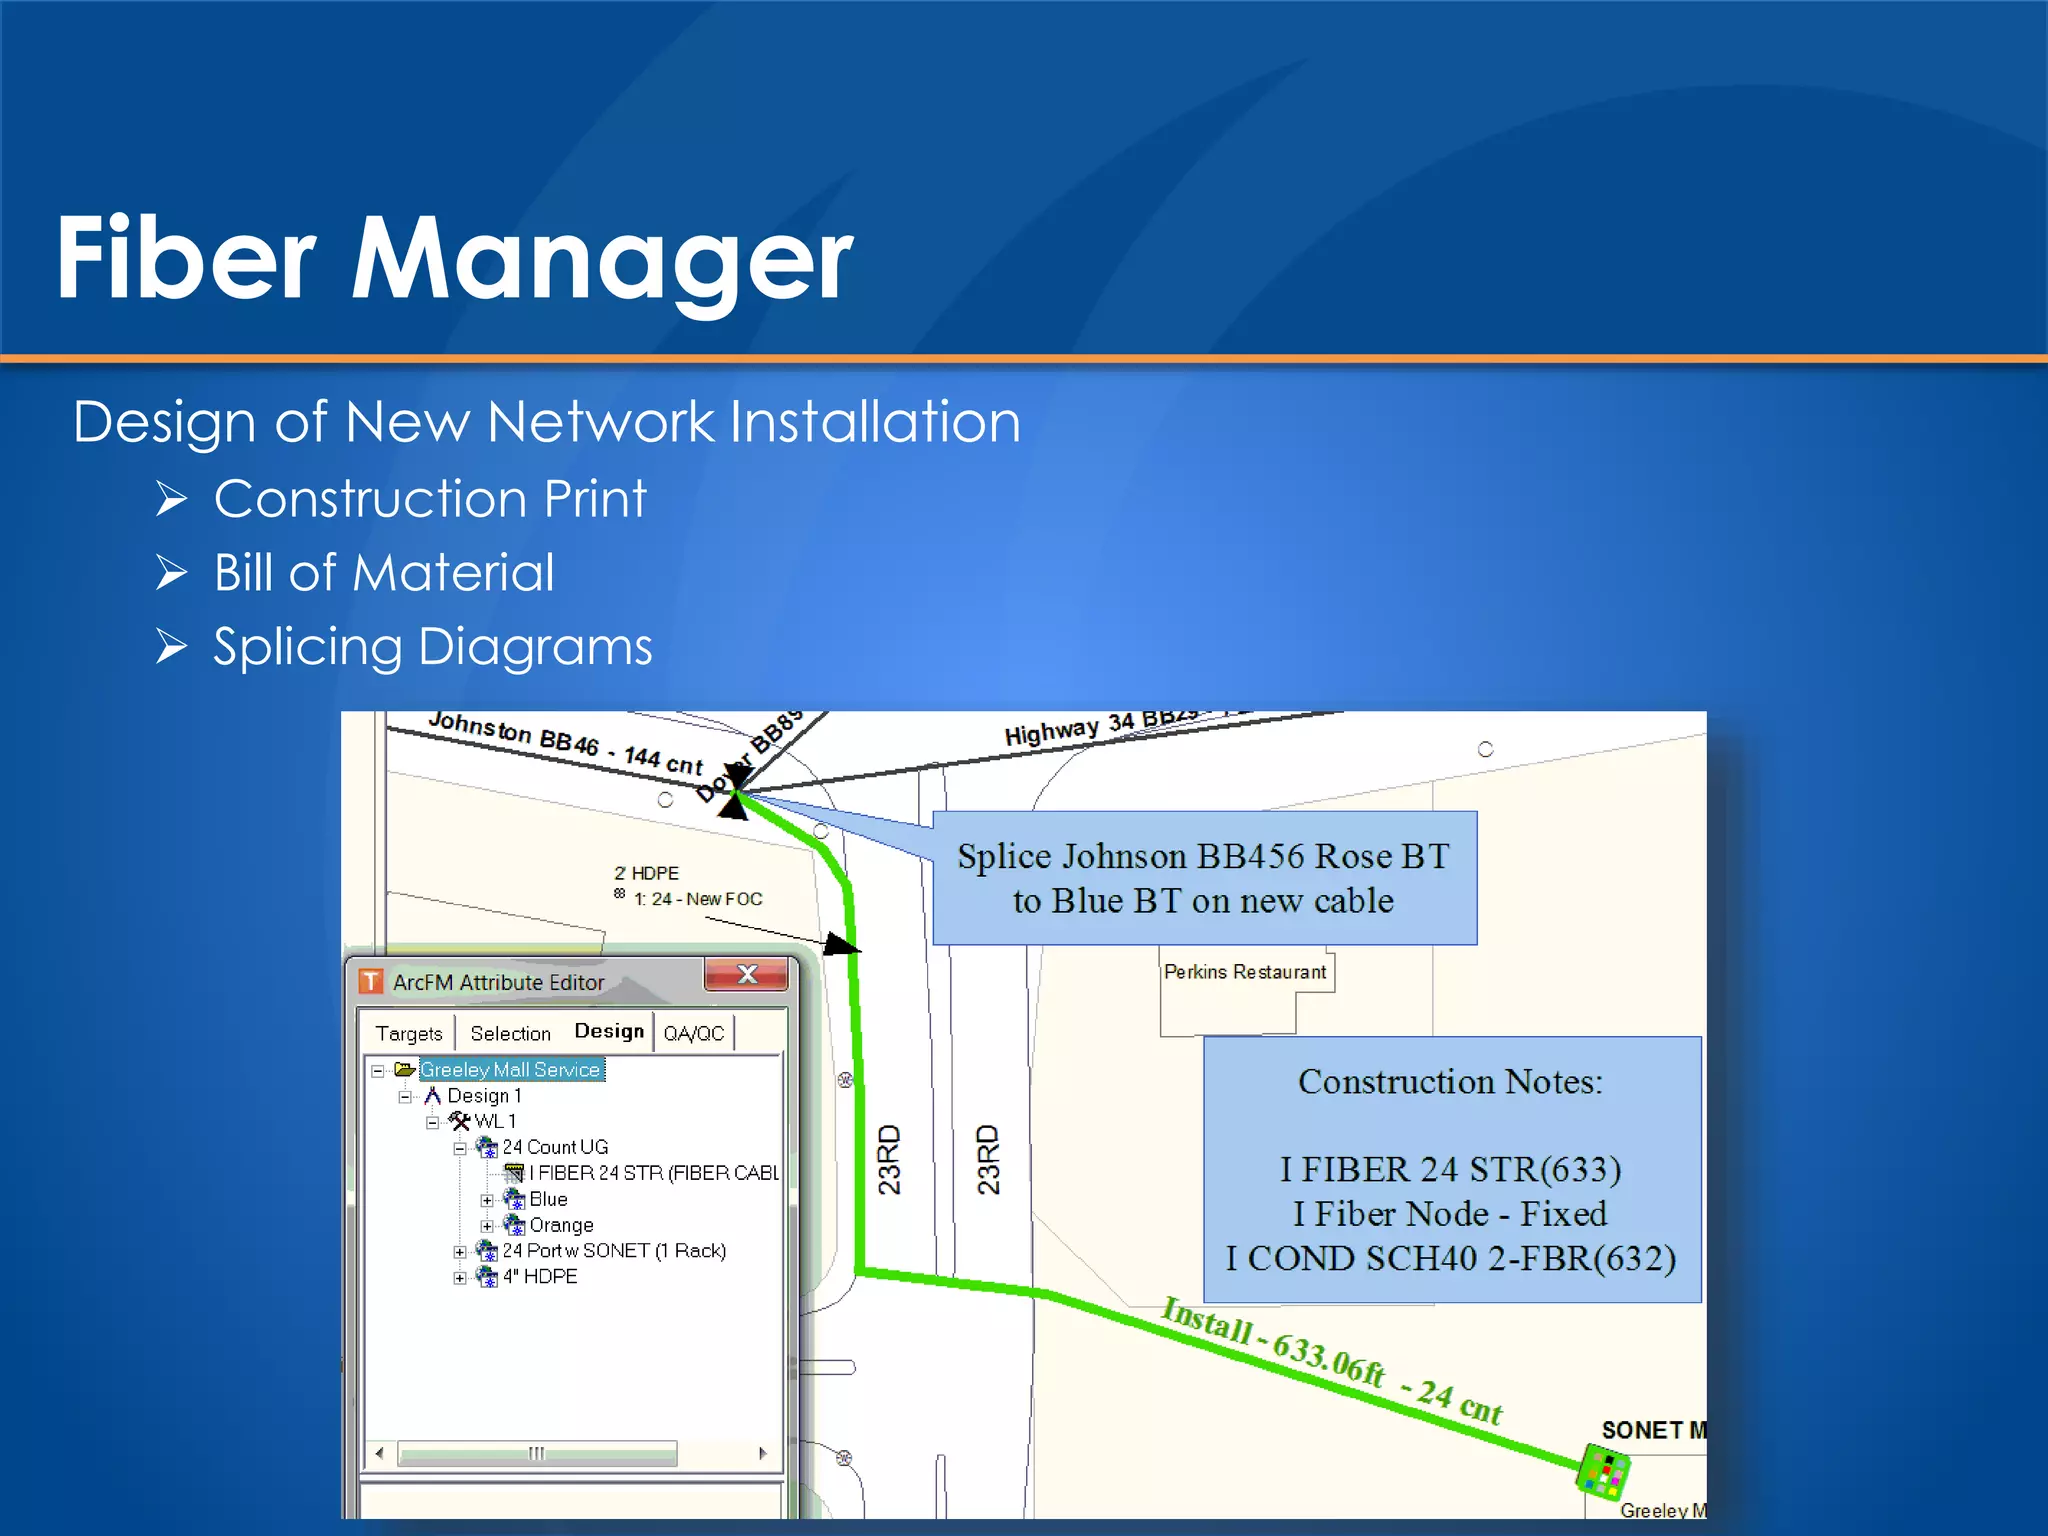
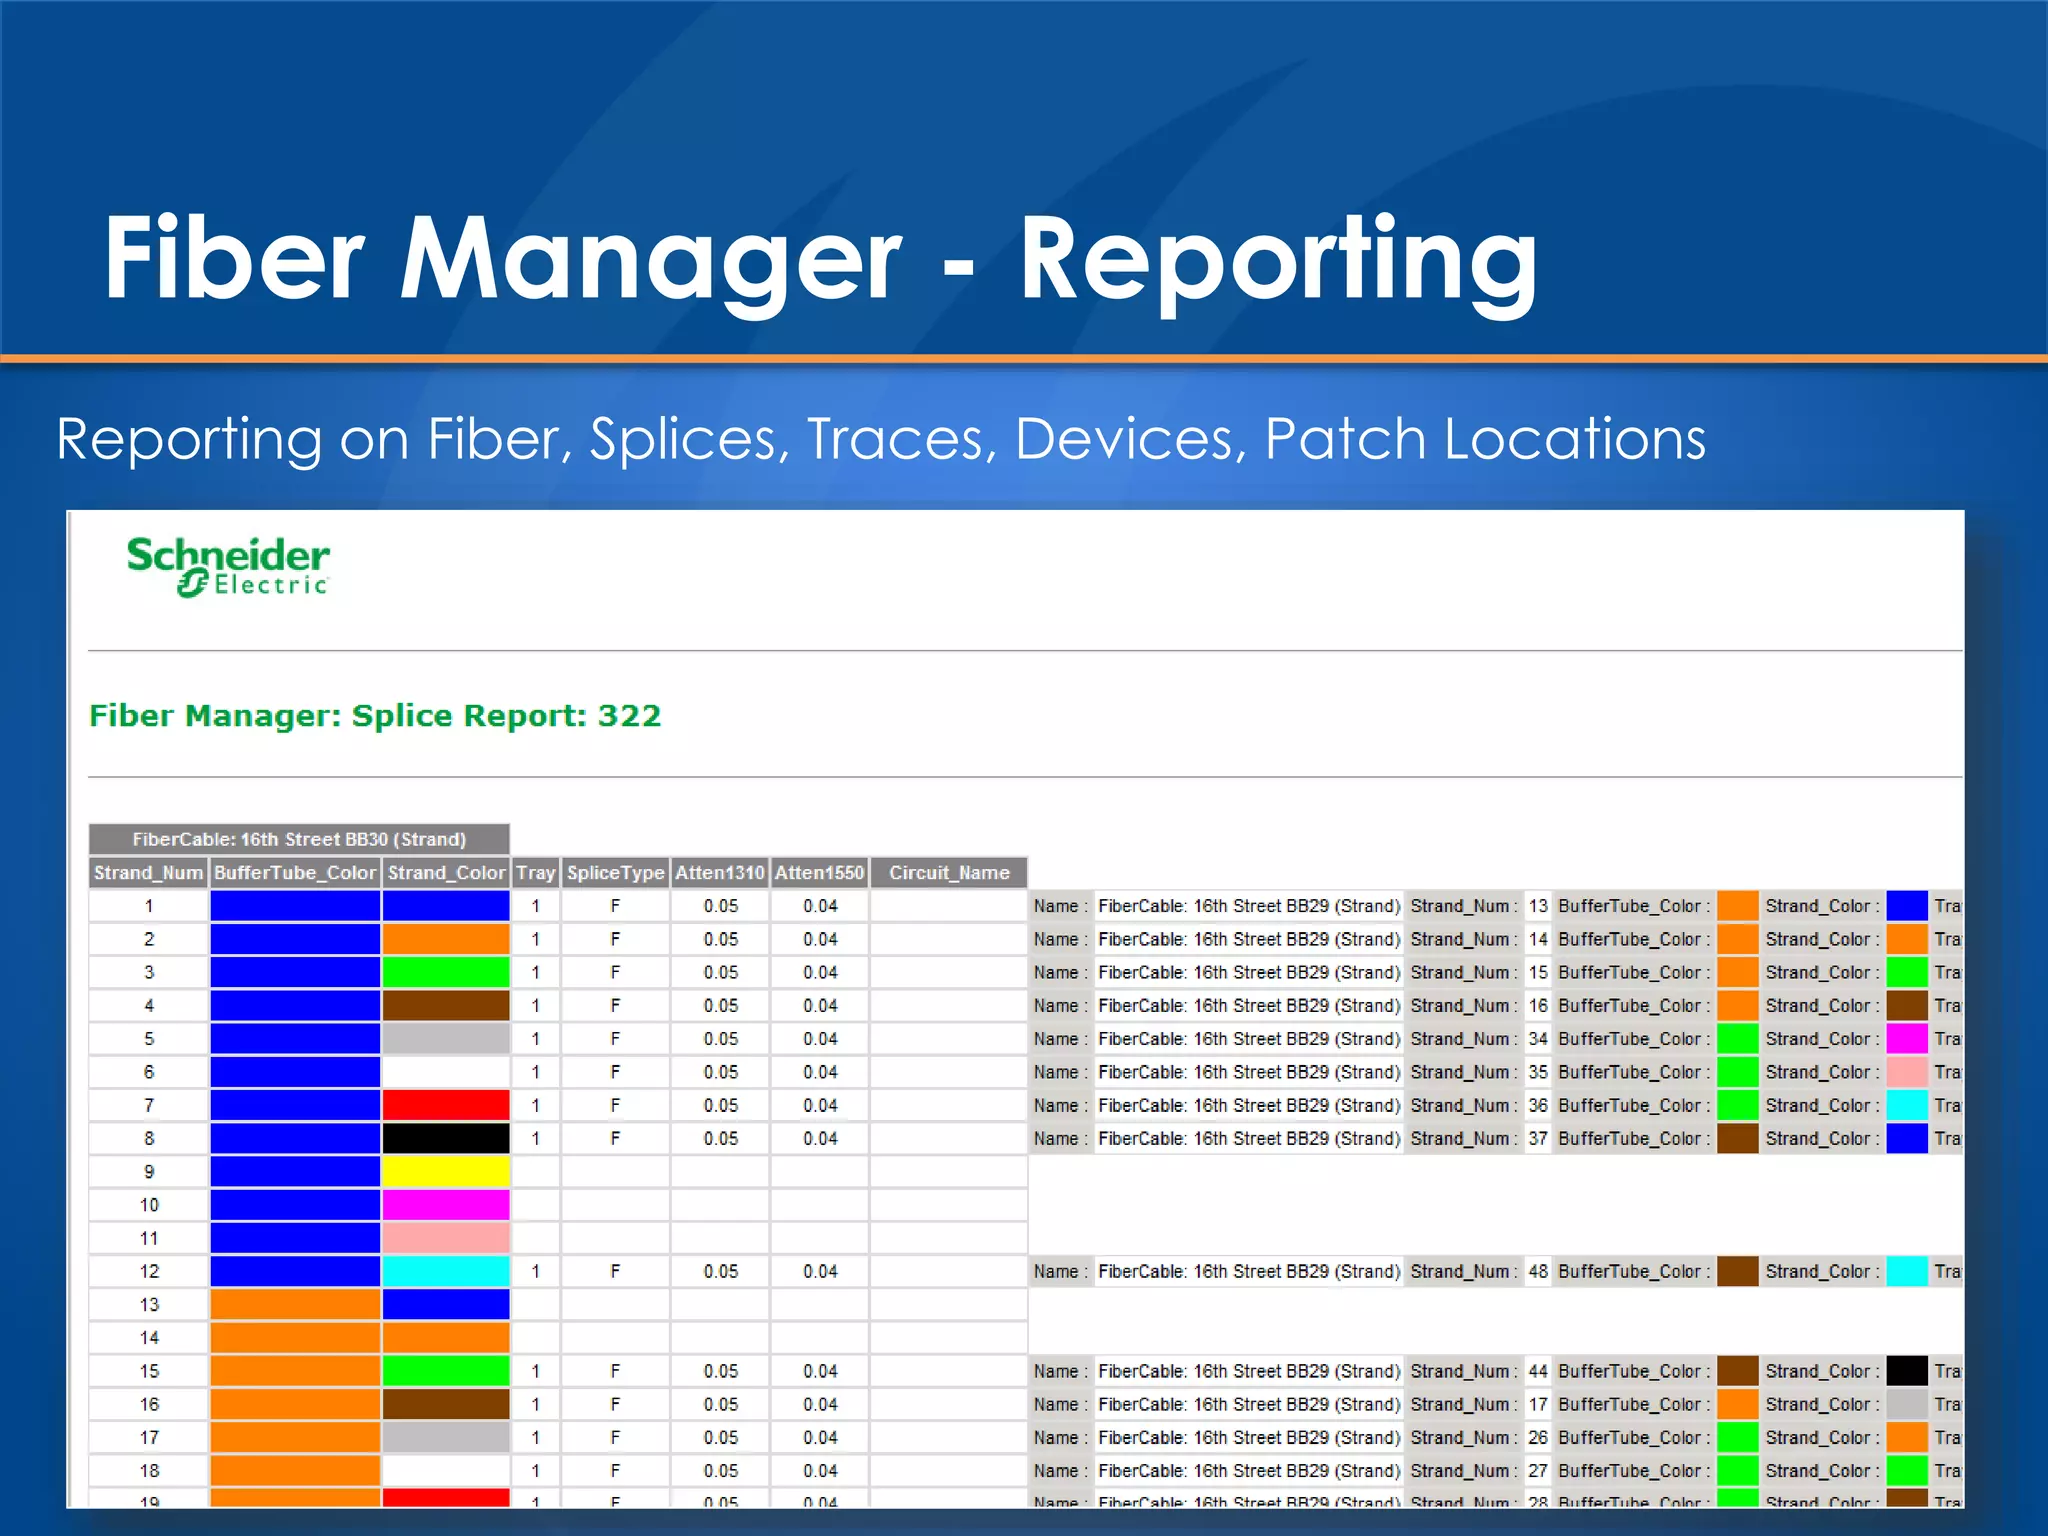
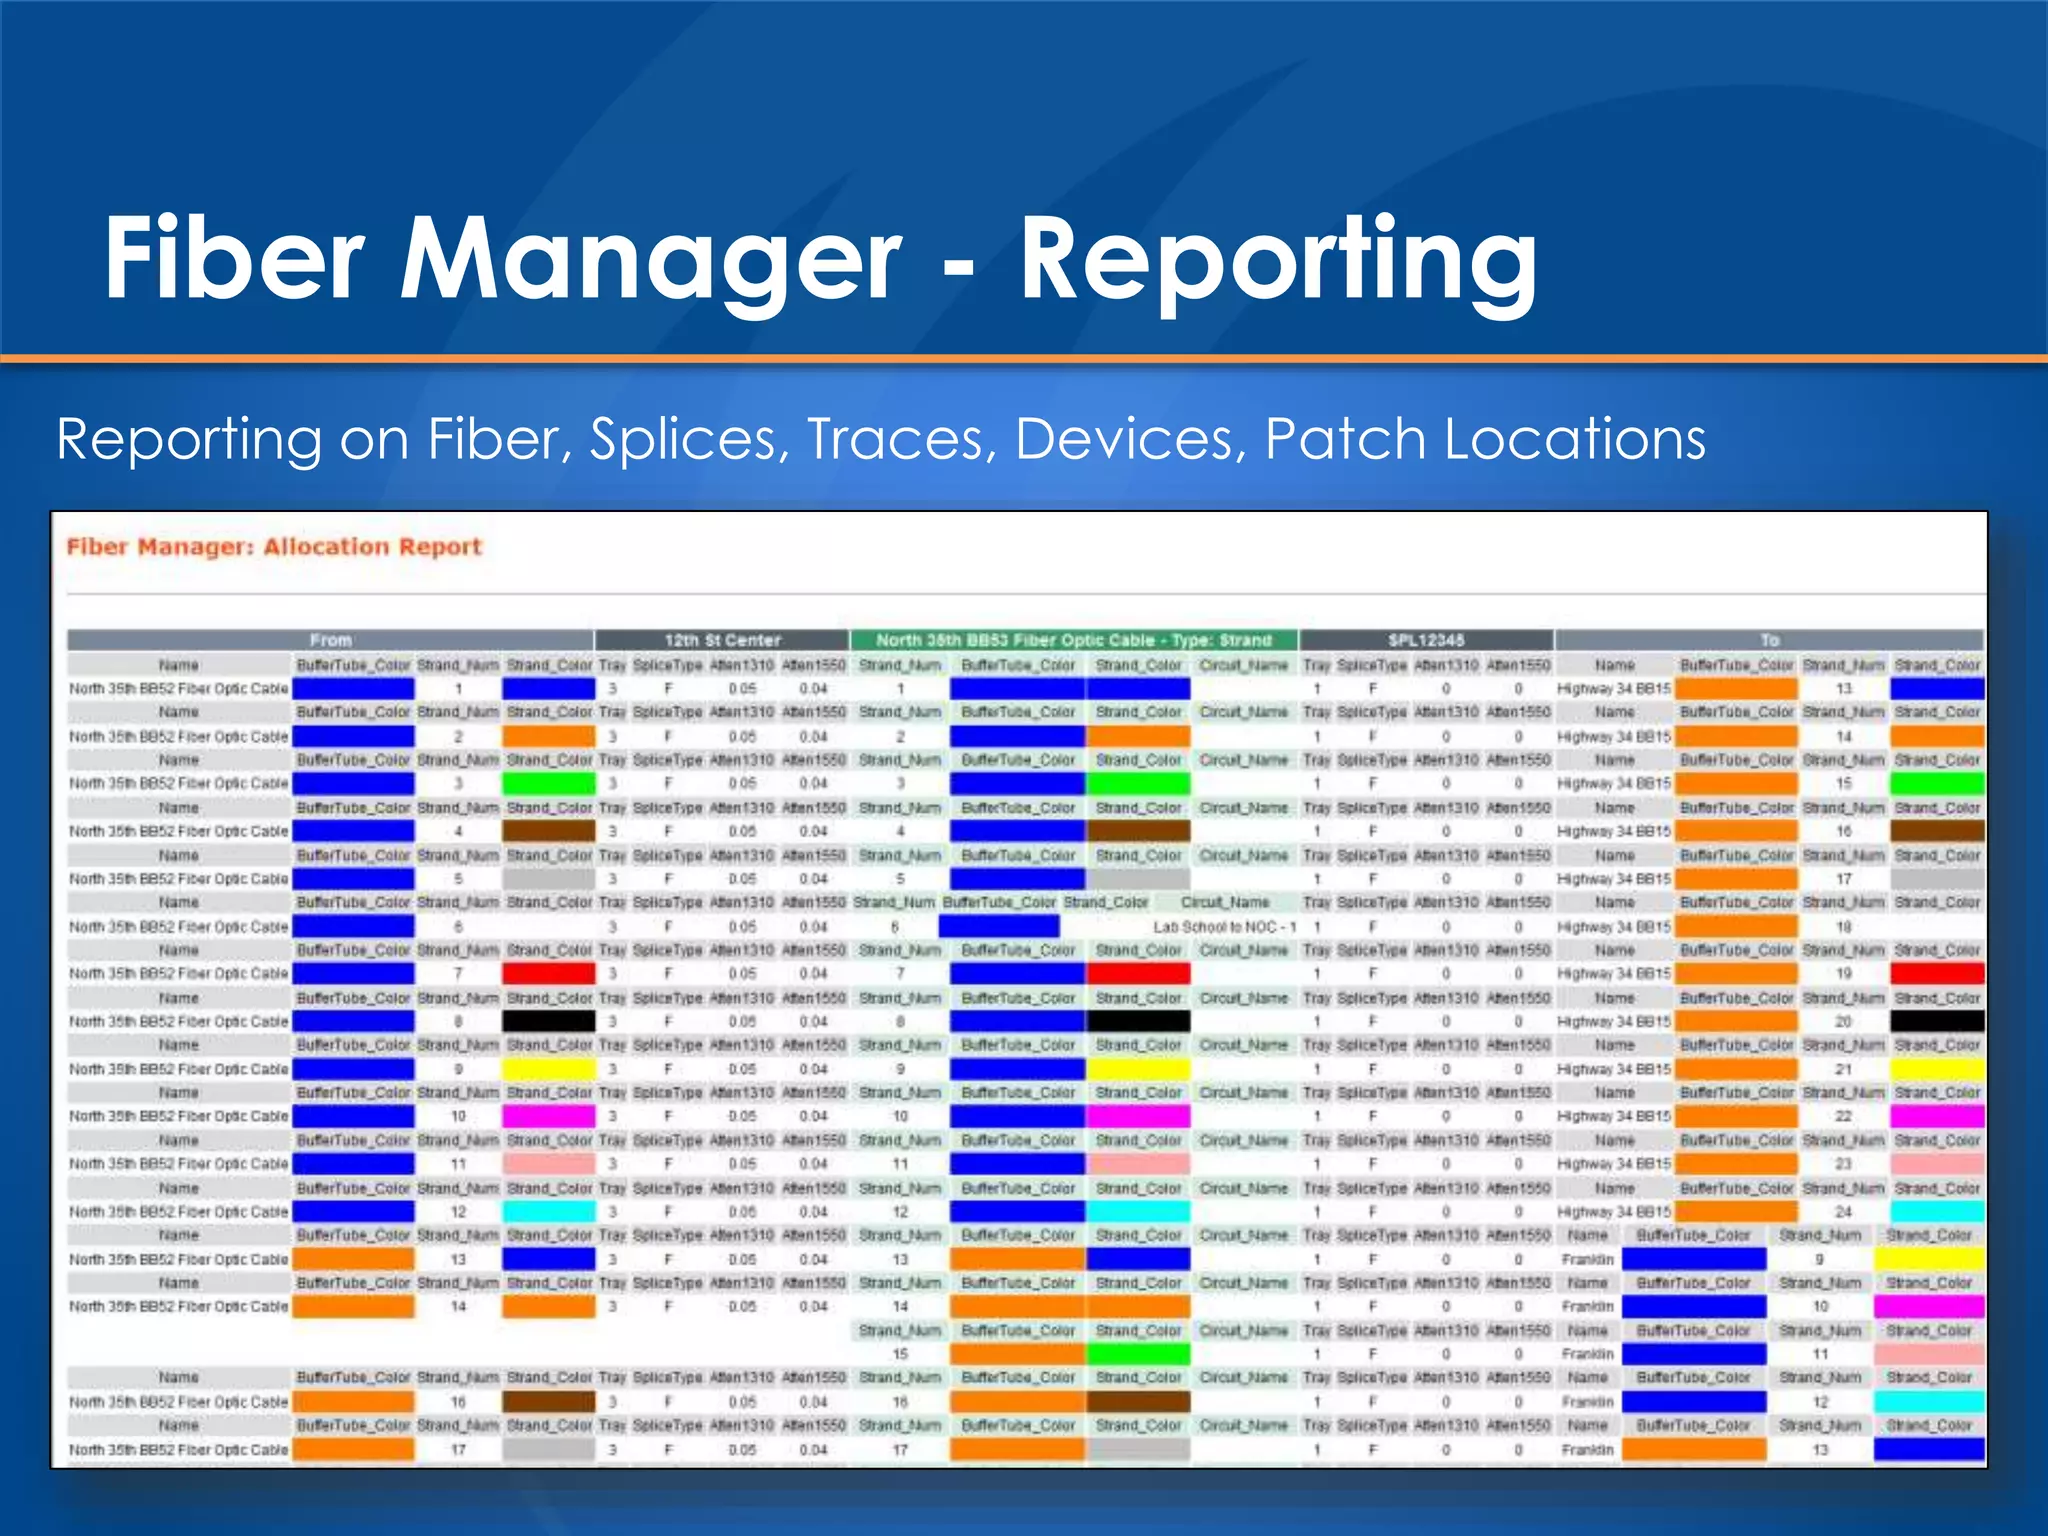
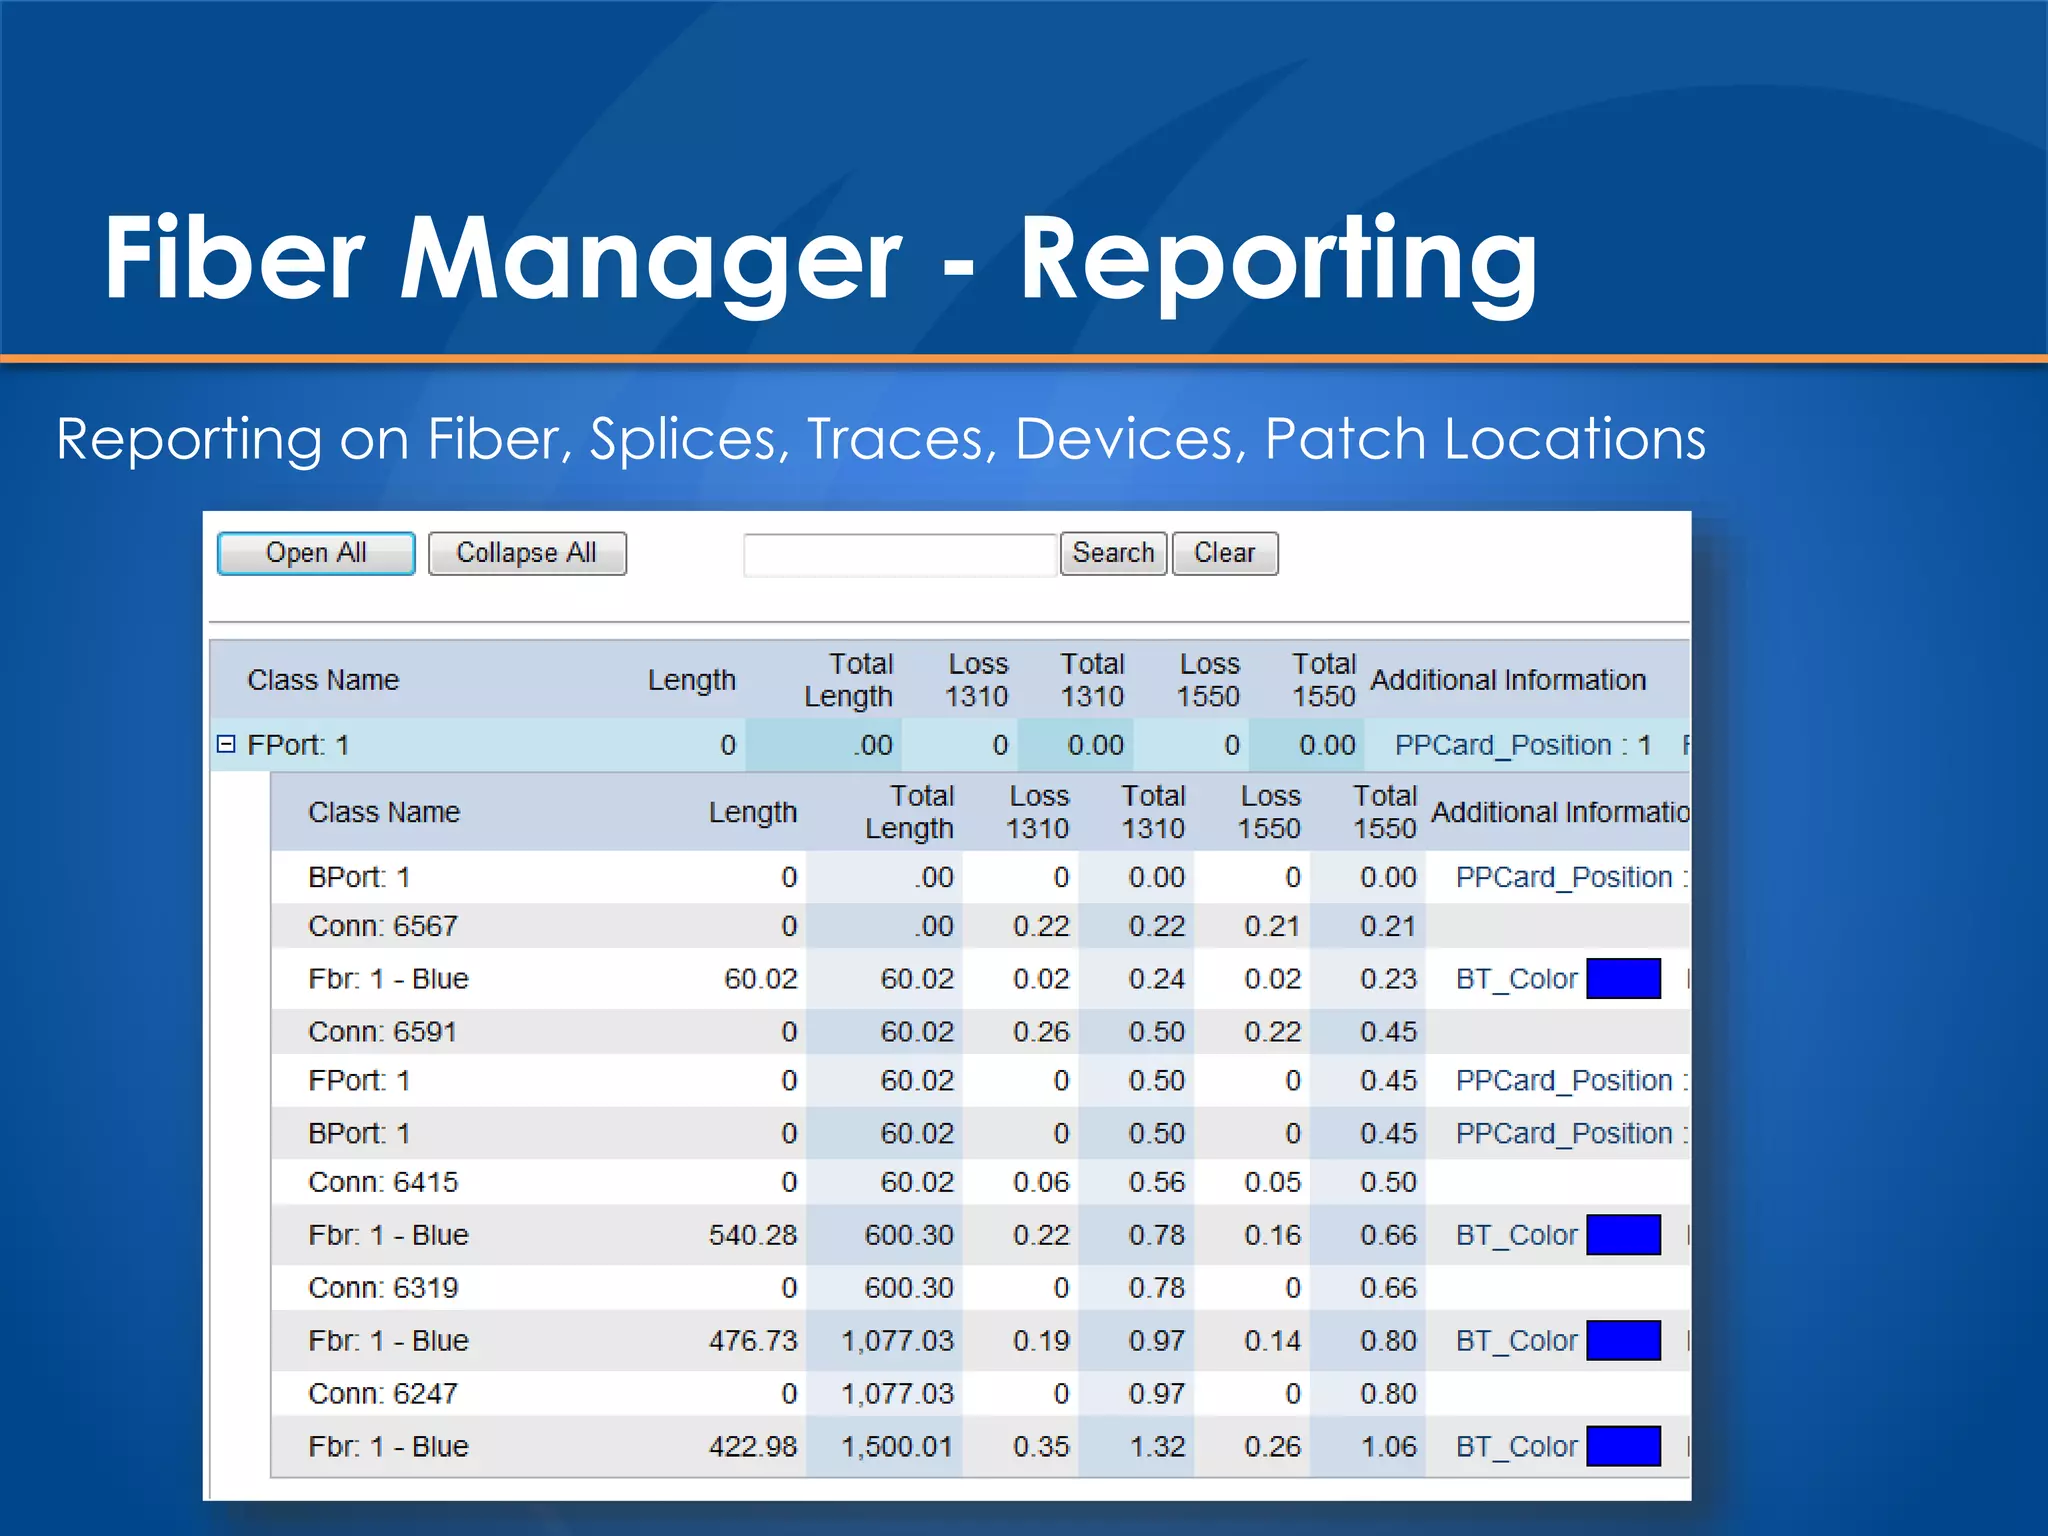


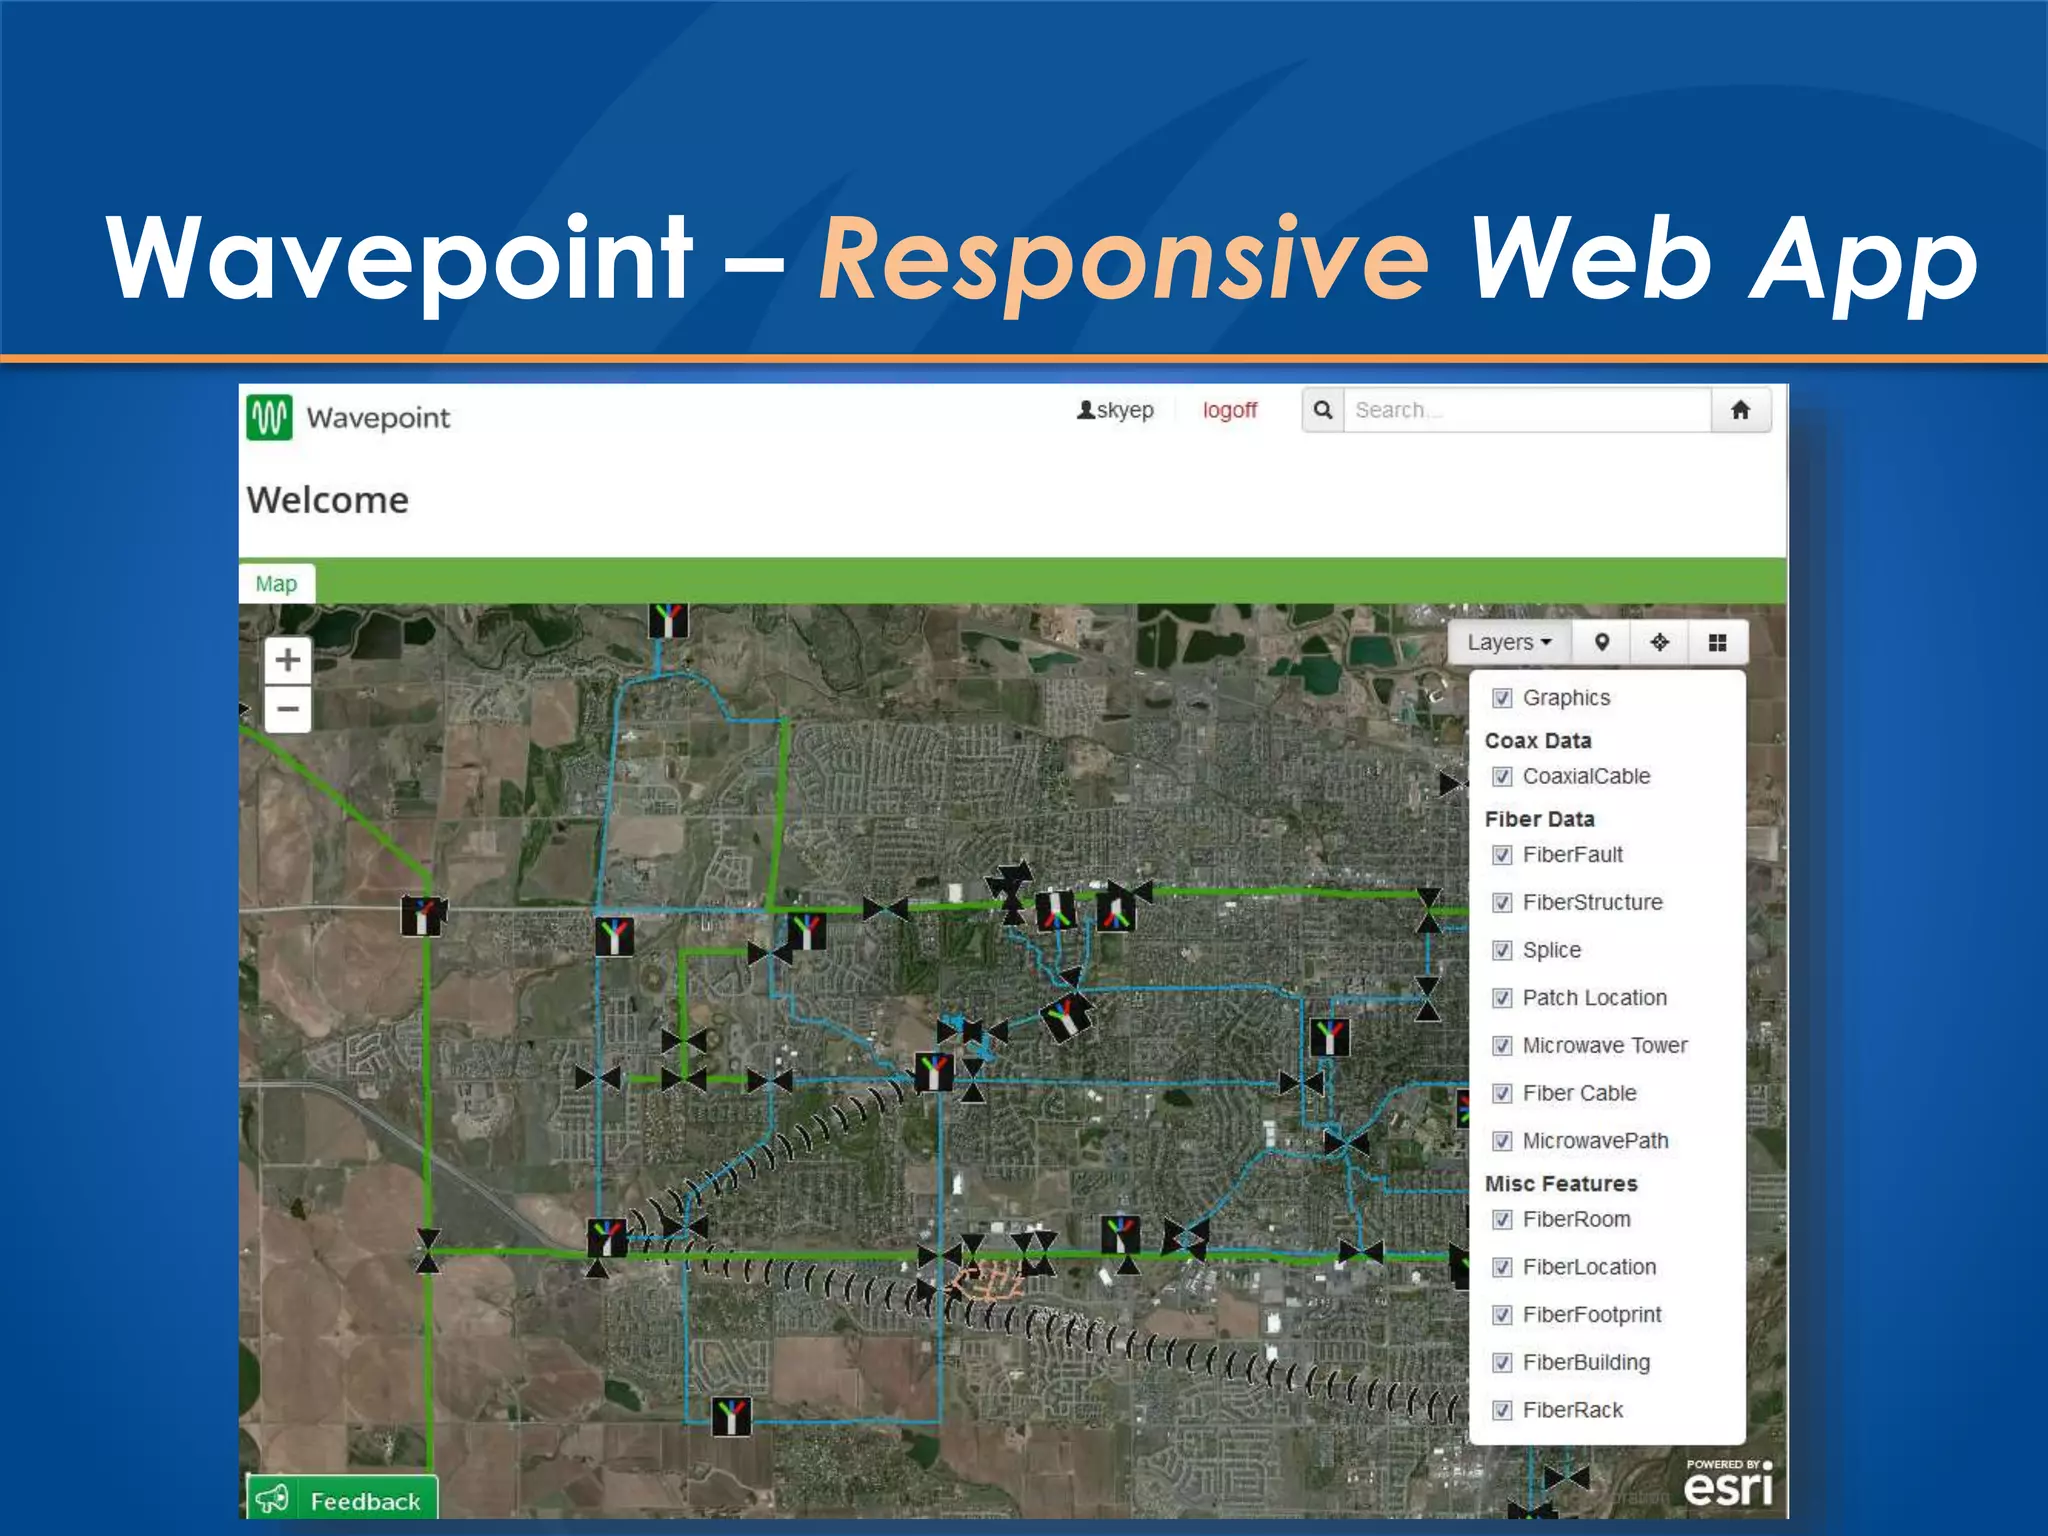
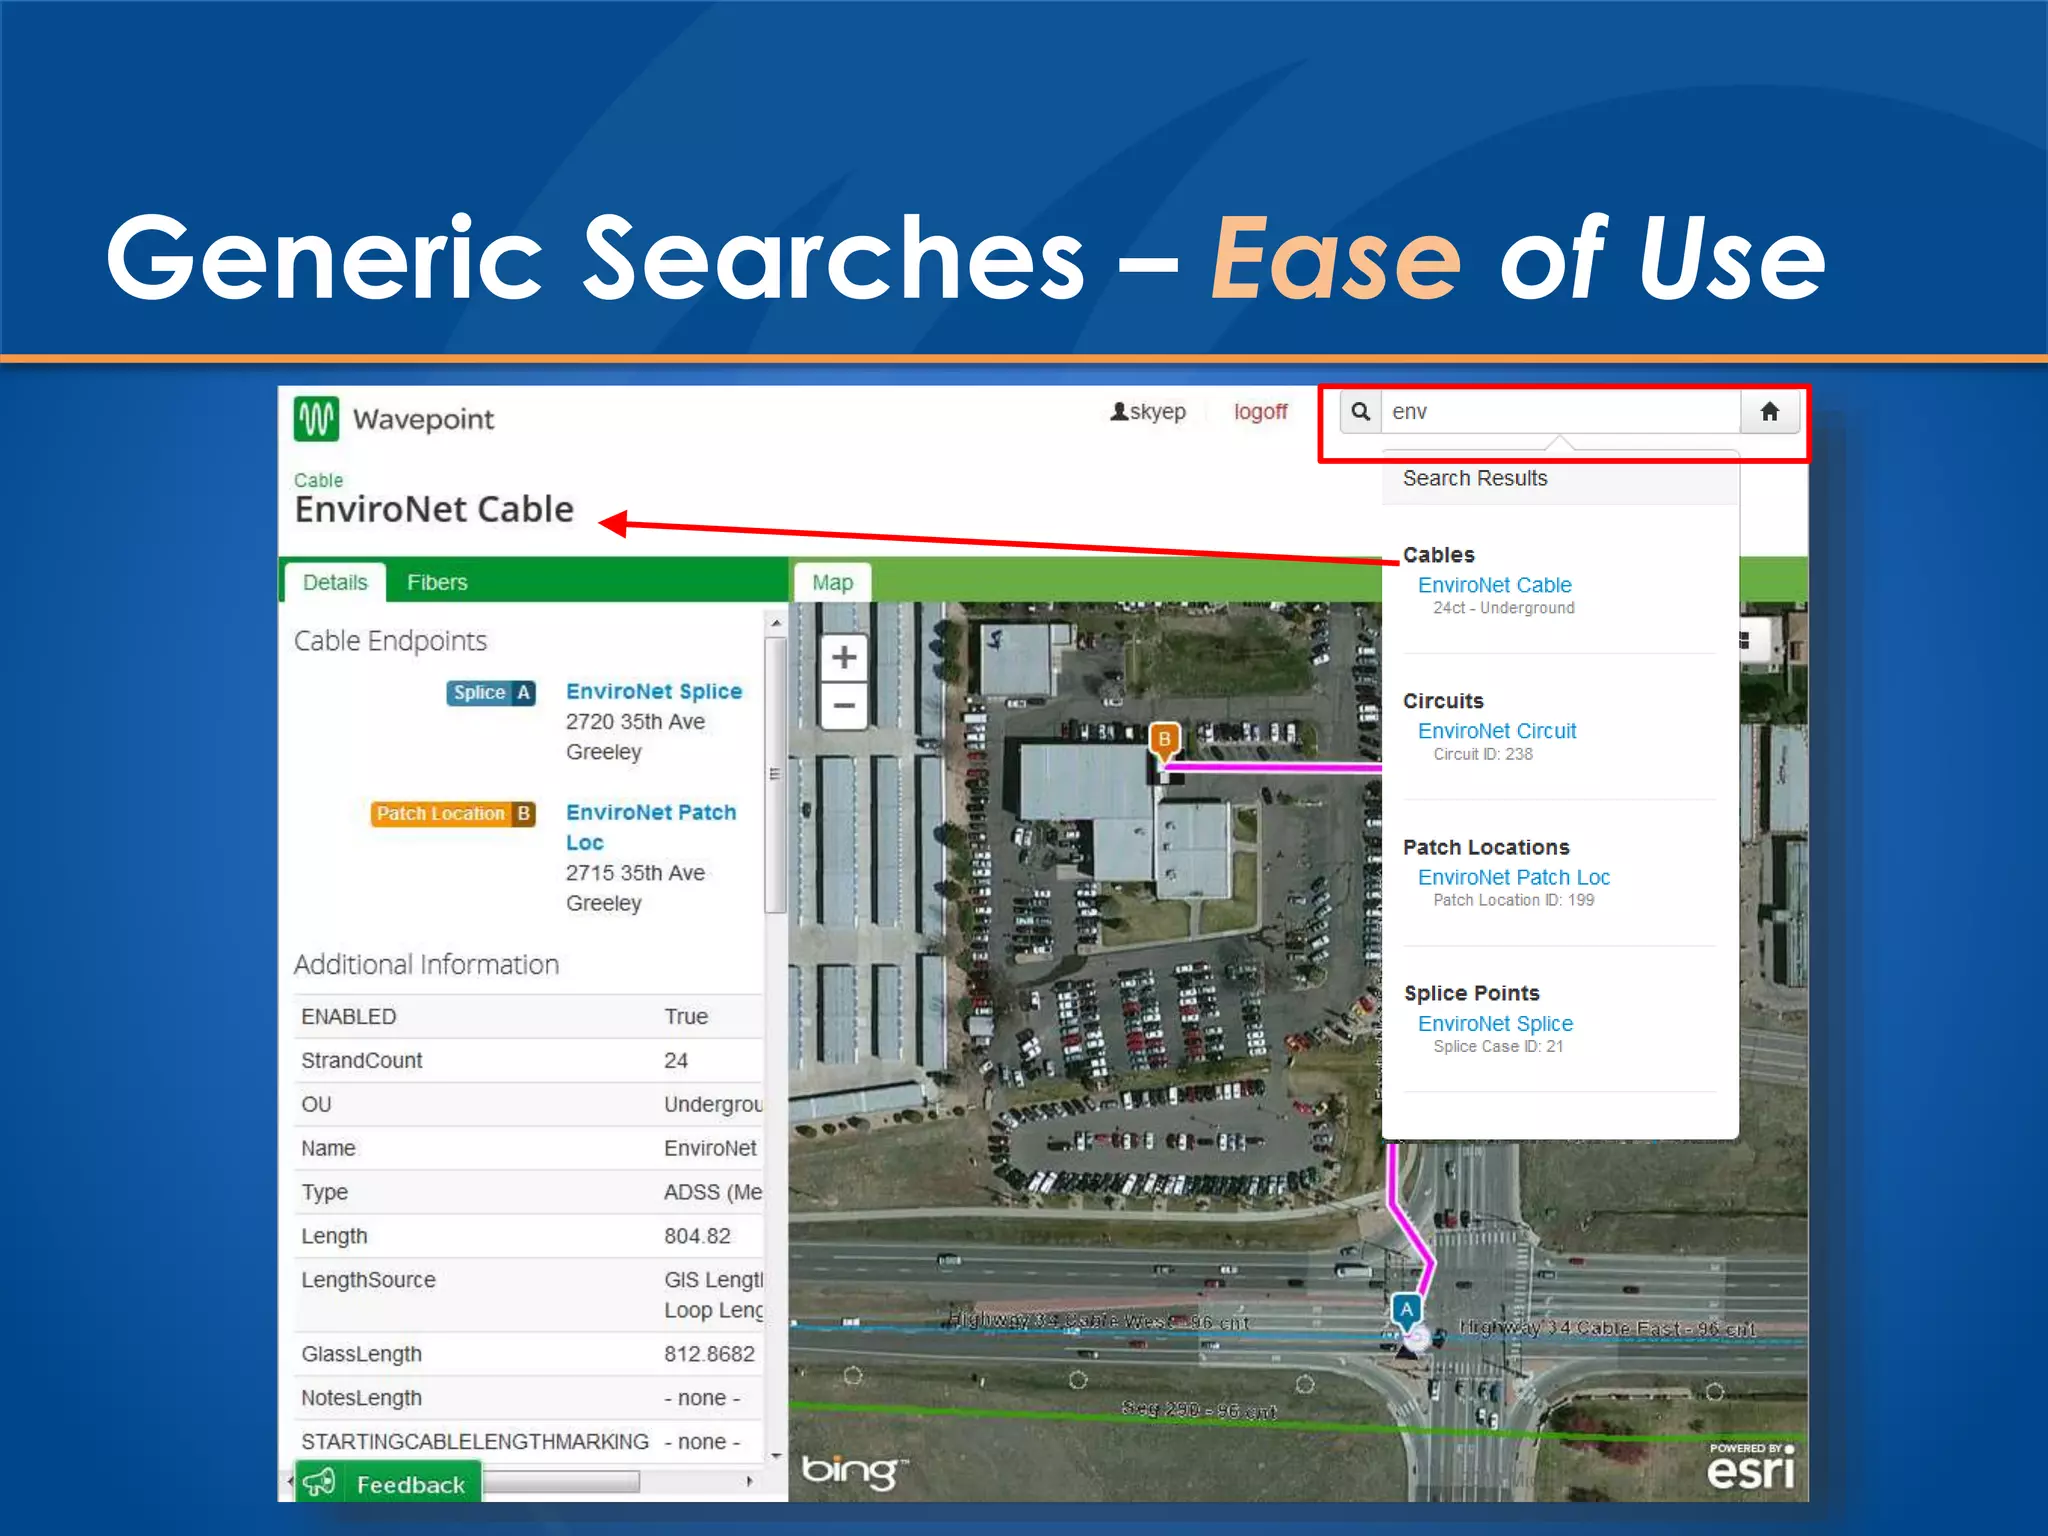
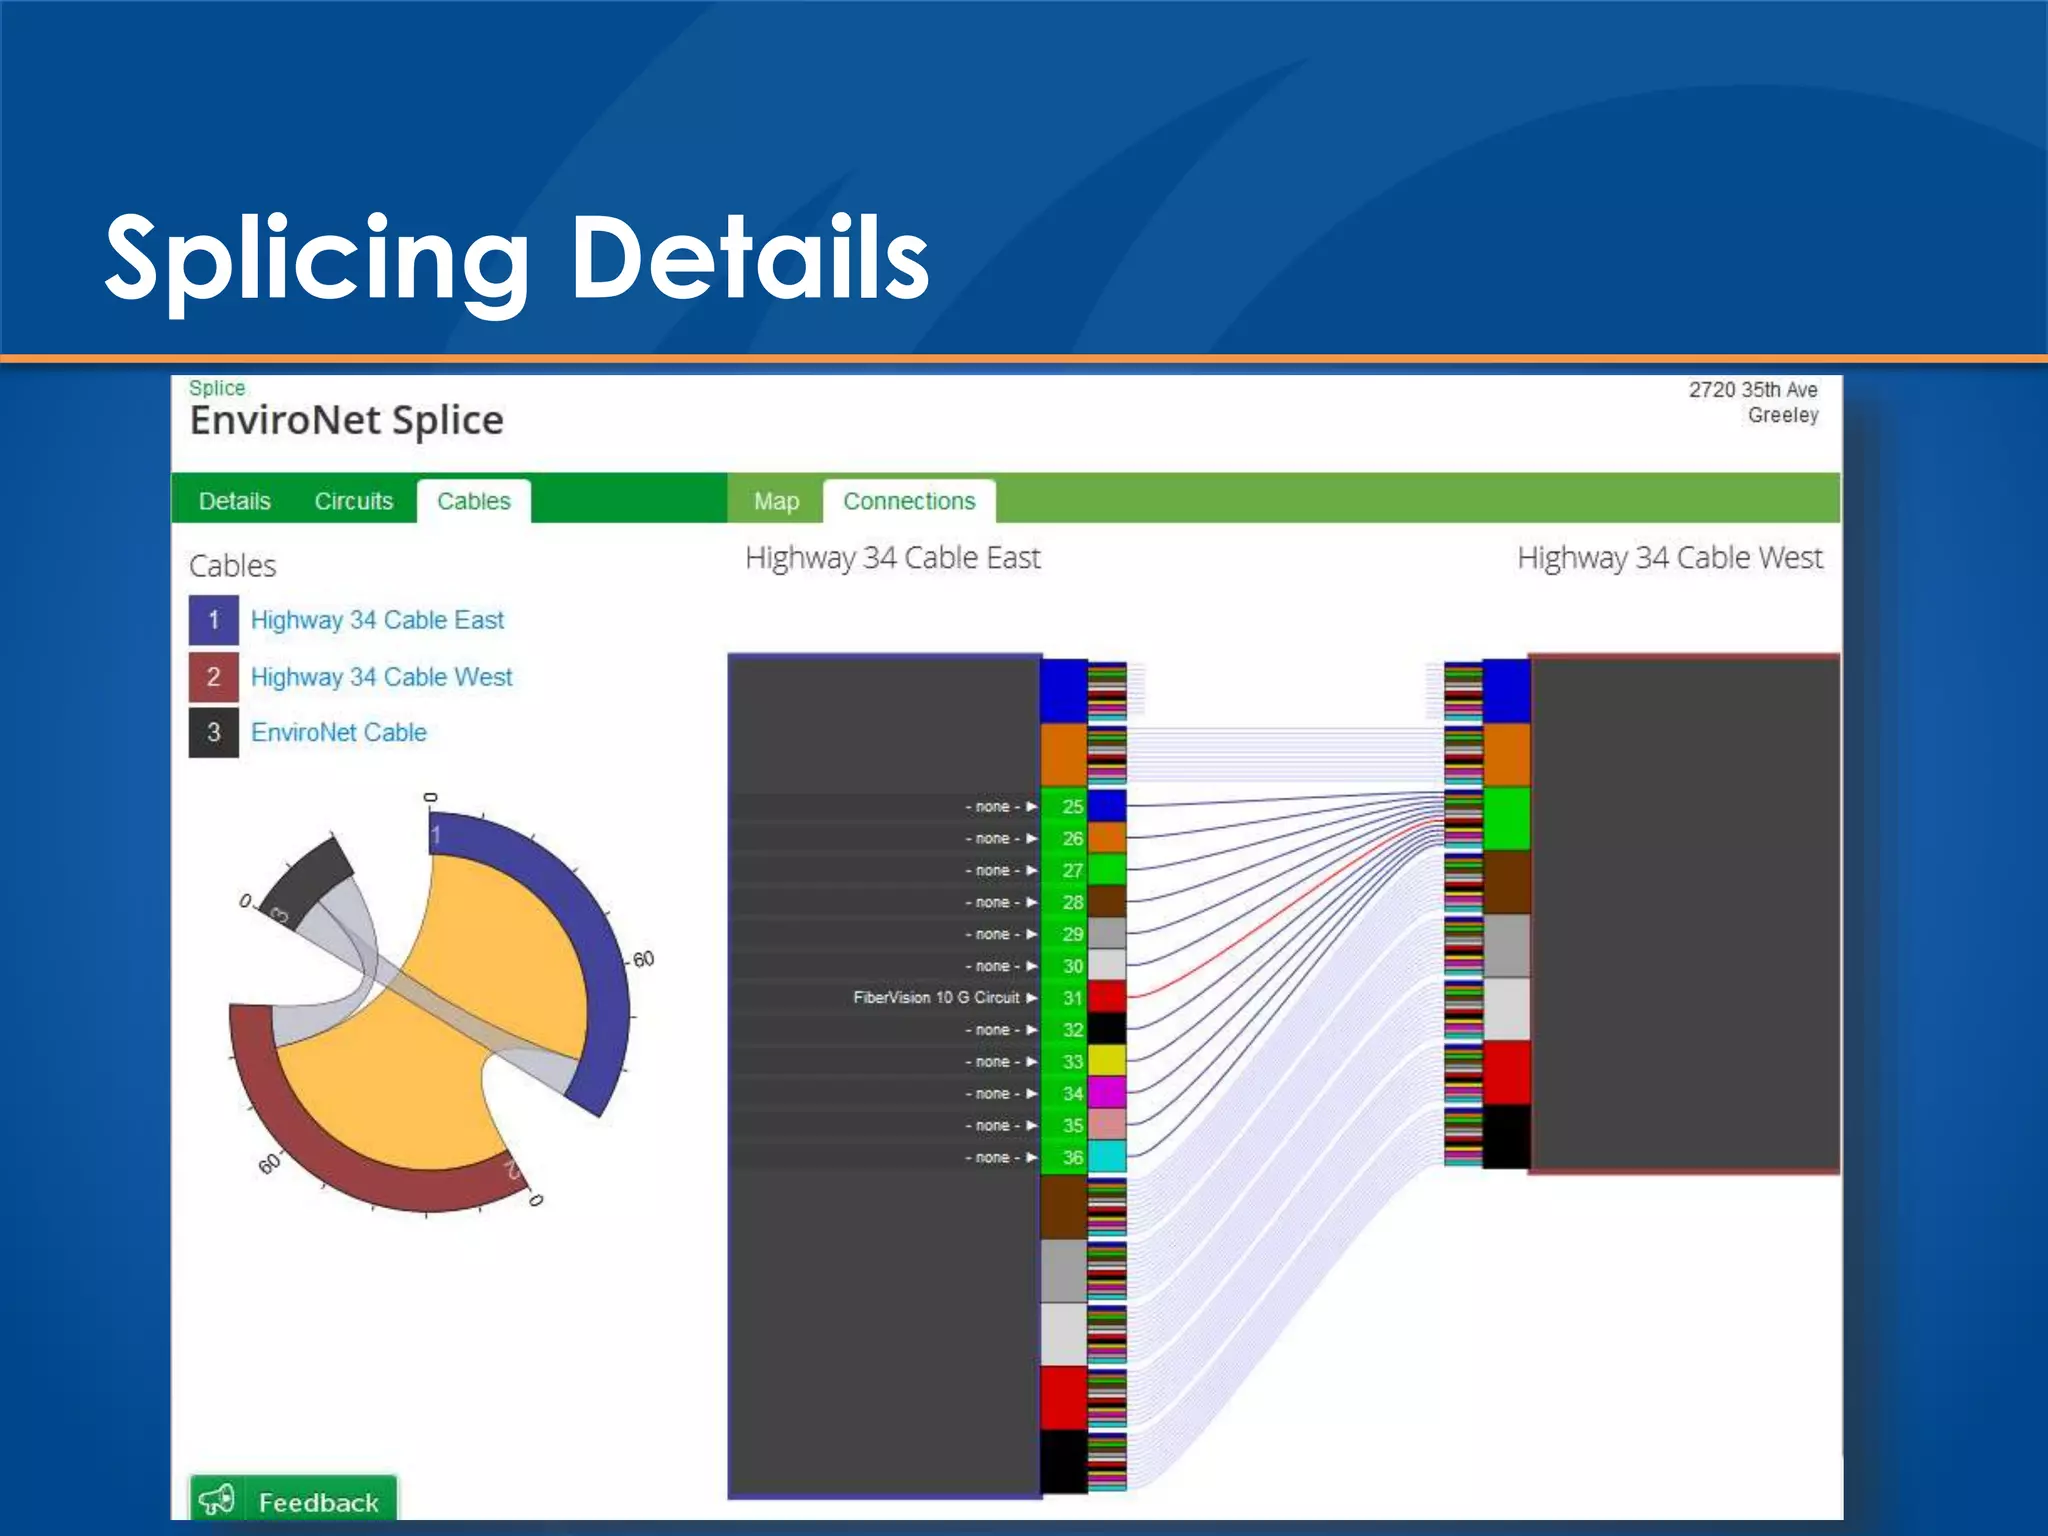
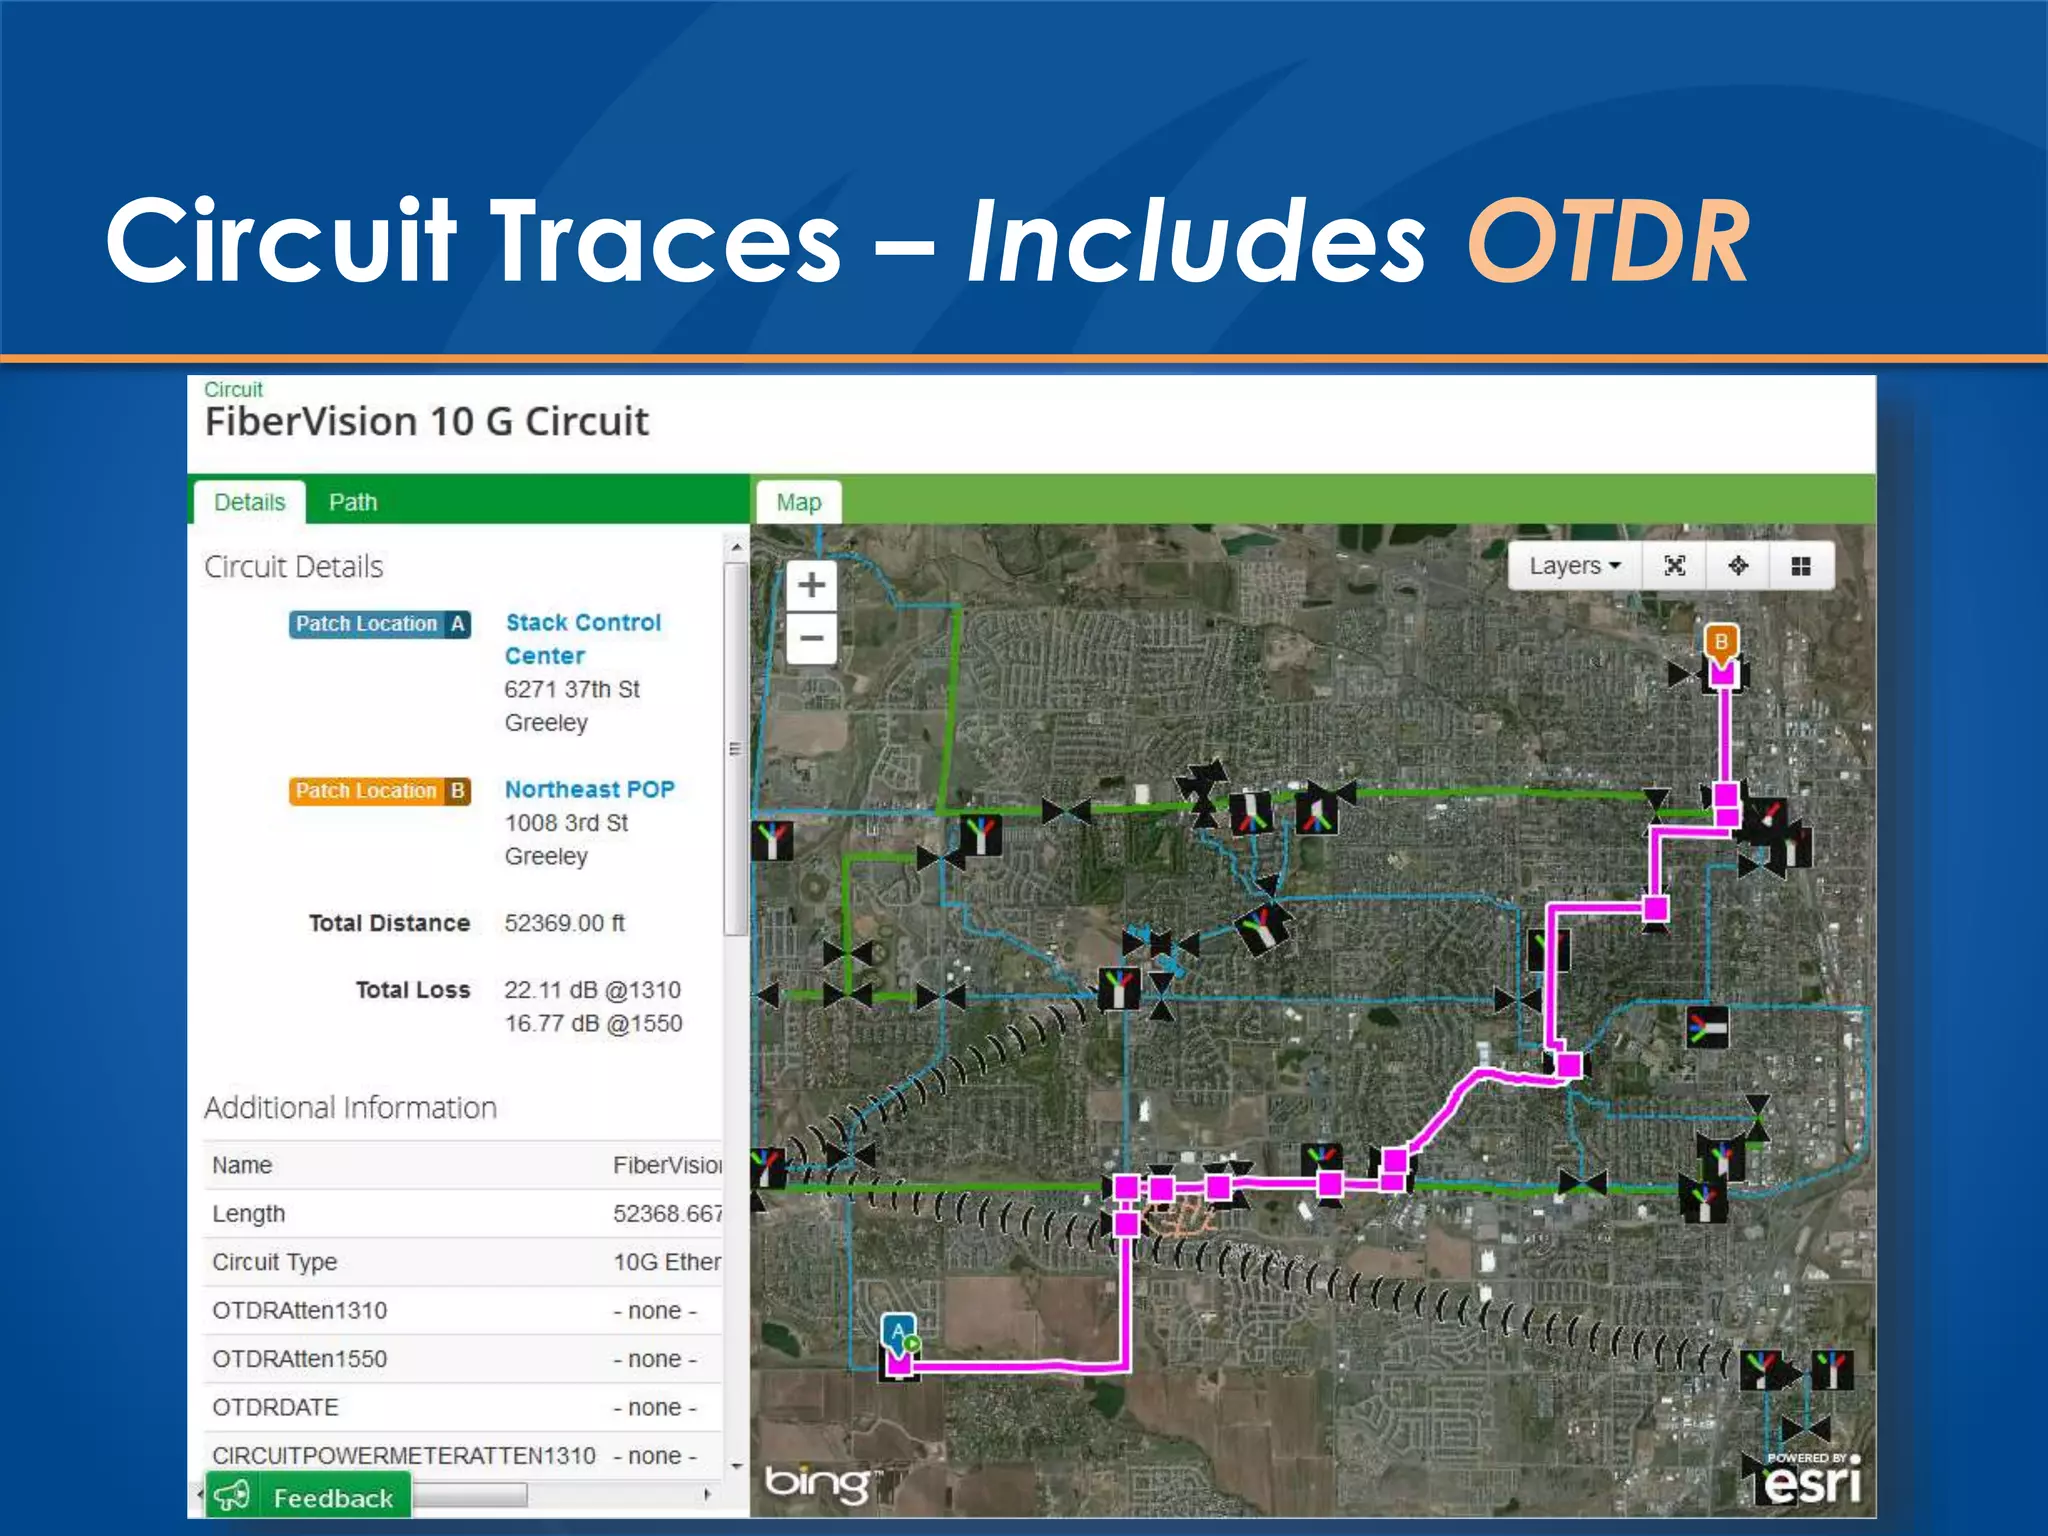
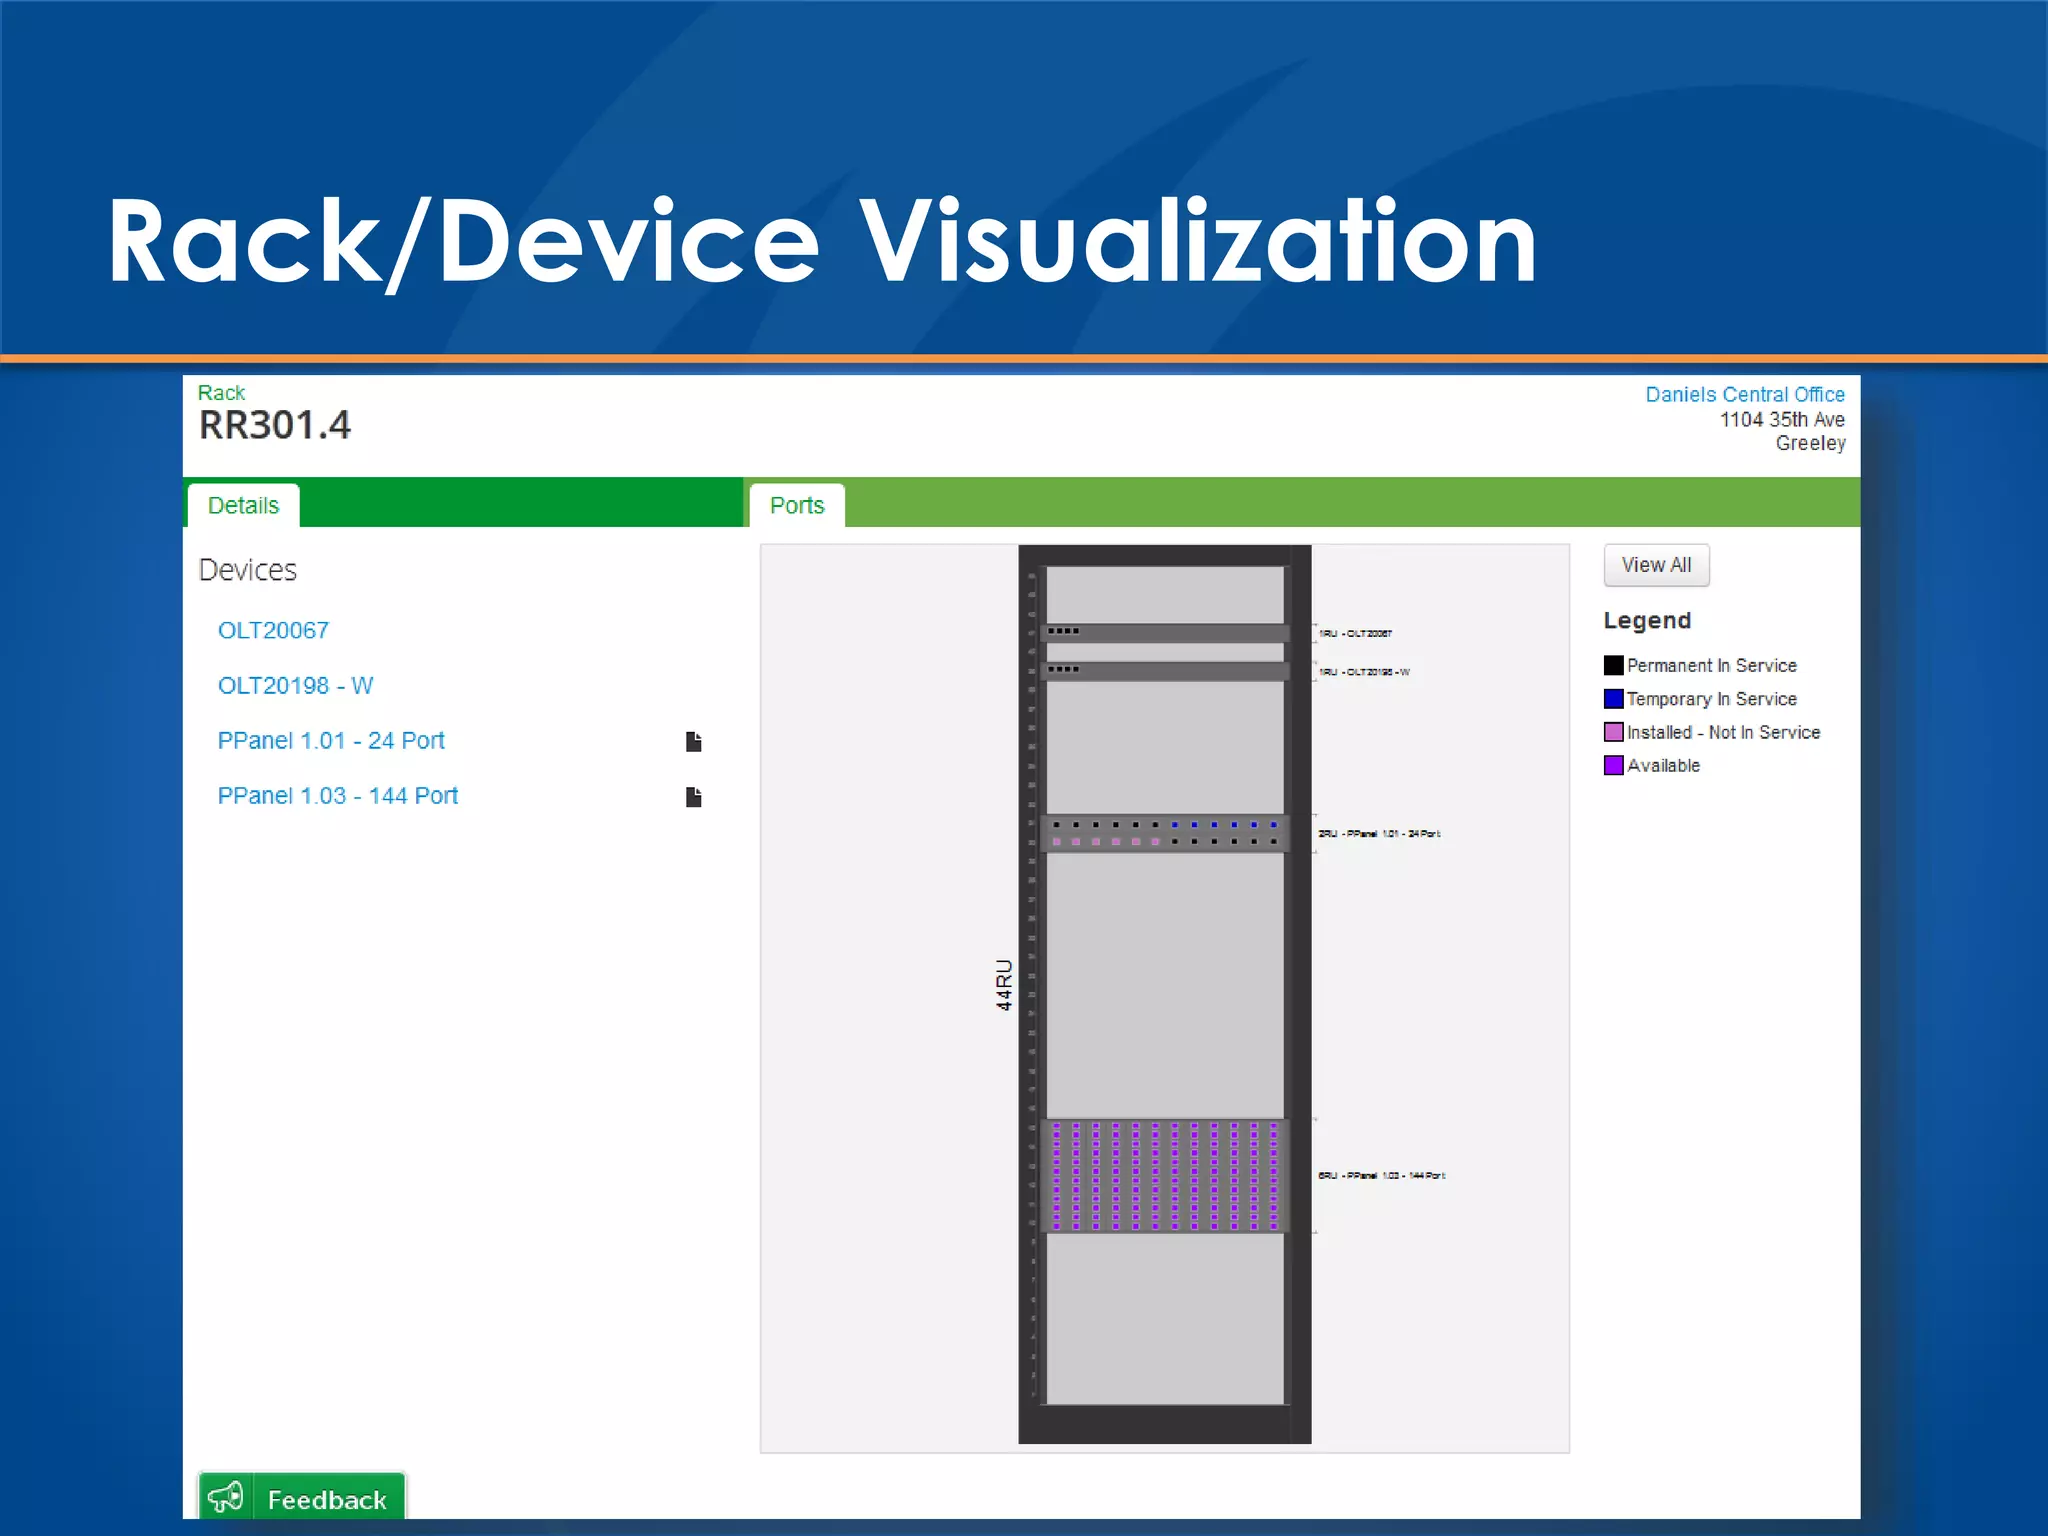
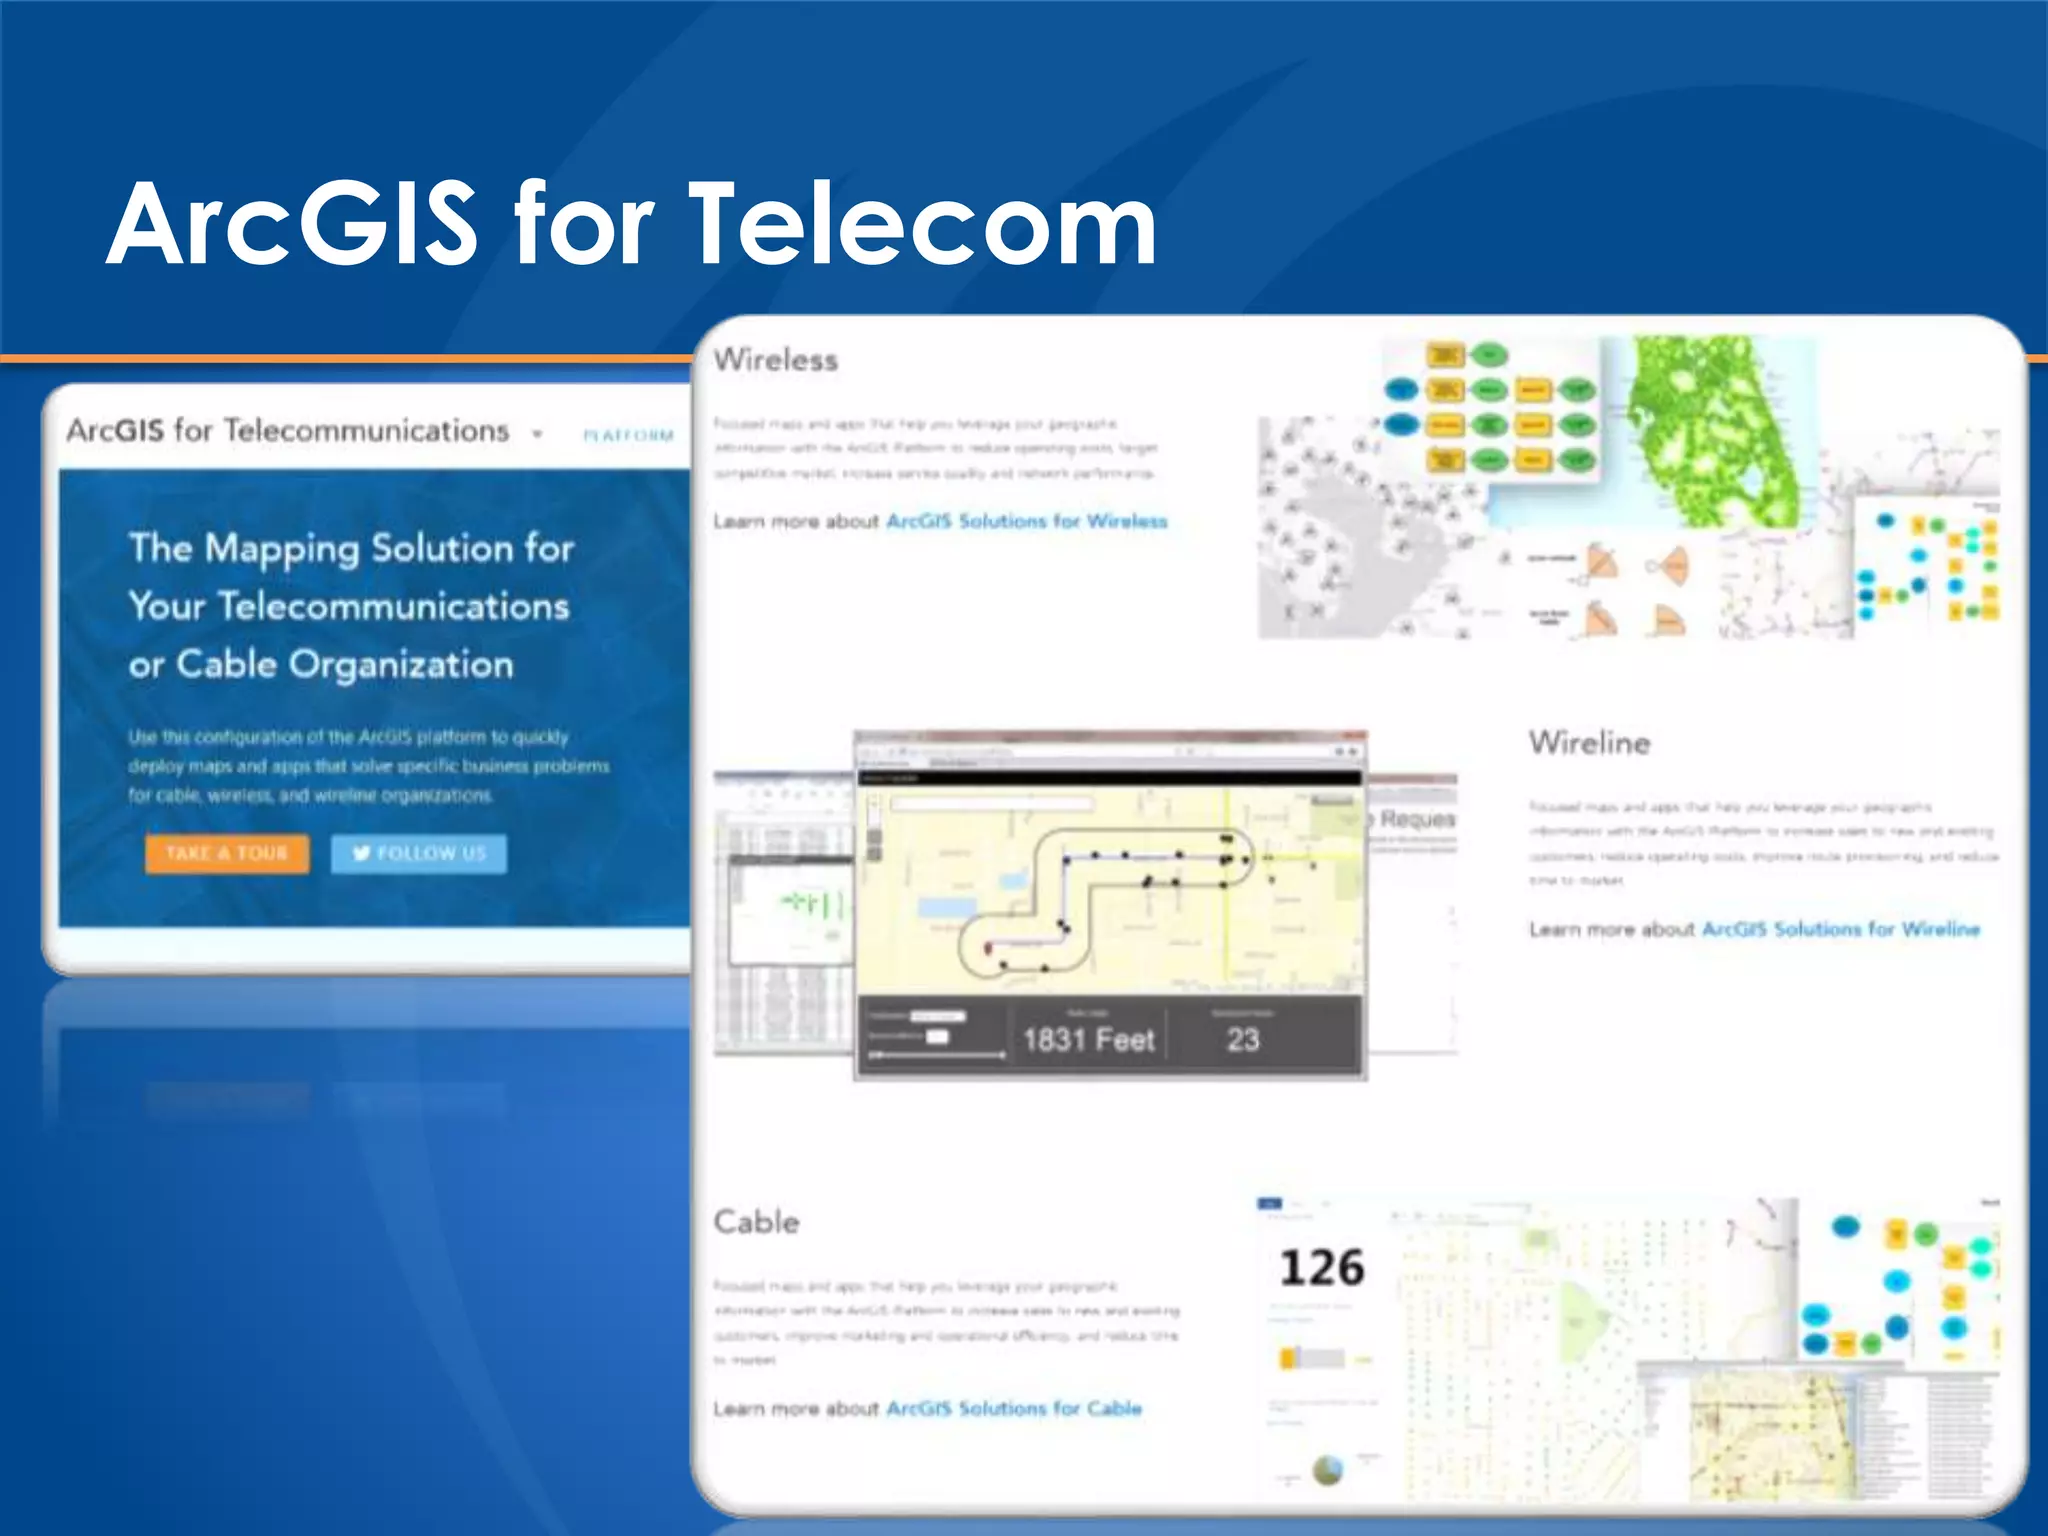


This document discusses using a GIS-based system to manage fiber optic networks for utilities. It outlines business drivers for such a system, including tracking high volumes of telecom assets and common issues with current methods. An ideal solution would use Esri ArcGIS for core mapping integrated with Schneider Electric's Fiber Manager to track connectivity and assets. Additional functionality discussed includes tracking logical provisioning to the circuit level and an online interface. Benefits cited include improved network planning, reduced outage times, and enhanced reporting.


![[Case study] Eugene Water & Electric Board: Bringing together disparate legac...](https://cdn.slidesharecdn.com/ss_thumbnails/eugenewaterelectric2012-130320052356-phpapp01-thumbnail.jpg?width=640&height=640&fit=bounds)