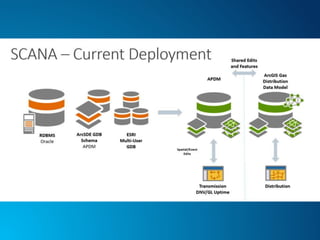
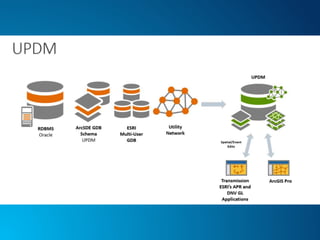
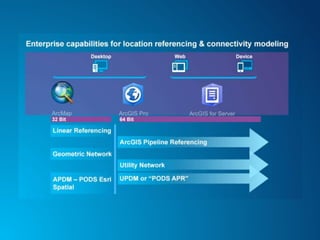
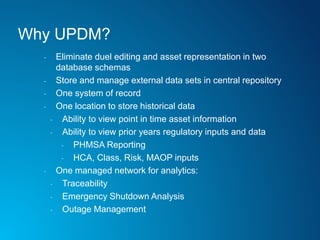
With the release of Esri's new ArcGIS Pipeline Referencing (APR) tools in 2017, we got to work immediately deploying the new extensions for our clients. This presentation will focus on SCANA Energy's APR implementation and lessons learned throughout the deployment. Topics will range from source data preparation, UPDM extensions, APR architecture, installation, licensing, APR core data loading and end user data editing workflows.
FME and Linear Referencing - Keeping the Product in the PipelinesSafe Software
The presentation shows a set of FME workbenches designed to improve (and make accessible) the display of relevant information to pipeline professionals. Dynamic Segmentation is more than displaying events on routes. It is the overlay, resolving, and mathematical processing of data stored in a complex and deep data models. FME has been instrumental in pulling the relevant data out of these databases and putting meaningful data into the hands of those who need and use it. Although this presentation focuses on pipelines it is highly relevant to any industry utilizing long thin transportation corridors such as roads, water and electric networks.
Presentation: This presentation gives a brief introduction to tools in ArcGIS and was designed for the Surface Water Quality Monitoring (SWQM) GIS training hosted by Texas Commission on Environmental Quality (TCEQ) staff.
Training: The goal of the SWQM GIS training course is to introduce beginner and intermediate GIS users within the TCEQ surface water monitoring network to the geospatial software, skills, analyses, and data most often used by water resource professionals. The training features presentations from a range of GIS experts from TCEQ, TPWD, and other organizations.
More information on the training: https://www.tceq.texas.gov/waterquality/monitoring/training
Clasificación de cobertura LiDAR Navarra con inteligencia artificialAlvaro Huarte
Presentación en las SIGLibre2019 del proyecto de Clasificación con Machine Learning y generación de MDT/MDS de la cobertura LiDAR 2017 de Navarra (14 puntos/m2)
Real-Time Processing of Spatial Data Using Kafka Streams, Ian Feeney & Roman ...HostedbyConfluent
Real-Time Processing of Spatial Data Using Kafka Streams, Ian Feeney & Roman Kolesnev | Current 2022
Kafka Streams applications can process fast-moving, unbounded streams of data. This gives us the capability to process and react to events from many sources in near real time as they converge in Kafka. However, if the events in these data streams have a spatial component and their spatial relationships with each other determine how they should be processed or reacted to, this raises some fundamental challenges. Determining that, for example, a person is within an area or that routes are intersecting requires access to geospatial operations which are not readily available in Kafka Streams.
In this talk, we will first set the scene with a geospatial 101. Then, using a simplified taxi hailing use case, we will look at two approaches for processing spatial data with Kafka Streams. The first approach is a naive approach which uses Kafka Streams DSL, geohashing and the Java Spatial4j library. The second approach is a prototype which replaces the RocksDB statestore with Apache Lucene (an embedded storage engine with powerful indexing, search and geospatial capabilities), and implements a stateful spatial join with the Transformer API.
This talk will give you an appreciation of geospatial use cases and how Kafka Streams could enable them. You will see the role the state store plays in stateful processing and the implications for geospatial processing. It will also show you what is involved in integrating a custom state store with Kafka Streams. Overall, this talk will give you an understanding of how you might go about building custom processing capabilities on top of Kafka Streams for your own use cases.
Scaling your Data Pipelines with Apache Spark on KubernetesDatabricks
There is no doubt Kubernetes has emerged as the next generation of cloud native infrastructure to support a wide variety of distributed workloads. Apache Spark has evolved to run both Machine Learning and large scale analytics workloads. There is growing interest in running Apache Spark natively on Kubernetes. By combining the flexibility of Kubernetes and scalable data processing with Apache Spark, you can run any data and machine pipelines on this infrastructure while effectively utilizing resources at disposal.
In this talk, Rajesh Thallam and Sougata Biswas will share how to effectively run your Apache Spark applications on Google Kubernetes Engine (GKE) and Google Cloud Dataproc, orchestrate the data and machine learning pipelines with managed Apache Airflow on GKE (Google Cloud Composer). Following topics will be covered: – Understanding key traits of Apache Spark on Kubernetes- Things to know when running Apache Spark on Kubernetes such as autoscaling- Demonstrate running analytics pipelines on Apache Spark orchestrated with Apache Airflow on Kubernetes cluster.
How can you avoid inconsistencies between Kafka and the database? Enter change data capture (CDC) and Debezium. By capturing changes from the log files of the database, Debezium gives you both reliable and consistent inter-service messaging via Kafka and instant read-your-own-write semantics for services themselves.
In this presentation we describe the design and implementation of Kafka Connect, Kafka’s new tool for scalable, fault-tolerant data import and export. First we’ll discuss some existing tools in the space and why they fall short when applied to data integration at large scale. Next, we will explore Kafka Connect’s design and how it compares to systems with similar goals, discussing key design decisions that trade off between ease of use for connector developers, operational complexity, and reuse of existing connectors. Finally, we’ll discuss how standardizing on Kafka Connect can ultimately lead to simplifying your entire data pipeline, making ETL into your data warehouse and enabling stream processing applications as simple as adding another Kafka connector.
Apache Spark Streaming in K8s with ArgoCD & Spark OperatorDatabricks
Over the last year, we have been moving from a batch processing jobs setup with Airflow using EC2s to a powerful & scalable setup using Airflow & Spark in K8s.
The increasing need of moving forward with all the technology changes, the new community advances, and multidisciplinary teams, forced us to design a solution where we were able to run multiple Spark versions at the same time by avoiding duplicating infrastructure and simplifying its deployment, maintenance, and development.
Database Structures – Relational, Object Oriented – ER diagram - spatial data models – Raster Data Structures – Raster Data Compression - Vector Data Structures - Raster vs Vector Models TIN and GRID data models - OGC standards - Data Quality.
Kafka Connect is a framework which connects Kafka with external Systems. It helps to move the data in and out of the Kafka. Connect makes it simple to use existing connector configuration for common source and sink Connectors.
UPDM & APR Implementation for Gas TransmissionSSP Innovations
With the release of Esri's ArcGIS Pipeline Referencing (APR) in early 2017, Memphis Light, Gas & Water (MLGW) identified the extensions as desirable tools to manage their gas transmission assets. The key driver for MLGW was the ability to utilize software within the Esri stack for editing linear referenced pipelines, viewing and reporting. This presentation will focus on MLGW’s APR implementation and include elements around the hardware/software architecture, Utility Pipeline Data Model, data migration across multiple sources, implementation of the Esri software and creation of a viewing/reporting application within Web App Builder.
The Linked Map project is part of the FP7 PlanetData project (http://planet-data.eu/), whose aim is to help organisations to get their big amounts of data exposed online in a useful form with quality. Regarding to this goal and as demonstration of the LMS technology (a transparent semantic proxy for WMS 1.3.0), the project Linked Map has developed a Web platform (http://linkedmap.unizar.es/crowdsourcing-platform/). This platform enables users to assess the quality of an automatic integration of INSPIRE data and Volunteer Geographic Information (VGI). The platform uses a LMS instance. This demonstration involves an experiment that combines in a meaningful way a big INSPIRE dataset that contains data from Annex I and Annex III themes (BCN/BTN25) with VGI data (OpenStreetMap).
The Linked Map project was developed by IAAA Lab (Universidad Zaragoza) and GeoSpatiumLab. These slides were presented at JIIDE 2014 (Lisbon)
Esri GeoConX 2016 White Paper Presentation by Peter Zimmermann of UDC Inc. and Robert Smith of Pacific Gas & Electric.
While recently converting their electric distribution sources, PG&E included an initiative to convert their GIS data into a standalone ArcSchematics model. The schematics model was developed to support the engineering group as well as PG&E‘s DMS outage management system and was tailored to provide a geo-schematic representation following major roadways to enhance locating of key primary system features. Software was developed to allow daily GIS updates to feed the schematics model directly thus greatly reducing latency between the two systems. Maintenance of schematics consists of daily executed minor whitespace management edits ensuring ease of use.
Apache Spark for RDBMS Practitioners: How I Learned to Stop Worrying and Lov...Databricks
This talk is about sharing experience and lessons learned on setting up and running the Apache Spark service inside the database group at CERN. It covers the many aspects of this change with examples taken from use cases and projects at the CERN Hadoop, Spark, streaming and database services. The talks is aimed at developers, DBAs, service managers and members of the Spark community who are using and/or investigating “Big Data” solutions deployed alongside relational database processing systems. The talk highlights key aspects of Apache Spark that have fuelled its rapid adoption for CERN use cases and for the data processing community at large, including the fact that it provides easy to use APIs that unify, under one large umbrella, many different types of data processing workloads from ETL, to SQL reporting to ML.
Spark can also easily integrate a large variety of data sources, from file-based formats to relational databases and more. Notably, Spark can easily scale up data pipelines and workloads from laptops to large clusters of commodity hardware or on the cloud. The talk also addresses some key points about the adoption process and learning curve around Apache Spark and the related “Big Data” tools for a community of developers and DBAs at CERN with a background in relational database operations.
A team of FME enthusiasts from Alabama Power Distribution will highlight several usage of FME desktop that help improve data workflows, deliver business results and boost user confidence in GIS deliverables. Topics will cover: pole inspection workflow, data conversion & automated mapping and parcel data. Highlights will include CAD-GIS translations, use of Avenza MapPublisher, Opendata (Soda), and geospatial pdf maps.
KNOWAGE evolution in 2022 mainly focuses on: new data preparation module and data federation in self-service process, augmented analytics to support every end-user touch point and provide automatic insights, usability and performance for a new effective UI, a core offering as SaaS ABI solution.
Conquering Hadoop and Apache Spark with Operational Intelligence with Akshay RaiDatabricks
At Linkedin, we have thousands of Hadoop and Spark users ranging from amateurs to experts who run a variety of jobs on our huge 2000-plus node clusters. In just a few years, the number of Hadoop and Spark jobs have grown from hundreds to thousands. With this ever increasing number of users and jobs, it becomes very crucial to have an efficient way to find answers to frequently asked questions like:
1) Why is my job running slow?
2) Why did my job get killed?
3) Can you send me an alert when my job is about to fail or miss SLA?
4) Do we have enough resources on the Hadoop cluster?
Having this information available with us will help in quicker debugging, alert based on anomalies, perform root cause analysis(RCA), identify workload patterns and perform capacity planning. To address this problem, we at Linkedin have built a Unified Grid Metrics Platform that captures and stores, current and historical job metrics. In our experience debugging and tuning jobs and interacting with our users, we have learnt a lot of lessons and have been integrating ideas and solutions into this system. For example, we have learned that capturing and storing the complete set of metrics and its history though fascinating is actually rarely useful just like the verbose logs in Spark. We have come up with some derived metrics and curated list of metrics which we track very closely at LinkedIn.
In this talk, we will discuss the architecture of how we built this platform for both Hadoop and Spark along with the huge challenges in collecting all the standard, derived and custom user metrics in real-time. We will see how this system allows users to build reporting dashboards, perform trend analysis, dimension analysis and view correlated metrics together.
Opal: Simple Web Services Wrappers for Scientific ApplicationsSriram Krishnan
The grid-based infrastructure enables large-scale scientific applications to be run on distributed resources and coupled in innovative ways. However, in practice, grid resources are not very easy to use for the end-users who have to learn how to generate security credentials, stage inputs and outputs, access grid-based schedulers, and install complex client software. There is an imminent need to provide transparent access to these resources so that the end-users are shielded from the complicated details, and free to concentrate on their domain science. Scientific applications wrapped as Web services alleviate some of these problems by hiding the complexities of the back-end security and computational infrastructure, only exposing a simple SOAP API that can be accessed programmatically by application-specific user interfaces. However, writing the application services that access grid resources can be quite complicated, especially if it has to be replicated for every application. In this presentation, we present Opal which is a toolkit for wrapping scientific applications as Web services in a matter of hours, providing features such as scheduling, standards-based grid security and data management in an easy-to-use and configurable manner
Working with SAP Business Warehouse Elements in SAP Datasphere_.pdfPanduM7
SAP Datasphere enables a business data fabric architecture that uniquely harmonizes mission-critical data throughout the organization, unleashing business experts to make the most impactful decisions. It combines previously discrete capabilities into a unified service for data integration, cataloging, semantic modeling and data-warehousing. It also virtualizes workloads spanning SAP and non-SAP data. SAP Datasphere preserves the full meaning and context of SAP data across systems and clouds. It integrates with other data vendor’s platforms, delivering seamless and scalable access to one authoritative source for your most valuable enterprise data
The new Esri Utility Network was released into beta earlier this year. SSP has worked with many utility customers to extensively test the new network including data migration, creating circuits & systems, editing data, and utility tracing. Join SSP and Intermountain REA to review how the testing has gone, what works well, and what needs improvement in the new Utility Network. We will also cover key aspects of the new network that will affect your utility so you can be prepared for your move to the Utility Network!
The Query Service is the new platform solution for querying a variety of data sources. The goal of Query Service is that administrators can configure a metadata description of the data source that can then be used by end users without detailed knowledge of the underlying data source. This session explains how to configure Query Service data sources and use them with the RESTful API or component collection.
DEVNET-1153 Enterprise Application to Infrastructure Integration – SDN AppsCisco DevNet
We've all heard about SDN and how SDN provides flexible networks to solve networks operation challenges. With respect to SDN Applications, the most obvious conversation is about network applications and services. But today we will discuss how we at Cisco are addressing business challenges and impact business outcomes directly by connecting two disparate worlds of Enterprise applications (EA) and Networking stack using Cisco Integration Platform (CIP).
Similar to ArcGIS Pipeline Referencing - Lessons Learned (20)
From SSP's Illuminate Webinar Series: Built just for utilities, SSP Lifecycle is a full-featured work and asset management solution that simplifies the complexity of managing and maintaining network assets. From initial design right through to retirement, Lifecycle has all the features you need – and none you don’t – to proactively manage and intelligently operate your utility network. Powerful and robust, Lifecycle works well either as a standalone solution or side-by-side with existing work and asset management systems to deliver increased value, efficiency, and engagement.
In 2015, CoServ made the determination to migrate all asset data management into IBM Maximo. We opted to leverage ArcGIS for Server as our main integration point between Maximo and GIS. By hosting our utility infrastructure data in feature services, we allowed Maximo to view spatially enabled information for visualization within its own environment. Additionally, Maximo updates feature classes and their related tables based upon changes made in Maximo seamlessly through the services. By leveraging Global IDs and GUIDs as the direct linkage between Maximo assets and GIS features, CoServ is now able to ingest Maximo assets directly into the GIS environment. This presented GIS end users access to asset related information in their native environment. The migration has been a highly successful implementation. It has alleviated the strain on GIS to manage and maintain asset related information while still providing a way for GIS to access it. This solution has provided a stable integration between the two environments with minimal customizations. By thinking a bit out of the box, CoServ was able to create a unique integration that solved all of our problems.
The Utility Network is the on the horizon. Duane Holt from Intermountain Rural Electric Association (IREA) has had a chance to use the beta of the Utility Network. He will share his experience and give his positives and negatives of this new technology. John Coleman from SSP Innovations, an Esri partner, will demonstrate the tools they have been building to answer the questions and concerns IREA and other utilities have about the Utility Network. This will include a few demonstrations covering each of the topics that IREA experienced during the Utility Network jumpstart.
MTEMC’s State 0 Changes with 1700+ Versions IntactSSP Innovations
MTEMC recently completed a major project to merge multiple geodatabases into a single new GDB, apply data model changes along with corresponding data migration, and to implement voltage levels with feeder manager 2.0 to provide connectivity upstream of a circuit breaker. Several of these changes required the geodatabase to be at state 0 (no versions). MTEMC utilized SSP Innovations' All Edits State 0 technology to successfully complete this project while maintaining their 1700+ design versions.
Maximizing ROI on Utility Work Management SystemsSSP Innovations
Utility IT Departments must carefully assess several factors when searching for and acquiring new enterprise systems that ultimately affect the overall success or failure of the system. This presentation will review important high value considerations of Work Management Systems at utility organizations. Considerations such as implementation personnel expertise, extensibility, configurability, support, and system data models all play a role in the end cost of a system. Each of these factors and more will be examined in light of examples provided by SSP’s Work Management System, WFM aka Workforce Management.
Connexus Energy needed to find a new way to report outages to their Responder™ OMS beyond traditional IVR. With a combination of web portal, middleware and a Multispeak-based web service, customers can now log into the portal and report outages. This allows Connexus to handle more outage calls by alleviating the restriction on the number of phone lines required, and reduces the time it takes to report an outage. Learn more about the technologies used and the outcome in this informative session.
CoServ has been using ArcGIS/ArcFM/Designer™ successfully for over 10 years. As part of a recent Maximo/GIS integration effort, CoServ has reviewed its business workflows with SSP. In particular, and within GIS, CoServ’s designs life cycles have been altered to include: Pre-Posting to DEFAULT, and removal from SDE of the Esri version as soon as the design is in construction. As well as Partial Energization as a means to gradually post portions of as-built network into DEFAULT.
The most important benefits from introducing these steps are: A.- Early availability to the whole company of GIS data regarding designs under construction. B.- Network energization status (and other details) monitored during the construction phases of a design. C.- Minimizing the number of active versions in the SDE state tree. The first two benefits improve overall company-wide business, by having early and timely knowledge of the projects being constructed in the field, overlaid on the current distribution network. While minimizing the versions dramatically improves the GDB performance and efficiency.
Rule-Driven, Fully-Configurable Asset Tracking with GISSSP Innovations
For the last seven years MLGW has successfully implemented GIS using ArcGIS/ArcFM ™. The GIS serves as an enterprise backbone for a variety of business applications where utility assets play a crucial role: Inspection, Maintenance, New Construction, OMS, among others.To support the life cycle of MLGW’s assets, SSP has implemented a rule-driven and fully-configurable asset tracking mechanism built into the GIS. Rules specified by different business units determine: What network elements are to be tracked as assets. What attributes of those assets are to be monitored. How and when these attributes may change.
CoServ has been preparing for the future by adding several connections to their OMS. These connections have evolved over the years and now include: SCADA-initiated device status, outage creation and status through IVR, and web-based outage tools for reporting and status. This session will cover the evolution and future plans for utlizing the information from OMS and the business value the existing tools have made for CoServ and their customers.
State Zero: Middle Tennessee Electric Membership CorporationSSP Innovations
MTEMC recently completed a major project to merge multiple geodatabases into a single new GDB, apply data model changes along with corresponding data migration, and to implement voltage levels with feeder manager 2.0 to provide connectivity upstream of a circuit breaker. Several of these changes required the geodatabase to be at state 0 (no versions). MTEMC utilized SSP Innovations’ All Edits State 0 technology to successfully complete this project while maintaining their 1700+ design versions.
Utilizing Esri Out of the Box Tools for Field Data VerificationSSP Innovations
This Esri PUG presentation focused on utilizing core Esri technologies to solve workflows for data management, field verification and collection. Collector for ArcGIS deployments were reviewed and demoed to show how pipeline operators can easily implement field applications for workflows including structure (Gas HCA) and/or asset verification, collection or updates.
Connexus Energy standardized on Clevest’s Mobile Workforce applications and Schneider Electric’s Responder product for Outage Management, partnering with SSP Innovations and Clevest to build the bridge between the two products. SSP and Clevest integrated their systems using a Multispeak interface for outage data. Attend this session to learn more about how the two vendors collaborated with Connexus on the integration process, and the results achieved.
Opening the Outage Door: Integrating OMS into CISSSP Innovations
Tri-County Electric Co-Op breaks the OMS data barrier by integrating their existing ATS OpenOne CIS system with Schneider Electric’s Responder OMS. CSR’s now have the ability to: retrieve past outage information for the customer account; input new outage calls on behalf of the customer; and retrieve real-time outage information for existing outages. Customers are now able to enter outages from web and mobile technologies. SSP Innovations bridged the gap with a Multispeak-based web service.
From Field to Office: Streamlining the Management of Streetlight & Cover-ups ...SSP Innovations
This presentation describes the recent implementation of a Web-based Streetlight & Cover-ups Work Order Management System for Norwich Public Utilities (NPU). NPU required a more streamlined approach for managing the process for incoming public calls regarding damaged, inoperable streetlights in need of attention or repair. Location aware work orders hosted in the utilities’ GIS originate from citizens, public safety and other members of the community are efficiently routed from dispatch to utility crews. Mapped-based Work Orders optimize the execution of crew assignment and repair work.
Transformer Management. Full Lifecycle Support Using GIS and a Web Applicat...SSP Innovations
NPU underwent an effort to migrate their Transformer Management system from an Access database to a web application from SSP Innovations. All transformer data was migrated to the web application, which provided better access and control over the data. Customizations were then implemented to integrate the web application into NPU’s versioned GIS. This approach to transformer management reduced data redundancy and prevented data inaccuracy.
Provisioning Bandwidth & Logical Circuits Using Telecom-Based GIS.SSP Innovations
Those that have implemented Fiber Manager understand that the product focuses on managing the physical infrastructure of your telecom network including fiber optic, microwave, copper, and various other communication mediums. However, many customers have long been interested in managing the logical network in addition to the physical infrastructure. And this means managing bandwidth allocation to the various users, systems, services, or customers whose traffic traverses your physical facilities. Join us for this session as we explore how Tri-State G&T is working to customize Fiber Manager to include the provisioning of their logical circuits from an OC-192 all the way down to a DS0 with everything in between. The future of Fiber Manager may be closer than you think!
Managing Massive Updates - Using GIS to Fuel Gas ComplianceSSP Innovations
NIPSCO was required to undergo massive data updates to their GIS to meet new gas regulation. A series of projects allowed for the rectification of all gas transmission assets and the manual update of system-wide records to accommodate the requirements. SSP technology was implemented to allow for outsourced updates to be replayed into the versioned production GIS while maintaining fulltime day-to-day editing. This provided maximum flexibility while minimizing downtime and any performance impact.
Enterprise Audit Tracking at CenterPoint Energy, Show Me the Edits!SSP Innovations
Centerpoint posts hundreds of versions per day coming from a large base of editors. This session covers an implementation of SSP All Edits technology to capture, search, and visualize attribute and geometry edits in each of the versions long after the version has been posted. Centerpoint can search for edits across the versions by work order and will keep the history of posted edits indefinitely using a new archival process. See the power of visualizing the who, what, and where of your edits!
Transformer Loading, Driving Enterprise Decisions with ArcGIS OnlineSSP Innovations
In the past MTEMC has oversized their transformers across the utility due to a lack of consumption data in GIS. MTEMC joined SSP Innovations to auto-load SAP consumption data, perform aggregation for peak usage, and to visualize the data in ArcGIS Online via a thematic map. Field troubleshooters use Collector for ArcGIS to view the load profile for any transformer showing peak usage against the transformer size. This results in cost savings and has generated drivers for many other uses of the data and of ArcGIS Online.
Read| The latest issue of The Challenger is here! We are thrilled to announce that our school paper has qualified for the NATIONAL SCHOOLS PRESS CONFERENCE (NSPC) 2024. Thank you for your unwavering support and trust. Dive into the stories that made us stand out!
Francesca Gottschalk - How can education support child empowerment.pptxEduSkills OECD
Francesca Gottschalk from the OECD’s Centre for Educational Research and Innovation presents at the Ask an Expert Webinar: How can education support child empowerment?
The Roman Empire A Historical Colossus.pdfkaushalkr1407
The Roman Empire, a vast and enduring power, stands as one of history's most remarkable civilizations, leaving an indelible imprint on the world. It emerged from the Roman Republic, transitioning into an imperial powerhouse under the leadership of Augustus Caesar in 27 BCE. This transformation marked the beginning of an era defined by unprecedented territorial expansion, architectural marvels, and profound cultural influence.
The empire's roots lie in the city of Rome, founded, according to legend, by Romulus in 753 BCE. Over centuries, Rome evolved from a small settlement to a formidable republic, characterized by a complex political system with elected officials and checks on power. However, internal strife, class conflicts, and military ambitions paved the way for the end of the Republic. Julius Caesar’s dictatorship and subsequent assassination in 44 BCE created a power vacuum, leading to a civil war. Octavian, later Augustus, emerged victorious, heralding the Roman Empire’s birth.
Under Augustus, the empire experienced the Pax Romana, a 200-year period of relative peace and stability. Augustus reformed the military, established efficient administrative systems, and initiated grand construction projects. The empire's borders expanded, encompassing territories from Britain to Egypt and from Spain to the Euphrates. Roman legions, renowned for their discipline and engineering prowess, secured and maintained these vast territories, building roads, fortifications, and cities that facilitated control and integration.
The Roman Empire’s society was hierarchical, with a rigid class system. At the top were the patricians, wealthy elites who held significant political power. Below them were the plebeians, free citizens with limited political influence, and the vast numbers of slaves who formed the backbone of the economy. The family unit was central, governed by the paterfamilias, the male head who held absolute authority.
Culturally, the Romans were eclectic, absorbing and adapting elements from the civilizations they encountered, particularly the Greeks. Roman art, literature, and philosophy reflected this synthesis, creating a rich cultural tapestry. Latin, the Roman language, became the lingua franca of the Western world, influencing numerous modern languages.
Roman architecture and engineering achievements were monumental. They perfected the arch, vault, and dome, constructing enduring structures like the Colosseum, Pantheon, and aqueducts. These engineering marvels not only showcased Roman ingenuity but also served practical purposes, from public entertainment to water supply.
Operation “Blue Star” is the only event in the history of Independent India where the state went into war with its own people. Even after about 40 years it is not clear if it was culmination of states anger over people of the region, a political game of power or start of dictatorial chapter in the democratic setup.
The people of Punjab felt alienated from main stream due to denial of their just demands during a long democratic struggle since independence. As it happen all over the word, it led to militant struggle with great loss of lives of military, police and civilian personnel. Killing of Indira Gandhi and massacre of innocent Sikhs in Delhi and other India cities was also associated with this movement.
Instructions for Submissions thorugh G- Classroom.pptxJheel Barad
This presentation provides a briefing on how to upload submissions and documents in Google Classroom. It was prepared as part of an orientation for new Sainik School in-service teacher trainees. As a training officer, my goal is to ensure that you are comfortable and proficient with this essential tool for managing assignments and fostering student engagement.
Introduction to AI for Nonprofits with Tapp NetworkTechSoup
Dive into the world of AI! Experts Jon Hill and Tareq Monaur will guide you through AI's role in enhancing nonprofit websites and basic marketing strategies, making it easy to understand and apply.
June 3, 2024 Anti-Semitism Letter Sent to MIT President Kornbluth and MIT Cor...Levi Shapiro
Letter from the Congress of the United States regarding Anti-Semitism sent June 3rd to MIT President Sally Kornbluth, MIT Corp Chair, Mark Gorenberg
Dear Dr. Kornbluth and Mr. Gorenberg,
The US House of Representatives is deeply concerned by ongoing and pervasive acts of antisemitic
harassment and intimidation at the Massachusetts Institute of Technology (MIT). Failing to act decisively to ensure a safe learning environment for all students would be a grave dereliction of your responsibilities as President of MIT and Chair of the MIT Corporation.
This Congress will not stand idly by and allow an environment hostile to Jewish students to persist. The House believes that your institution is in violation of Title VI of the Civil Rights Act, and the inability or
unwillingness to rectify this violation through action requires accountability.
Postsecondary education is a unique opportunity for students to learn and have their ideas and beliefs challenged. However, universities receiving hundreds of millions of federal funds annually have denied
students that opportunity and have been hijacked to become venues for the promotion of terrorism, antisemitic harassment and intimidation, unlawful encampments, and in some cases, assaults and riots.
The House of Representatives will not countenance the use of federal funds to indoctrinate students into hateful, antisemitic, anti-American supporters of terrorism. Investigations into campus antisemitism by the Committee on Education and the Workforce and the Committee on Ways and Means have been expanded into a Congress-wide probe across all relevant jurisdictions to address this national crisis. The undersigned Committees will conduct oversight into the use of federal funds at MIT and its learning environment under authorities granted to each Committee.
• The Committee on Education and the Workforce has been investigating your institution since December 7, 2023. The Committee has broad jurisdiction over postsecondary education, including its compliance with Title VI of the Civil Rights Act, campus safety concerns over disruptions to the learning environment, and the awarding of federal student aid under the Higher Education Act.
• The Committee on Oversight and Accountability is investigating the sources of funding and other support flowing to groups espousing pro-Hamas propaganda and engaged in antisemitic harassment and intimidation of students. The Committee on Oversight and Accountability is the principal oversight committee of the US House of Representatives and has broad authority to investigate “any matter” at “any time” under House Rule X.
• The Committee on Ways and Means has been investigating several universities since November 15, 2023, when the Committee held a hearing entitled From Ivory Towers to Dark Corners: Investigating the Nexus Between Antisemitism, Tax-Exempt Universities, and Terror Financing. The Committee followed the hearing with letters to those institutions on January 10, 202
3. SCANA – Transmission System
• South Carolina & North Carolina Gas Transmission
- South Carolina Electric and Gas (SCE&G)
- Public Service of North Carolina (PSNC)
• Total Transmission Mileage ~ 1000 Miles
- SCE&G: 453 Miles
- PSNC: 545 Miles
4. SCANA – GIS Environments
• SCEG GIS
- South Carolina SCANA Gas Transmission
- ArcGIS Pipeline Data Model
- South Carolina SCANA Gas Distribution
- ArcGIS Gas Distribution Data Model
- Current GIS Environment
- ArcGIS 10.2.1
• PSNC GIS
- Current GIS Environment
- Smallworld
- Transmission and Distribution data managed within the same
SW model/tools
5. Project Overview - Transmission
• Consolidation and Migration of SCEG (APDM) & PSNC
(Smallworld) gas assets into Utility Pipeline Data Model (UPDM)
• Implementation of ArcGIS Pipeline Referencing Tools
- ArcGIS Pro Extension – Centerline Editing
- ArcGIS Server Extenstion – Web Event Editing
- ArcGIS Desktop Extension – APR Configuration
• DNV GL – Synergi Pipeline
- Risk
- MAOP
- HCA/Class
- ILI/Survey Data Tools
6. Project Overview - Distribution
• Consolidation and Migration of SCEG (ArcGIS Gas
Distribution Data Model) & PSNC (Smallworld) gas
assets into Utility Pipeline Data Model (UPDM)
• Distribution and database efforts (UPDM, migration) led
by team of Esri Business Partners
• Focus for todays presentation will be on the Transmission
components.
11. Why UPDM?
- Eliminate duel editing and asset representation in two
database schemas
- Store and manage external data sets in central repository
- One system of record
- One location to store historical data
- Ability to view point in time asset information
- Ability to view prior years regulatory inputs and data
- PHMSA Reporting
- HCA, Class, Risk, MAOP inputs
- One managed network for analytics:
- Traceability
- Emergency Shutdown Analysis
- Outage Management
12. Why UPDM?
- GIS – Management: Single Database Infrastructure
- Backups, DB Tuning, DB Management
- Applications and Integrations
- Ability to program and configure against one location
- Streamlined integration points
- Clarity for the User Community
- Regulatory Reporting, Asset Views, Mileage, Summaries all
coming from one centralized location
- No need to compare and/or combine data from multiple locations
for reporting
- Future integrations with one GIS database for scheduling & WFM
- Ability to extend the viewing and consuming capabilities from one
centralized database
- ArcGIS Enterprise
- MAKE OUR GIS A DECISION MAKING TOOL!
14. Early Adopters
• First companies on board, including SCANA, find UPDM
appealing since both the distribution and transmission gas
assets can be stored within the same enterprise
geodatabase
• Operators seeing the benefit of Esri out of the box tools
versus third party software products for core pipeline
management
• ArcGIS Pipeline Referencing – Centerline & Event
Management
• Pro – Distribution
15. Early Adopters
• Pure transmission operators (gas or liquids) have
historically stored in PODS (Relational/Spatial) or APDM
• With PODS Next Generation on the horizon and the
perceived jump from APDM to UPDM, we’ve found that
pure transmission operators are road-mapping and
planning prior to making the move
- Integration points to current PODS or APDM model
- Application compatibility (HCA/Class, Risk, MAOP/MOP
and Alignment Sheet Generation)
- Migration and Esri Version Upgrade Planning
17. Data, Data, Data
• How are pipeline routes being stored in the new model?
- Past models, stored pipelines and systems in StationSeries
and LineLoop/LineLoopHierarchy tables.
- UPDM…review existing systems hierarchy and make key
decisions for modeling the pipeline LRS networks
• Do you still need historical stationing?
• Simply utilize continuous network and manage true pipeline
length/location?
• SCANA:
• PSNC Smallworld pipeline management versus SCEG Esri
(APDM) Data Management
• P_ContinuousNetwork
18. Data, Data, Data
• Data Mapping Phase
- Example: APDM.PipeSegment & APDM.Coating -> UPDM.P_Pipes
• UPDM Database Extensions
- Where is data duplicated?
- Where can we consolidate?
- Between both source datasets or within the same
- What fields are truly needed to support GIS asset and integrity
management
• Phased Data Migrations
- End User Review
- Application Testing
19. Data, Data, Data
• Data Migration
- Team Effort Between Esri Business Partners
• Established empty UPDM Schema
- Transmission
- Distribution
- Shared Features (P_Pipes, P_Fittings, P_Valves)
• Configure APR
- LRS Networks, LRS Events, etc
• Migrate Data from PSNC & SCEG
20. Data, Data, Data
• Current Project Utilizes FME (Smallworld) & Scripting
• Don’t discount the APR Toolbox!
- Streamlined Workflows
- GIS Centric
- Makes data loading a non-DBA task
- Append Events (Location Referencing Tools)
- Generate shapes and Event GUIDs
- Add, Retire or Replace
23. ArcGIS Pipeline Referencing Extension
• Desktop
- ArcMap/ArcCatalog Extension
- Create Empty UPDM Schema
- LRS Network Creation/Configuration
- LRS Event Creation/Configuration
- Event Responses
- Route Loading/Generation
- Calibration Point Loading/Updating
- Intersection Events
- Location Referencing Tools
• ArcGIS Pro
- Centerline/Route Editing
- Create, Update, Retire Route
Representations
- Bulk Data Loading – GP Models
• ArcGIS Server
- Web Based Point/Linear Event
(Feature) Editing
- Published Map Services
24. Licensing and Deployment
• ArcGIS Pro Location Referencing Extension –
- Extension is part of the Pro Install!
- Named User versus Single Use?
- Single Use License: Provision APR as a single use on the same machine
25. Licensing and Deployment
• ArcGIS Pro Location Referencing Extension –
- Named User License: Use Pro License and the APR License
- Much easier to manage/implement
- Use Pro from any machine and utilize named user account for authentication
- Apply both to the named user via My Organization
26. Licensing and Deployment
• ArcGIS Desktop Location Referencing Extension
- Install the APR Extension
- Licensing Extension, user must enter text of Location Referencing Desktop
- Enable Extension within ArcMap/ArcCatalog
27. Licensing and Deployment
• ArcGIS Server Location Referencing Extension
- Must have ArcGIS Server 10.5 Installed
- When publishing Map Service, simply enable APR Web Editing
29. Centerline and Data Loading
• For this project, we found it more streamlined to create the APR
core outside of the enterprise GDB and migrate once completed
- Centerline/Centerline Sequence/Calibration Point/Continuous
Network
- LRS Network/Event Configuration
• Migrate core features and LRS tables
- Follow Esri Documentation!
• The features/data that are migrated (outside the core) will assume
the LRS Network properties and users can proceed with using the
APR applications.
30. Centerline and Data Loading
• Append Events – Location Referencing Toolbox
- Your new best friend!
- Event GUIDs
- Create shapes from source data in a tabular format
- ROUTEID, M Value (From/To)
- Add, Retire or Replace
- Field Mapping – Visual Representation of Mapped Columns