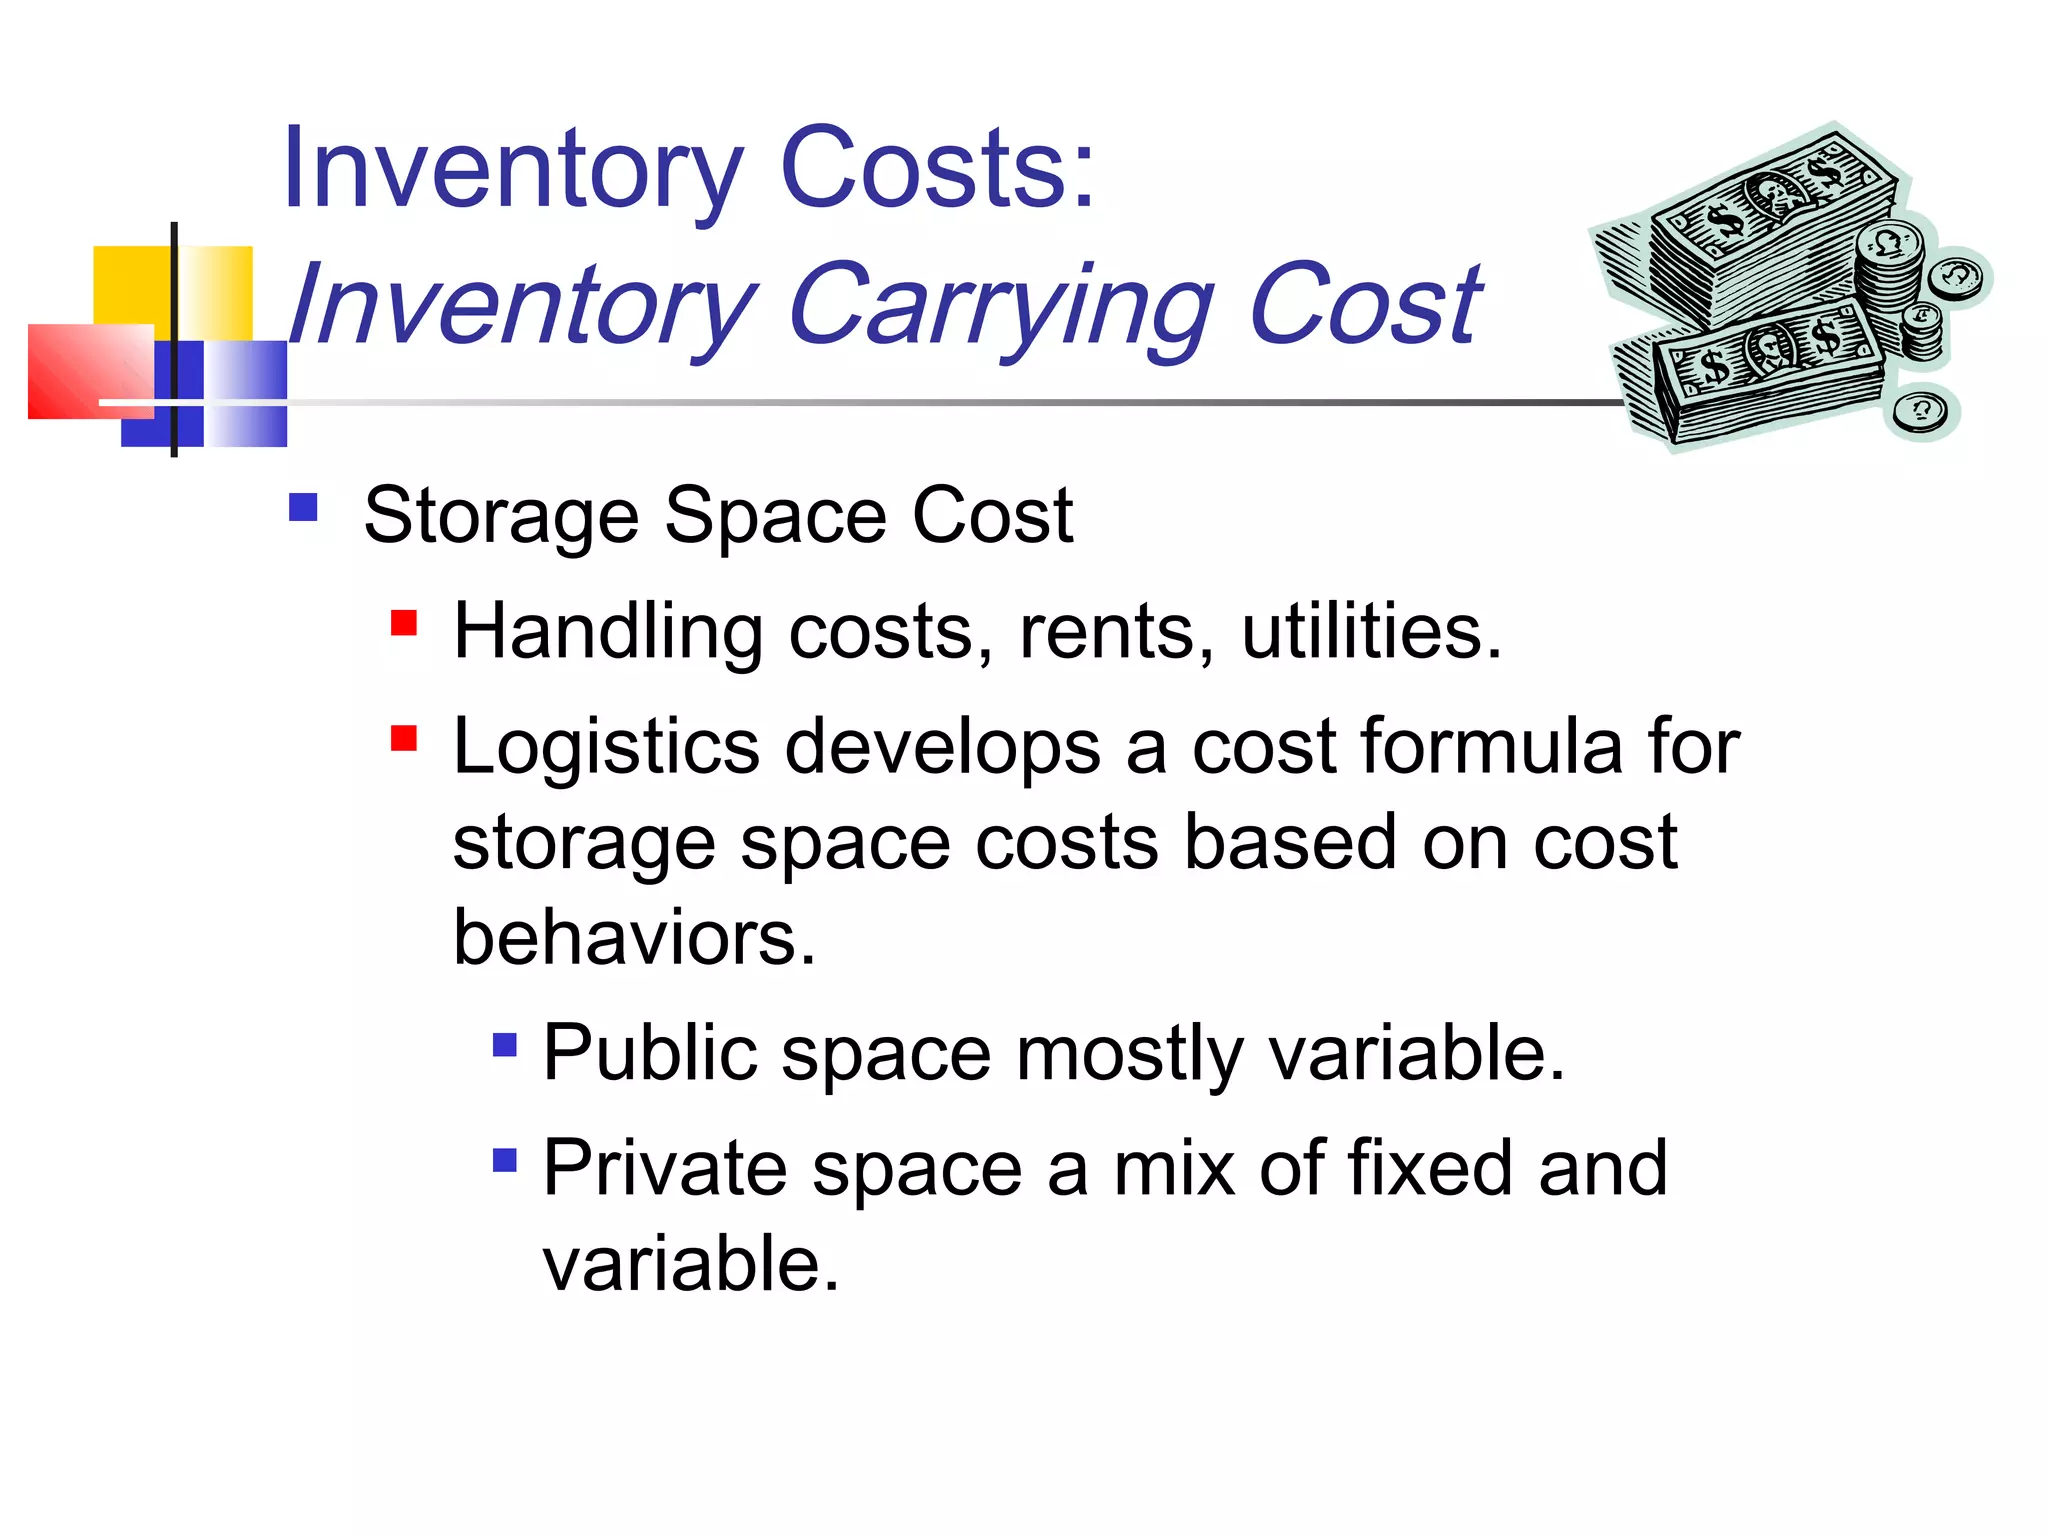
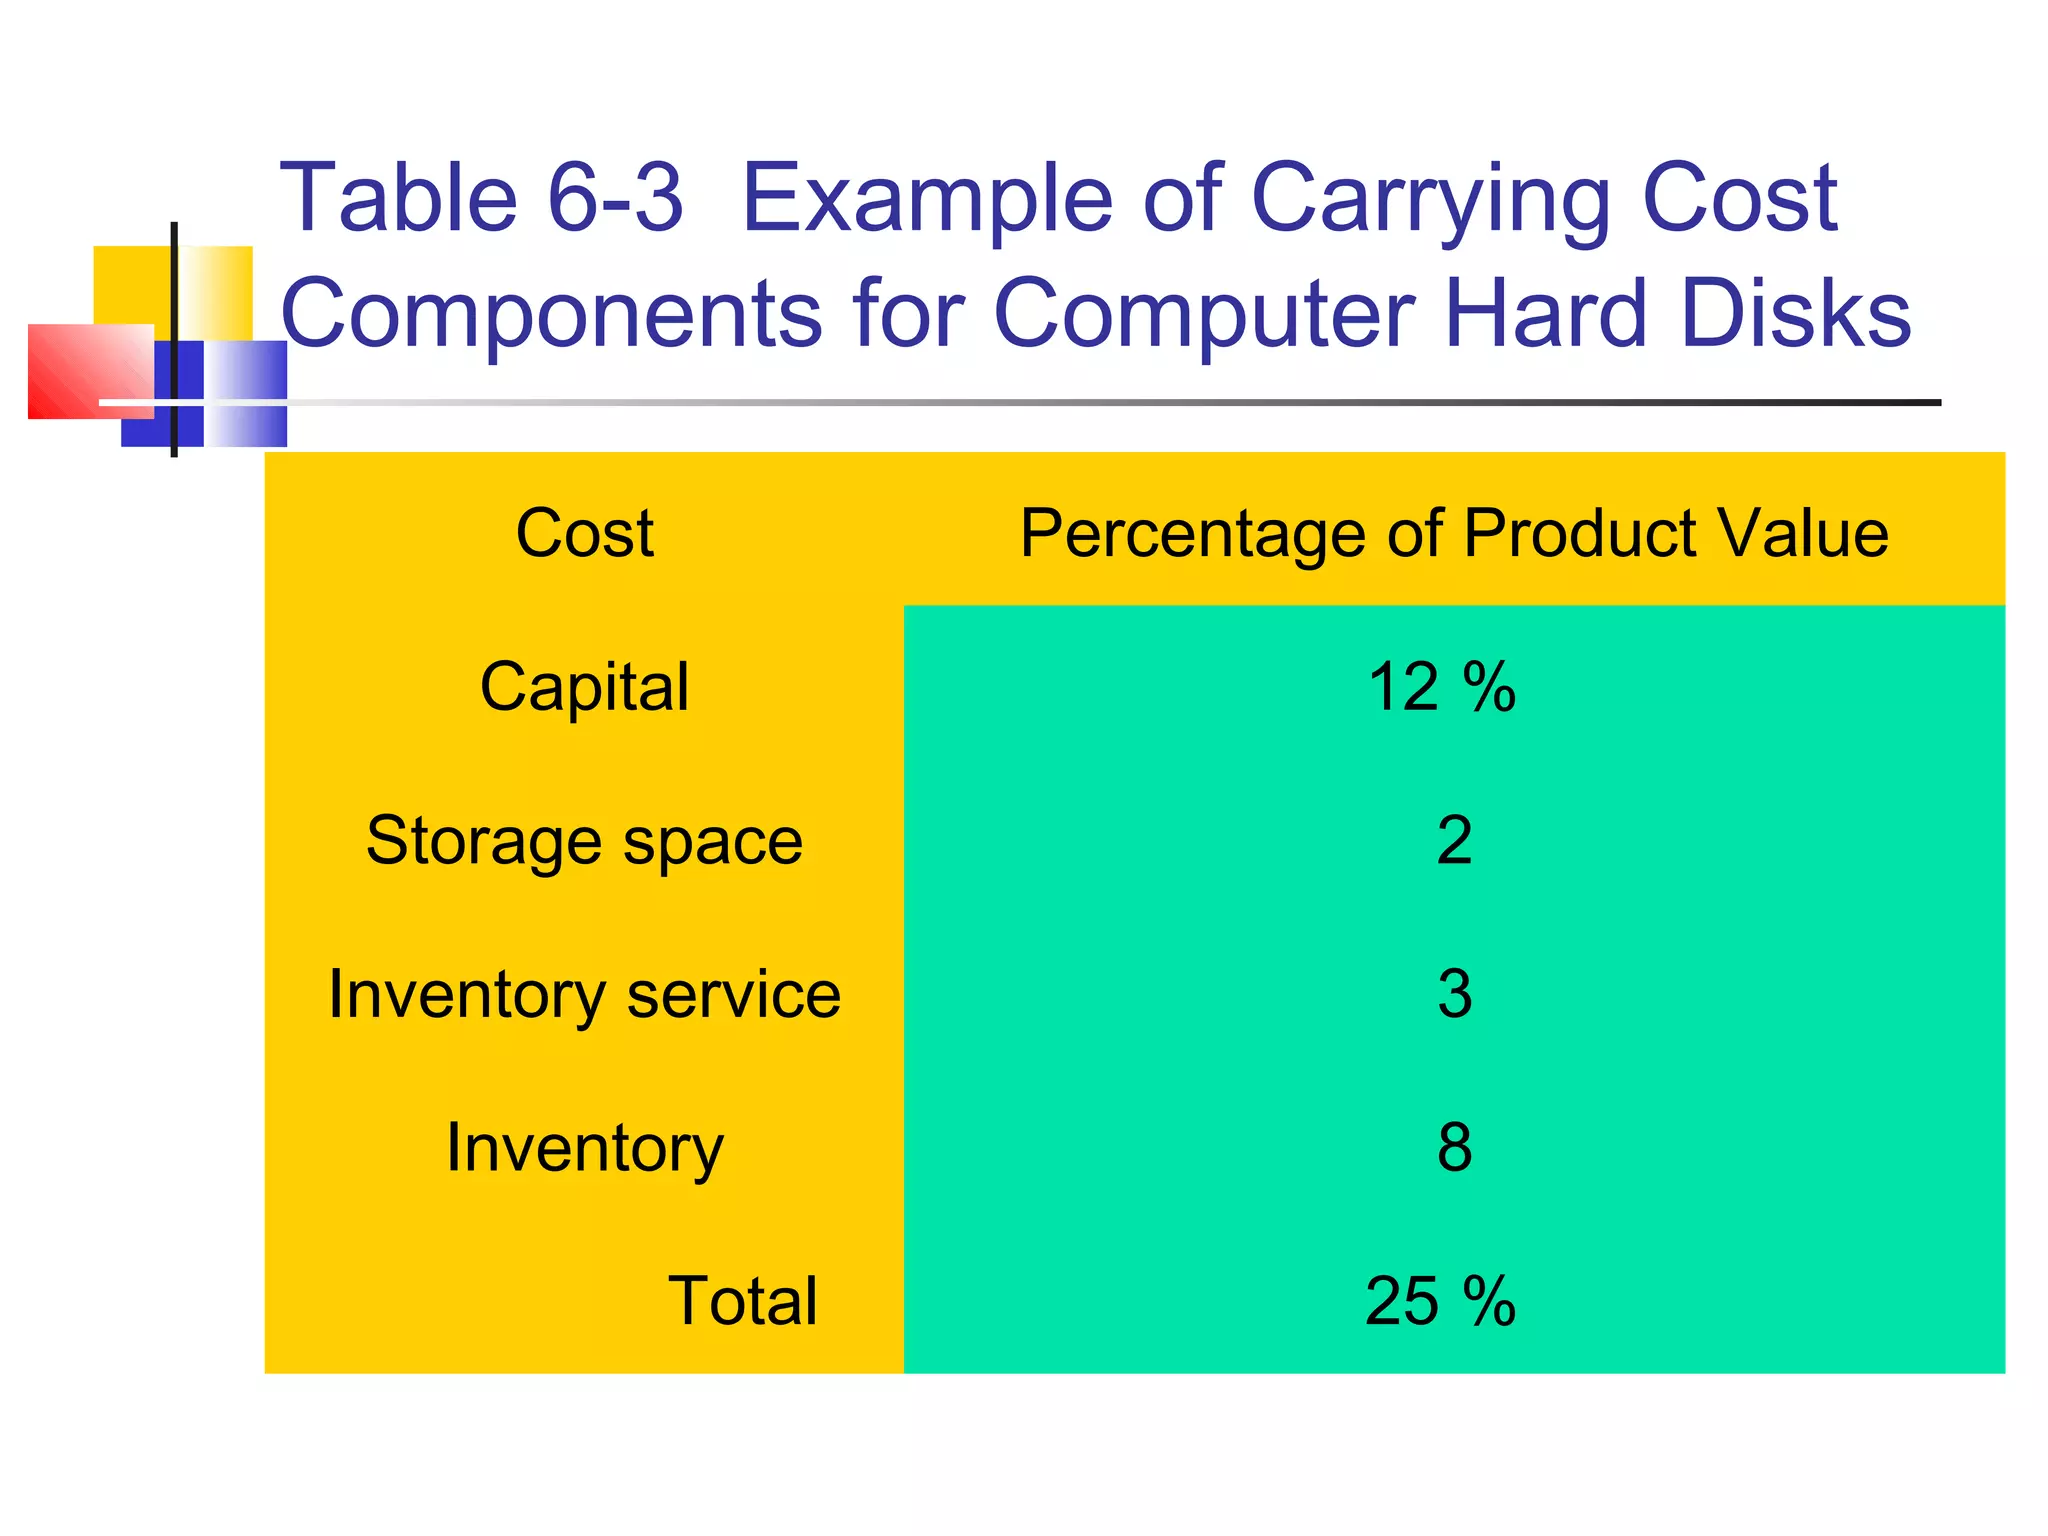
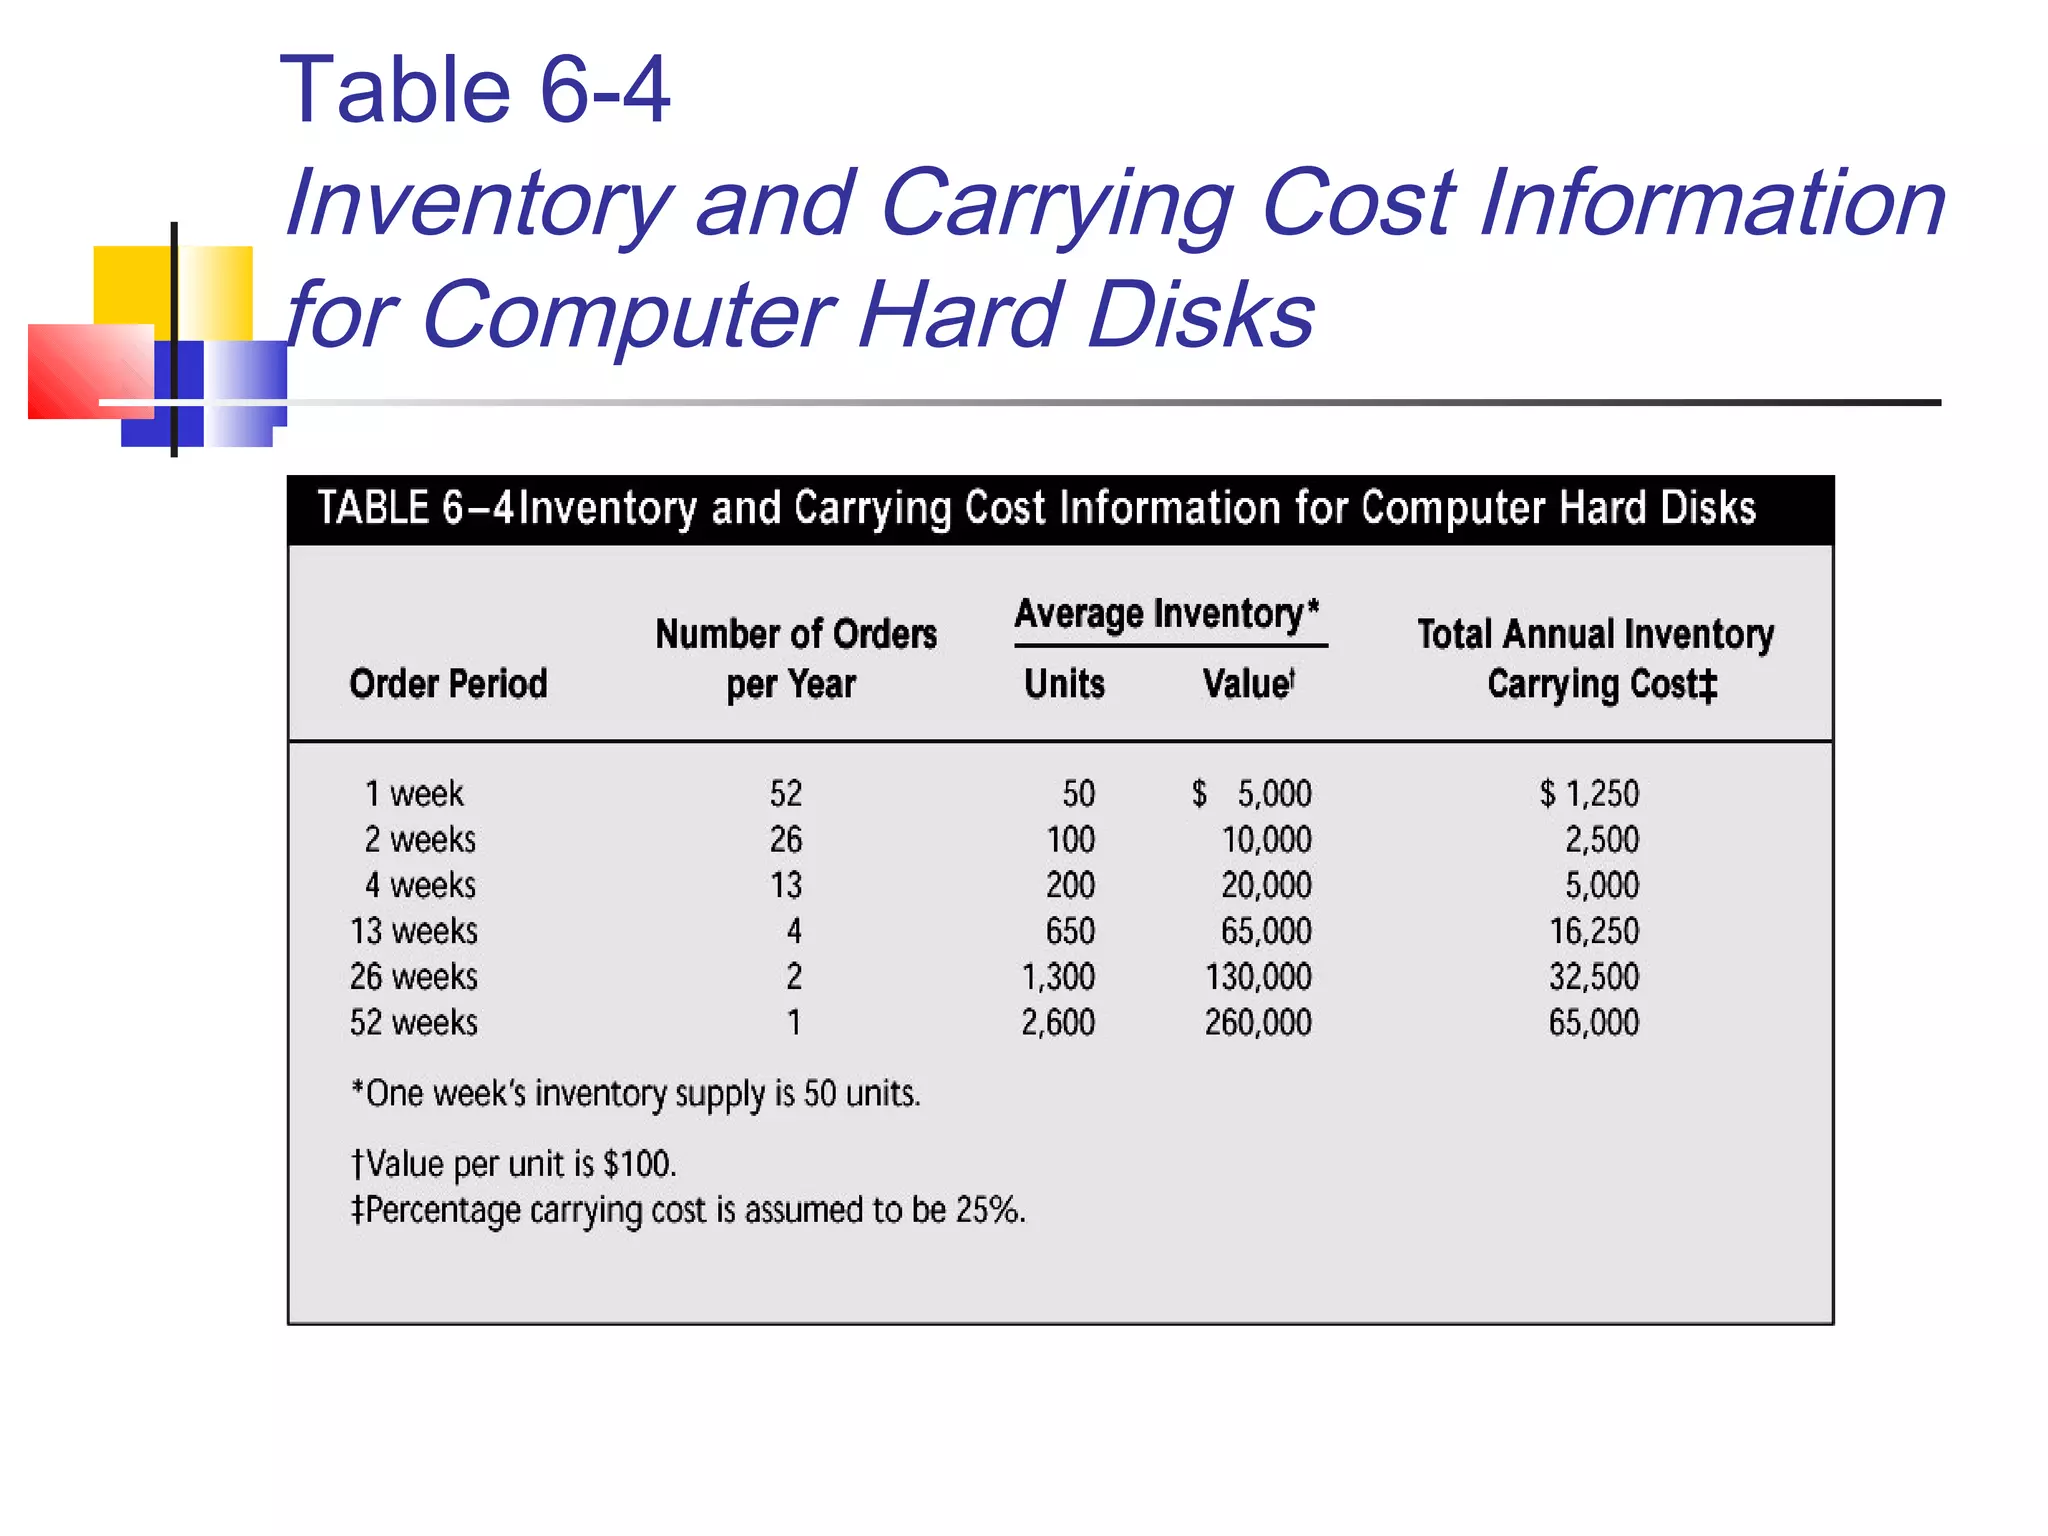
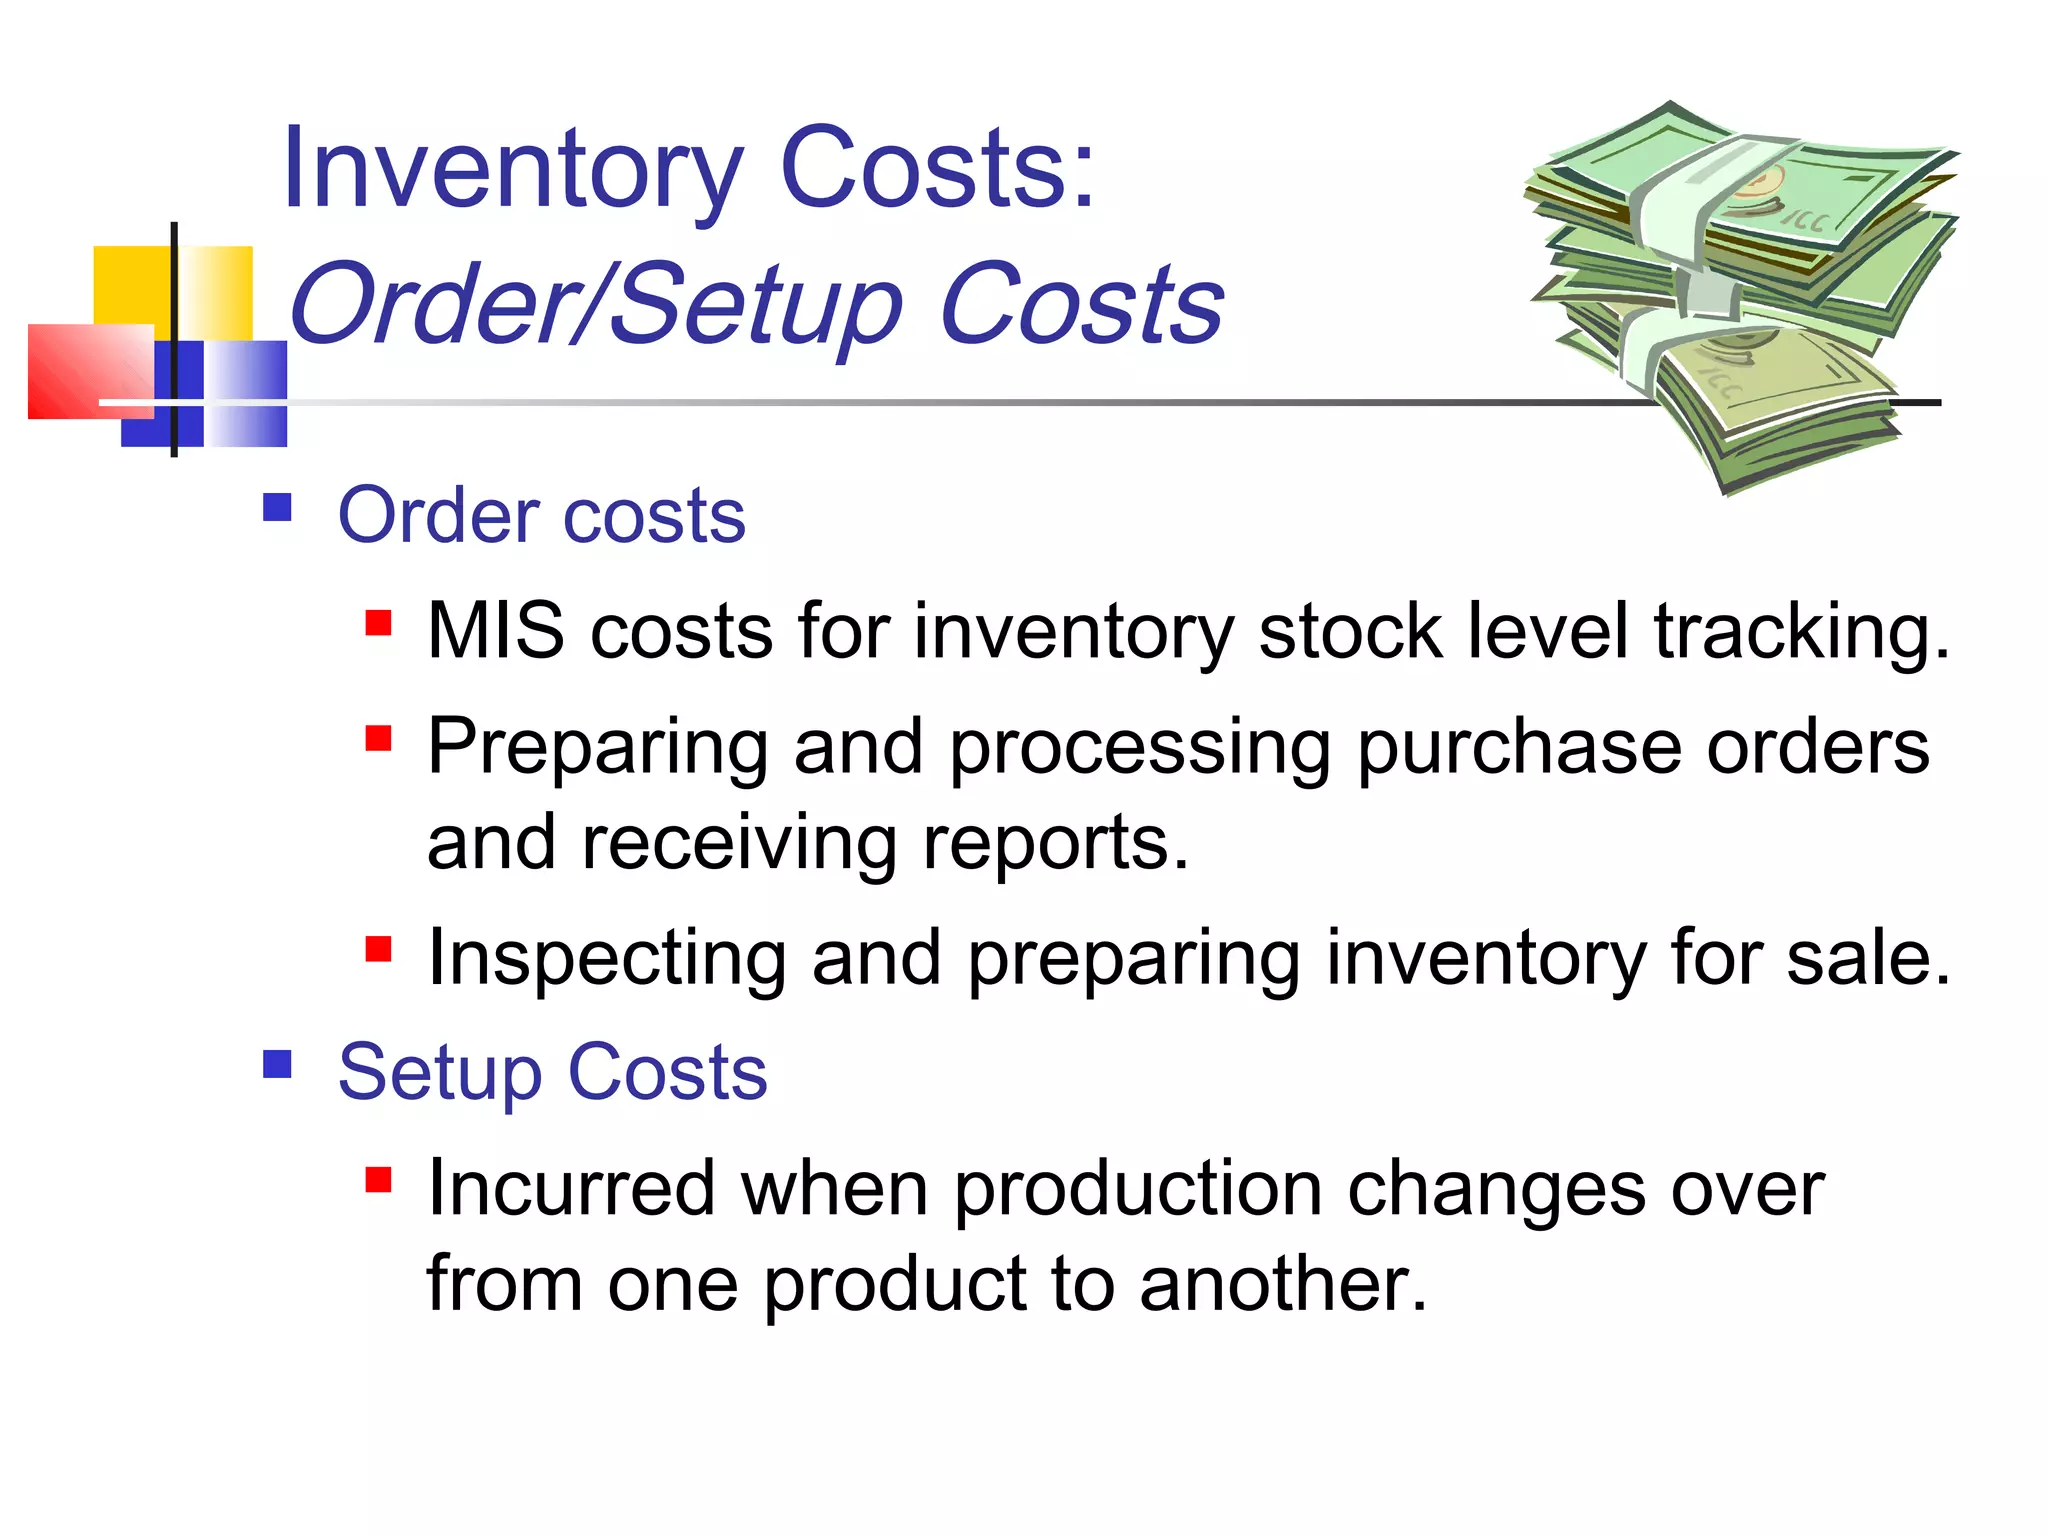
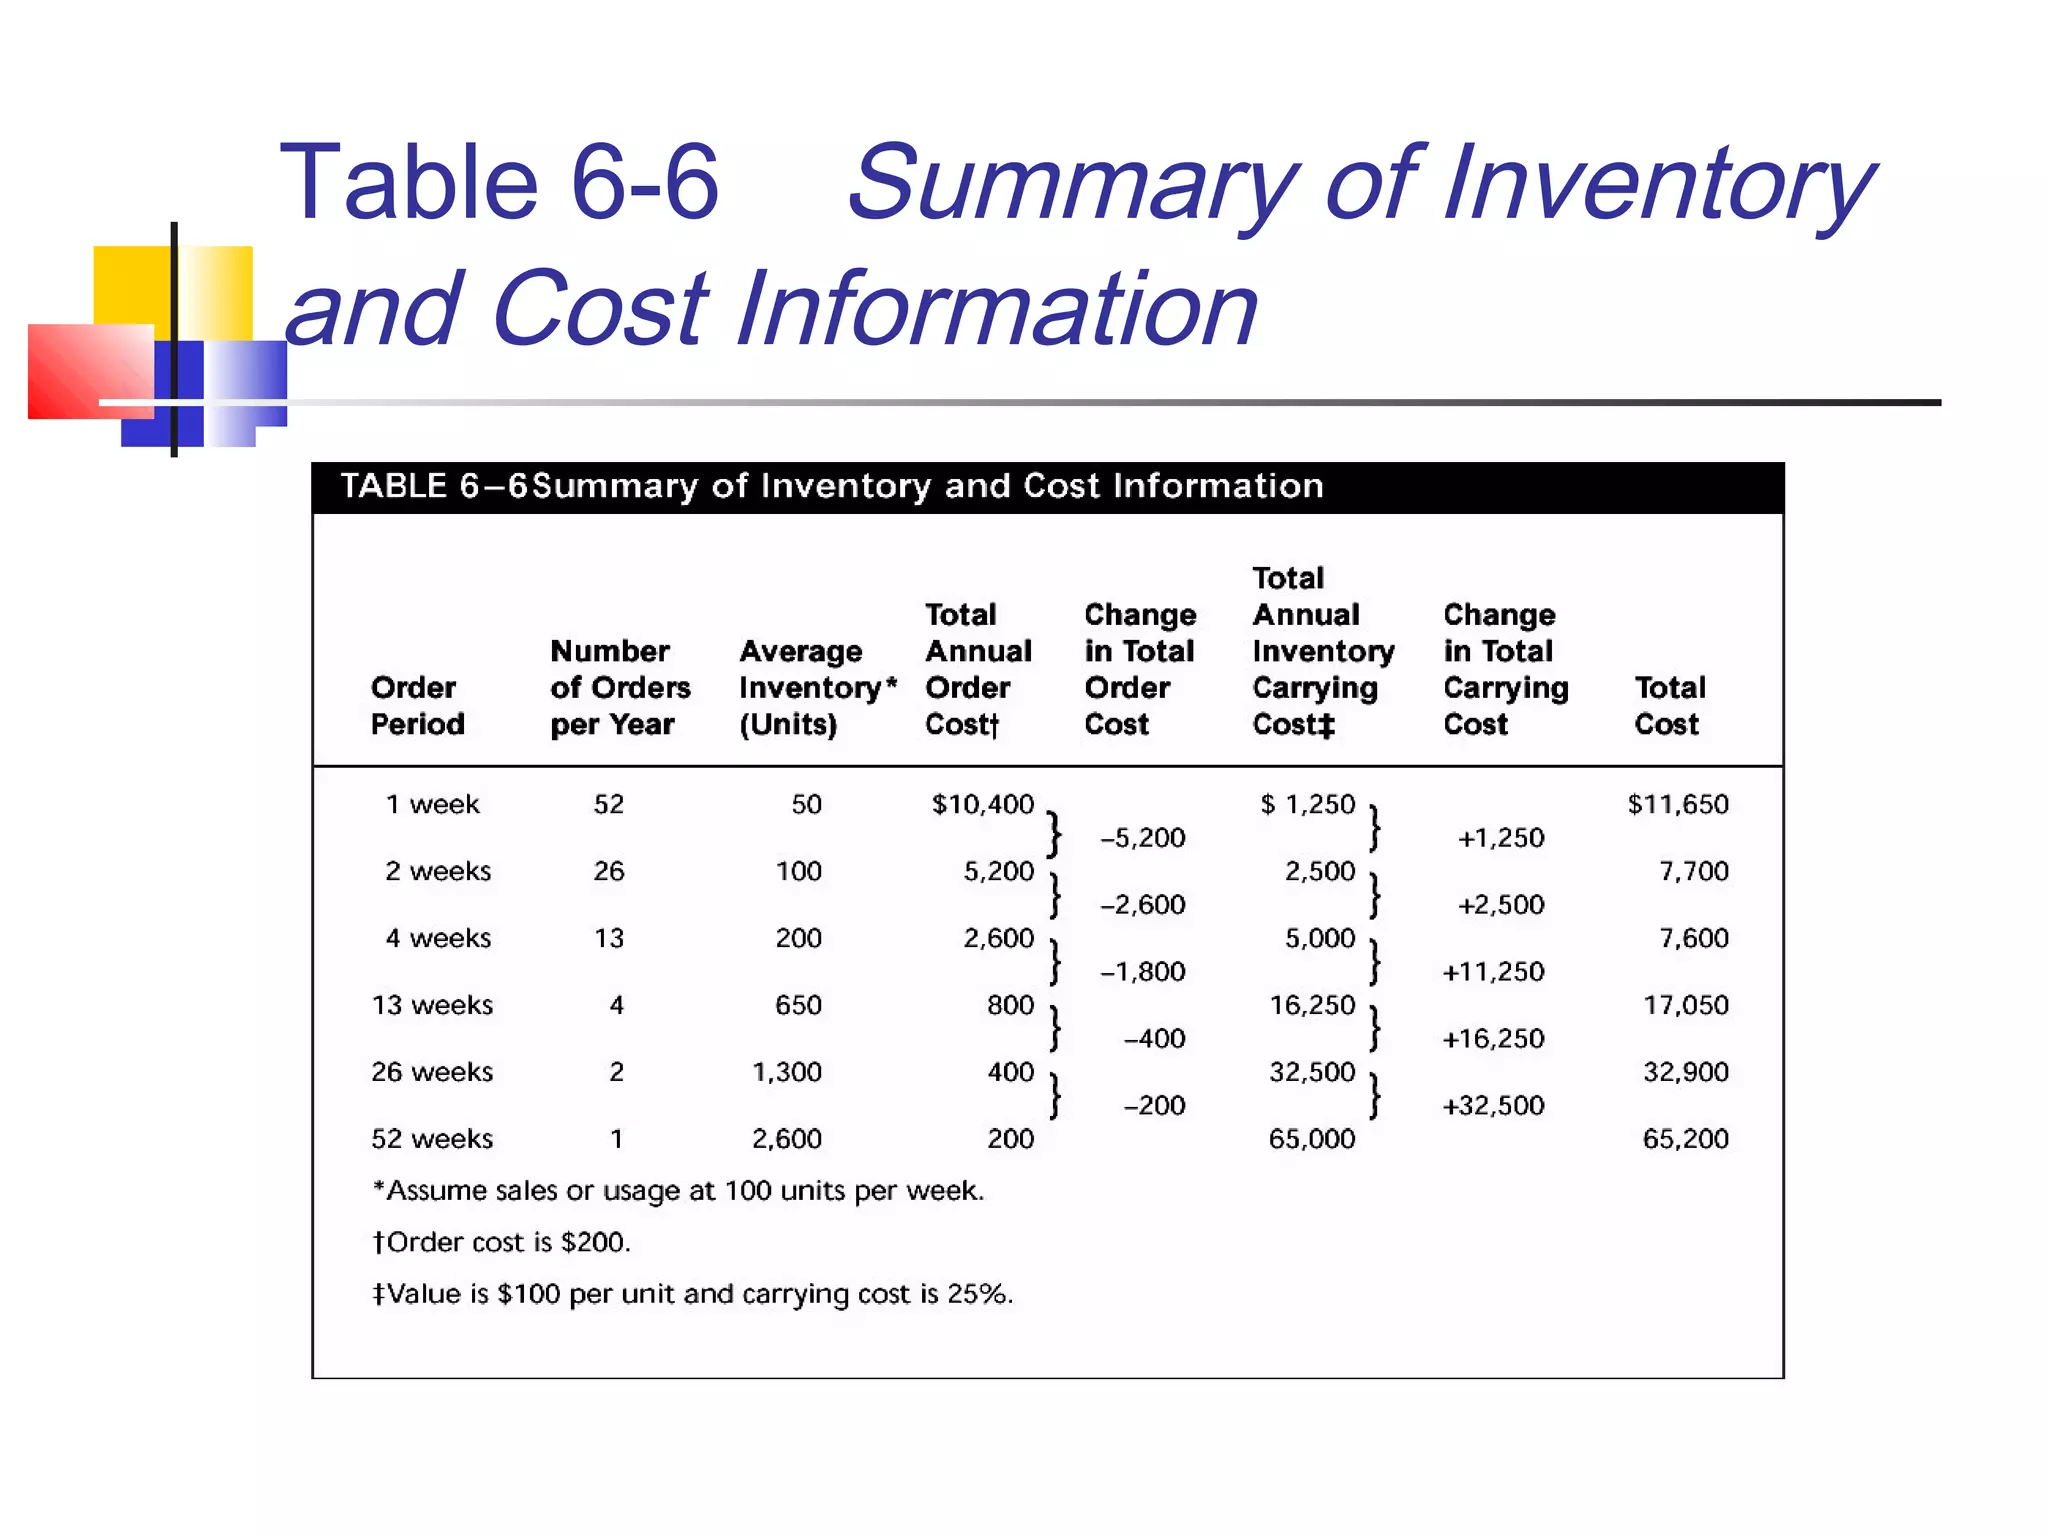
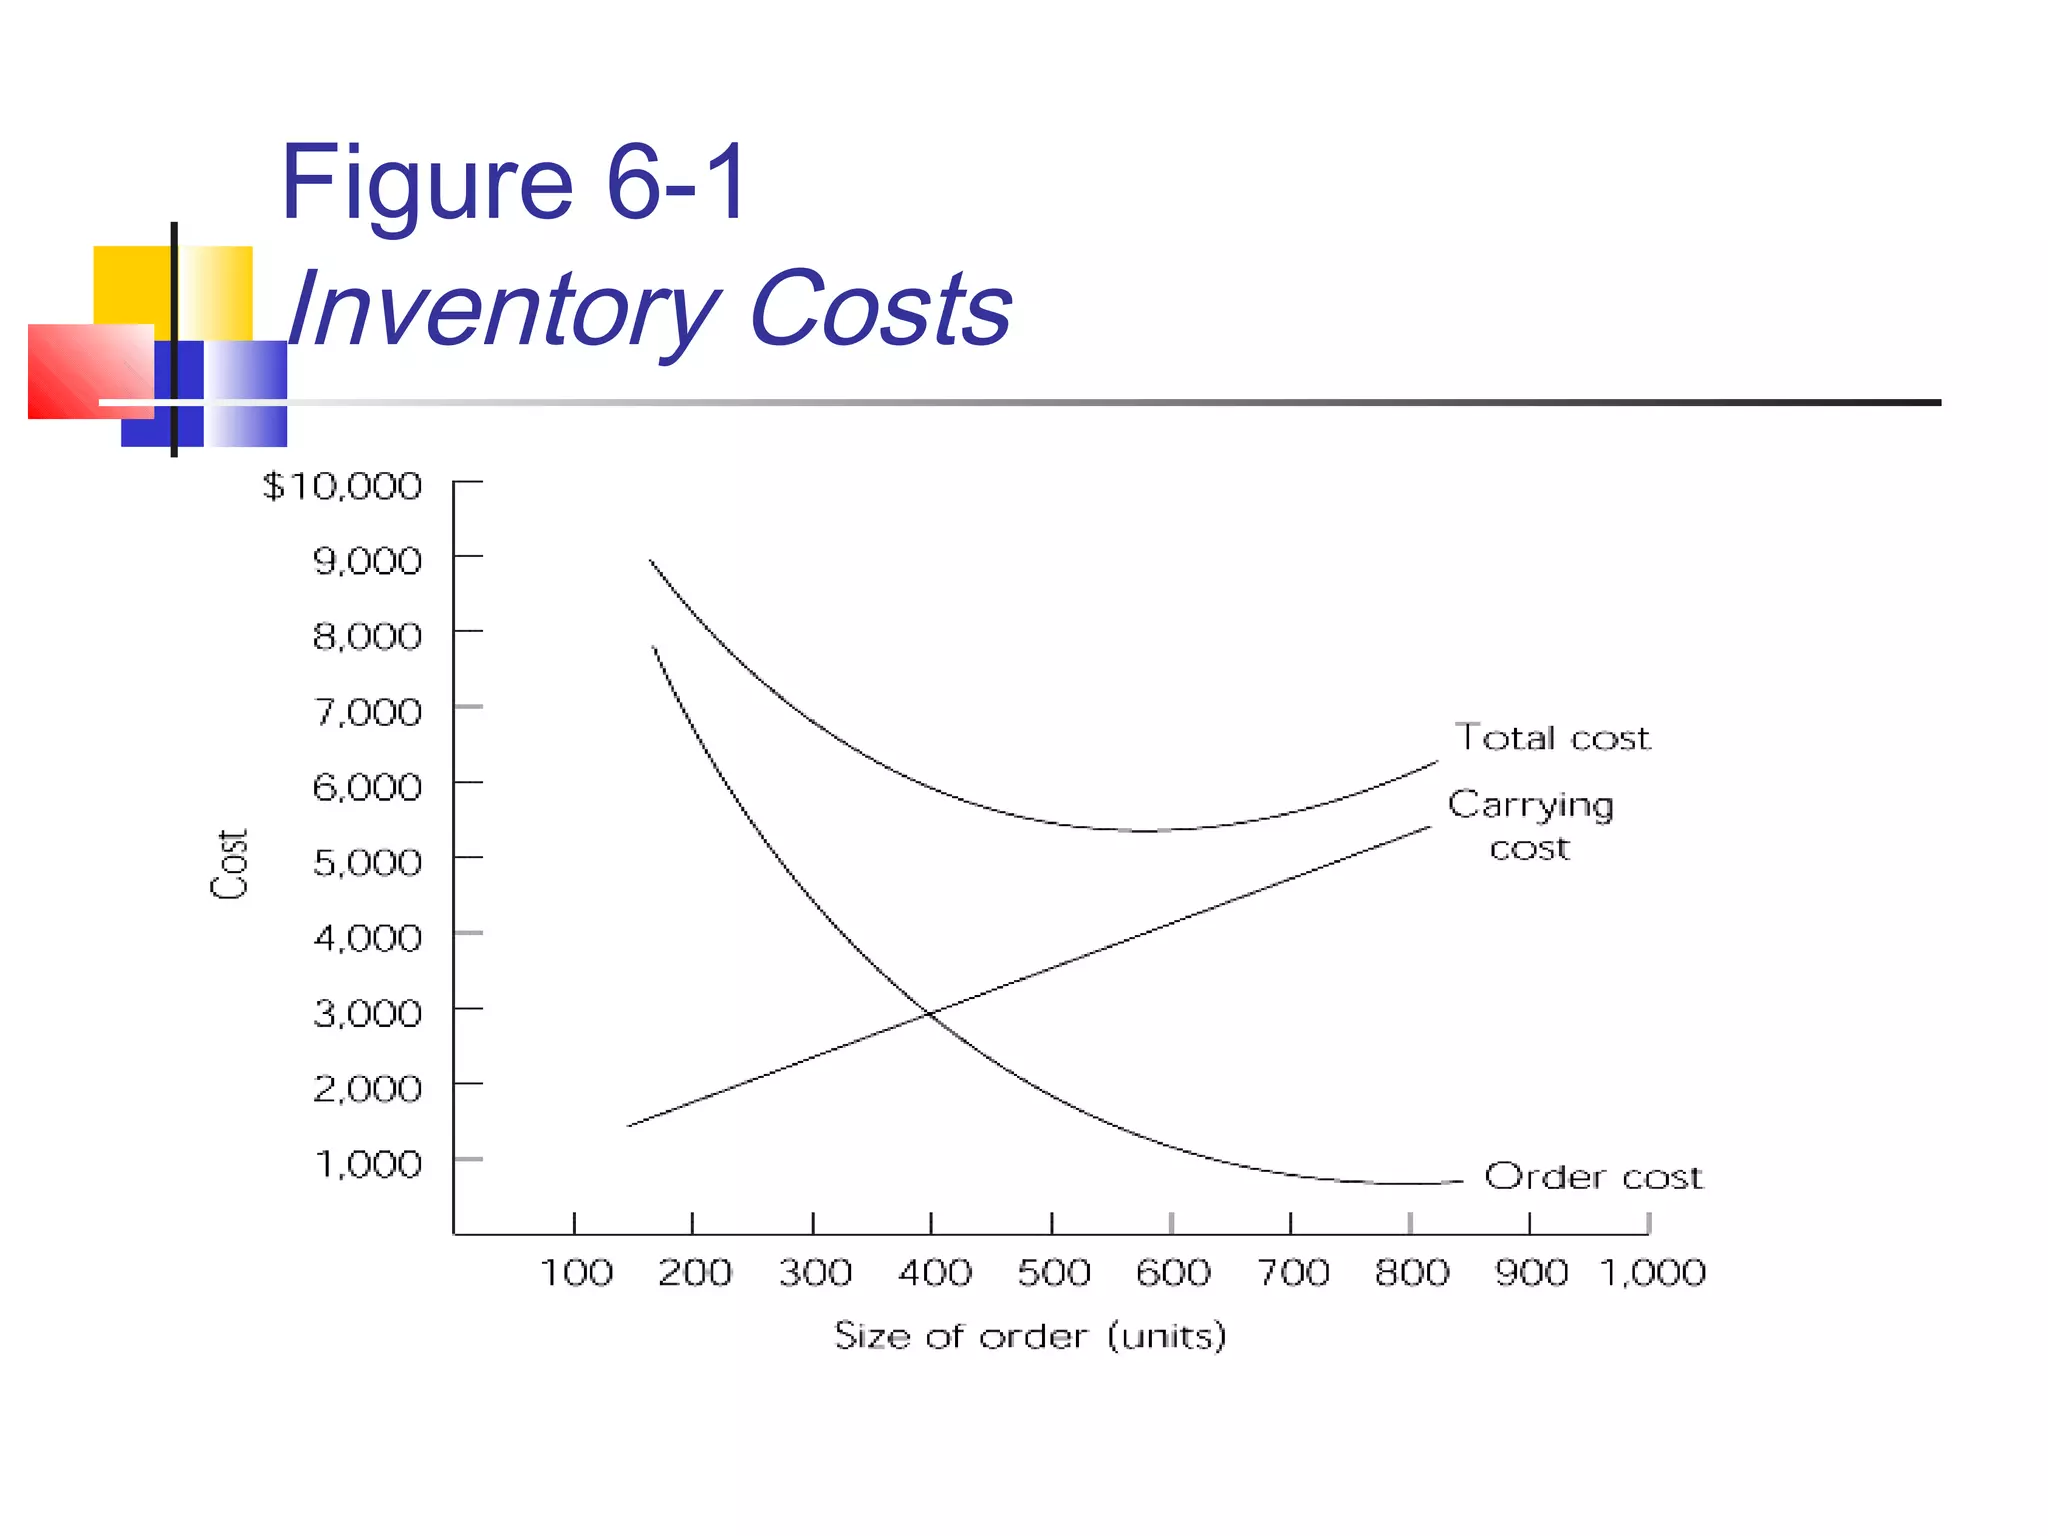
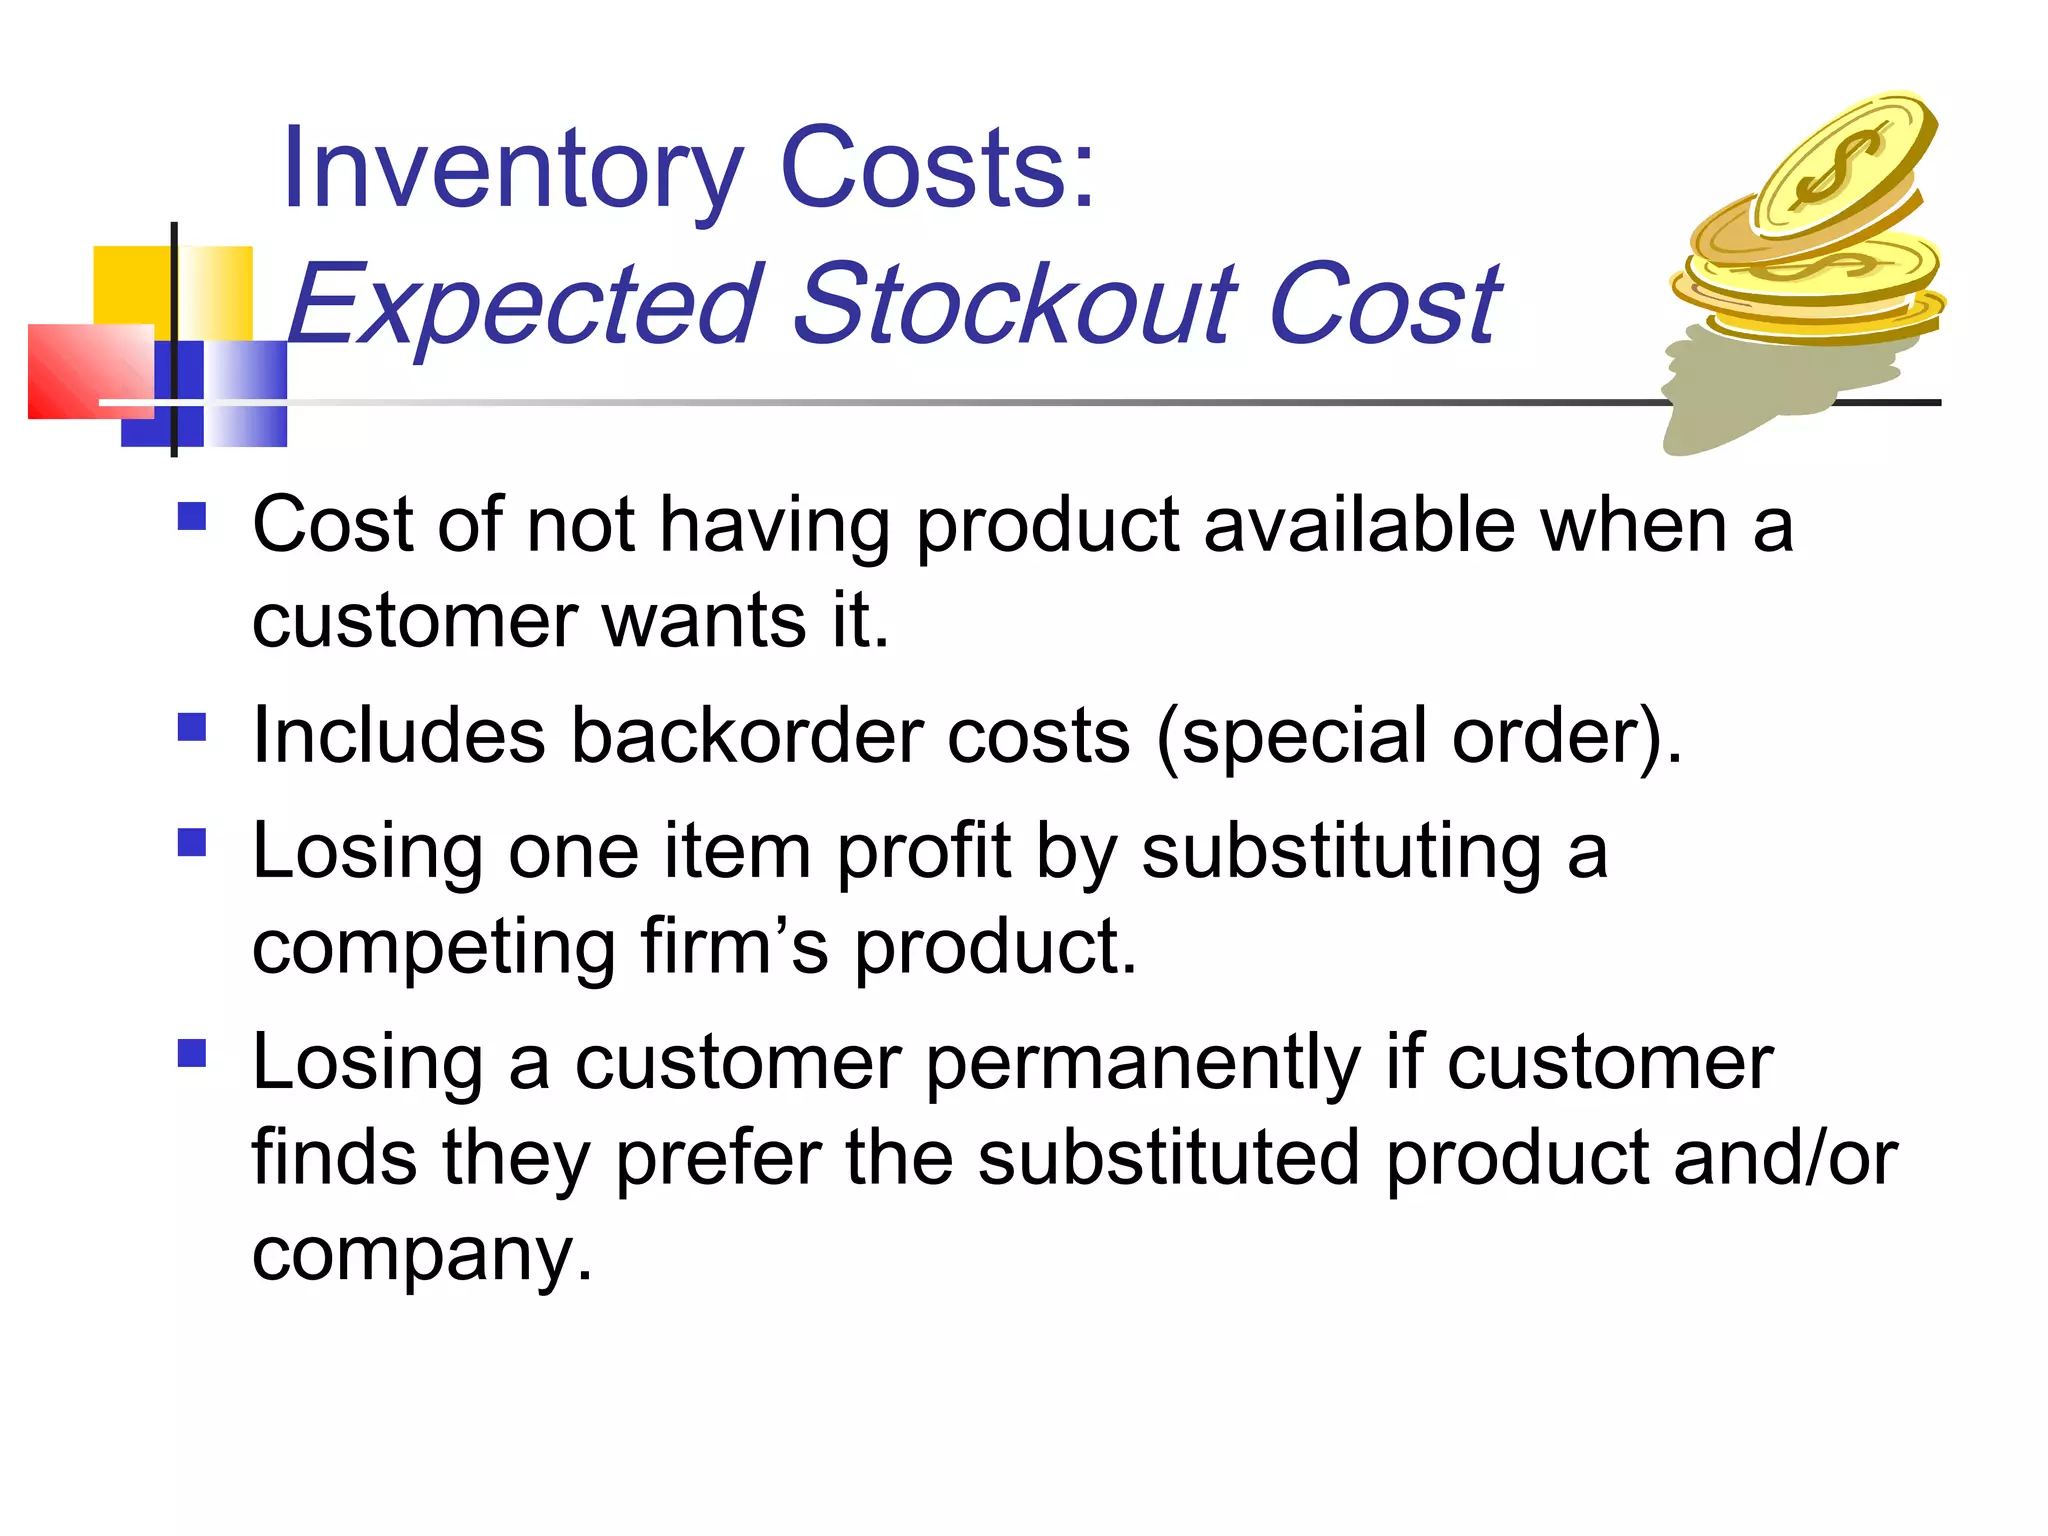
Chapter 6:
Managing Inventory Flows in the
Supply Chain
Learning Objectives - After reading this
chapter, you should be able to do the following:
 Understand the importance of coordinated
flows of inventory through supply chains.
 Understand the impact of effective inventory
management upon the return on assets
(ROA) for a company.
 Appreciate the role and importance of
inventory in the economy and why inventory
levels have declined relative to Gross
Domestic Product (GDP).
Learning Objectives
 Understand the major reasons for carrying
inventory.
 Explain the role of inventory to major
functional areas in the company.
 Discuss the major types of inventory-related
costs and their relationships to inventory
decisions.
Learning Objectives
 Understand how inventory items (stock-
keeping units) can be designed to maximize
the efficiency of managing inventory.
 Appreciate the importance and value of
inventory visibility to increasing supply chain
effectiveness.
 Understand how companies can evaluate the
effectiveness of their inventory management
techniques.
Logistics Profile:
Micros and More
 “Inventory, inventory, inventory….I am sick and
tired of hearing complaints about our inventory
levels and the costs associated with carrying
inventory,” muttered the COO.
 What is the role of inventory?
 What are the important trade-offs in the
management of inventory?
 What are the relevant inventory costs?
 Can the supply chain help control inventory?
Management of Inventory Flows
in the Supply Chain: Introduction
 Inventory as an asset has taken on increased
significance as companies struggle to reduce
investment in fixed assets that accommodate
inventory (plants, warehouses, etc.).
 Changes in inventory affect return on assets
(ROA), an important internal and external
metric.
 Ultimate challenge is to balance supply and
demand for inventory.
Inventory in the Economy
 Inventory in the Economy has decreased.
 As a percentage of the GDP, from 1985 to
2000, inventory levels have decreased
from 5.4% to about 3.8%
 Examine Table 6-1.
Table 6-1: Macro Inventory Cost in
Relation to U.S. Gross Domestic Product
On the Line:
Inventory Turns
 Think of inventory turns as a measure of how well a
company’s products are doing in the market and how
well its inventory is managed.
 There is a continuing move away from traditional build-
to-forecast manufacturing models to more flexible
build-to-demand systems.
 Increasing emphasis on fully integrated supply chain
means inventories barely spend any time sitting idle.
 “Ideally, zero inventory will maximize cash flow.”
 Inventory turnover potential is 30 to 40 times/year.
Inventory in the Firm:
Rationale for Inventory
 Product Line Proliferation
 Depth & breath of product lines trending up.
 Results in larger inventories.
 Examine Table 6-2 Total Logistics Costs-1999.
 Inventory carrying costs of $332 billion
approach 35 percent of total logistics costs for
companies.
Table 6-2
Total Logistics Costs --- 1999
Inventory in the Firm:
Batching Economies/Cycle Stocks
 Price discounts
 Result in trade-offs between large
purchases qualifying for quantity discounts
and costs of storing inventory.
 Because physical supply inventory is often
raw materials, storage costs are often less
than savings from buying in bulk, so
supplies are stockpiled.
Inventory in the Firm:
Batching Economies/Cycle Stocks
 Transportation rate discounts
 Large quantities often result in carload
freight rates.
 Largest shipments may qualify for even
lower multiple truckload, carload or
trainload rates.
 Lower freight rates are often reflected in
lower consumer prices.
Inventory in the Firm:
Batching Economies/Cycle Stocks
 Production economics favor long production
runs.
 Results in cycle stock that must be stored.
 Cycle stocks can be beneficial as long as
the appropriate analysis is done to cost
justify the inventory.
Inventory in the Firm:
Uncertainty/Safety Stocks
 Reasons for uncertainty are commonplace.
 Net results are the same: companies
accumulate safety stock to buffer
themselves against uncertainty.
 Safety stock more challenging and
complex to manage for many firms.
Inventory in the Firm:
Uncertainty/Safety Stocks
 Impact of information on uncertainty
 Trade-off analysis appropriate to assess
risk and measure inventory cost.
 Information technology can be used in the
supply chain to reduce inventory.
 Collaborative planning and forecasting
requirements (CPFR) is an example.
 Bar coding, EDI, the Internet have enabled
companies to reduce uncertainty.
Inventory in the Firm: Time/In-Transit
and Work-In-Process Stocks
 Time-related trade-offs from using slower to
faster transport modes
 Faster modes cost more but may save a
larger amount in inventory carrying costs.
 Work-In-Process inventory should be
examined for possible trade-offs especially in
the production of high value goods.
 Scheduling and actual production times
can be closely examined to reduce
inventory.
Inventory in the Firm:
Seasonal Stocks
 Seasonality can occur on the inbound and/or
outbound side of the firm’s logistics systems.
 Perishable supply in agricultural products or
seasonal-related transportation problems.
 Seasonal demand compressing selling
seasons in some industries results in smaller
plants producing for stock.
Inventory in the Firm:
Anticipatory Stocks
 In some cases, companies anticipate that
some forecasted event will negatively impact
the production cycle.
 For example, labor strikes, shortage of
supplies due to weather or political event, or
significant price increases may prompt the
firm to build inventory levels higher than
normal.
 Risk assessment is important in these cases.
Inventory in the Firm: The Importance
of Inventory in Other Functional Areas
 Marketing uses inventory to provide strong
customer service.
 Manufacturing uses inventory to schedule
longer production runs.
 Finance wants inventory turnover ratios to be
kept high so that risk of inventory loss is
reduced and rate of return on assets kept
competitively high.
Inventory Costs: Why are they
so important?
 First, inventory costs are a significant portion
of total logistics costs for many firms.
 Second, inventory levels affect customer
service levels.
 Third, inventory cost trade-off decisions affect
inventory carrying costs.
Inventory Costs:
Inventory Carrying Cost
 Capital Cost
 Opportunity cost associated with investing
in inventory, or any asset.
 What is the implicit value of having capital
tied up in inventory, instead of some other
worthwhile project?
 Minimum ROR expected from any asset.
 Debate on inventory valuation at fully
allocated or variable costs only.
Inventory Costs:
Inventory Carrying Cost
 Storage Space Cost
 Handling costs, rents, utilities.
 Logistics develops a cost formula for
storage space costs based on cost
behaviors.

Public space mostly variable.

Private space a mix of fixed and
variable.
Inventory Costs:
Inventory Carrying Cost
 Inventory Service Cost
 Insurance and taxes on stored goods.
 Varies according to the value of the goods.
 Inventory Risk Cost
 Largely beyond the control of the firm.
 Due to obsolescence, damage, theft,
employee pilferage.
Table 6-3 Example of Carrying Cost
Components for Computer Hard Disks
Cost Percentage of Product Value
Capital 12 %
Storage space 2
Inventory service 3
Inventory 8
Total 25 %
Inventory Costs: Calculating the
Cost of Carrying Inventory
 Step 1 - Identify the value of the item stored
in inventory (e.g. $100).
 Step 2 - Measure each individual carrying
cost component as a percentage of product
value (e.g. 25%).
 Step 3 - Multiply overall carrying cost (as a
percentage) times the dollar value of the
product (e.g. $100 times 25% = $25 inventory
carrying cost per year.
Inventory Costs:
Nature of Carrying Cost
 Items with basically similar carrying costs
should use the same estimate of carrying
cost per dollar.
 There are exceptions for items that are
subject to special consideration for purposes
of quick obsolescence or high degree of theft,
etc.
Table 6-4
Inventory and Carrying Cost Information
for Computer Hard Disks
Inventory Costs:
Order/Setup Costs
 Order costs
 MIS costs for inventory stock level tracking.
 Preparing and processing purchase orders
and receiving reports.
 Inspecting and preparing inventory for sale.
 Setup Costs
 Incurred when production changes over
from one product to another.
Table 6-5 Order Frequency and
Order Cost for Computer Hard Disks
Inventory Costs:
Carrying Cost versus Order Cost
 Examine Table 6-6.
 Order costs and carrying costs respond in
opposite ways to increases in volume.
 This reinforces the logisticians need to be
able to separate costs by how they behave in
relation to changes in volume.
 Assistance from managerial accountants is
available for cost-volume-profit analysis.
Table 6-6 Summary of Inventory
and Cost Information
Figure 6-1
Inventory Costs
Inventory Costs:
Expected Stockout Cost
 Cost of not having product available when a
customer wants it.
 Includes backorder costs (special order).
 Losing one item profit by substituting a
competing firm’s product.
 Losing a customer permanently if customer
finds they prefer the substituted product and/or
company.
Inventory Costs:
Expected Stockout Cost
 Possible to handle this by adding safety stock.
 In a manufacturing firm, a stockout may result
in lost hours of production until the item is
restocked.
Inventory Costs:
Inventory in Transit Carrying Cost
 Any product inbound to the firm using F.O.B.
origin should be counted.
 Any product outbound from the firm using
F.O.B. destination should be counted.
 In transit carrying cost is generally less than
for regular inventory because some cost
components are not present.
 No storage costs, no taxes, and reduced
risk of obsolescence.
Classifying Inventory:
ABC Analysis
 Ranking system
 Developed in 1951 by H. Ford Dicky of
General Electric3
.
 Suggested that GE classify items
according to relative sales volume, cash
flows, lead time, or stockout cost.
 Most important inventory put in Group A.
 Lesser impact goods put in Groups B and
C respectively.
Classifying Inventory:
ABC Analysis
 Pareto’s Rule (80-20 Rule)
 Based on a nineteenth century
mathematician’s observation that many
situations were dominated by a very few
elements.
 Conversely, most elements had very little
influence in most situations.
 Separates the “trivial many” from the “vital
few”.
Classifying Inventory:
ABC Analysis
 80-20 Rule
 80% of sales will come from 20% of the
inventory SKUs.
 20% of sales will come from 80% of the
inventory SKUs.
 The 80-20 Rule has been found to explain
many phenomena that interest managers.
 For example, 80% of sales come from 20%
of customers; and vice versa.
Figure 6-2
ABC Inventory Analysis
Table 6-7 ABC Analysis for Big
Orange Products, Inc.
Inventory Visibility
 The ability of the firm to “see” inventory on a
real-time basis throughout the supply chain
system requires:
 Tracking and tracing inventory SKUs for all
inbound and outbound orders.
 Providing summary and detailed reports of
shipments, orders, products, transportation
equipment, location, and trade lane activity.
 Notification of failures in inventory flow.
Inventory Visibility:
General Benefits
 Improved customer service
 Decreased cost-of-sales
 Improved vendor relations and cost
 Increased Return on Assets
 Improved cash flow
 Improved response time and service
recovery
 Improved performance metrics
Evaluating the Effectiveness of a
Company’s Approach to Inventory
Management
 Are customers satisfied with the current
level of customer service?
 If standards have been set in consultation
with the customer, this question can be
answered objectively.
Evaluating the Effectiveness of a
Company’s Approach to Inventory
Management
 How frequently does backordering and/or
expediting occur?
 If records of these events are kept, the
answer to this question can point out the
need for a modification or adoption of new
inventory strategies.
Evaluating the Effectiveness of a
Company’s Approach to Inventory
Management
 Is the company calculating an Inventory
Turnover ratio for each product SKU?
 This ratio can provide good information on
whether the inventory is being effectively
and efficiently managed.
 Examine Table 6-8, Figure 6-3 and
Figure 6-4.
Evaluating the Effectiveness of a
Company’s Approach to Inventory
Management
 How does inventory level behave as sales rise
or fall?
 From sales records, the firm can determine
if inventory levels rise as much as sales,
less than sales, or stay about the same
regardless of sales levels.
Table 6-8 The Relationship among
Inventory Turnover, Average Inventory,
and Inventory Carrying Costs
Figure 6-3 Saving Inventory
Dollars by Inventory Turns
Figure 6-4 Past and Projected
Inventory Turnover of Finished Goods
Chapter 6:
Summary and Review Questions
Students should review their knowledge of the chapter
by checking out the Summary and Study Questions
for Chapter 6.
This is the last slide for Chapter 6
End of Chapter 6 Slides
Managing Inventory Flows in
the Supply Chain

MANAGEMENT INVENTORY FLOWS IN THE SUPPLY CHAIN

  • 1.
    Chapter 6: Managing InventoryFlows in the Supply Chain
  • 2.
    Learning Objectives -After reading this chapter, you should be able to do the following:  Understand the importance of coordinated flows of inventory through supply chains.  Understand the impact of effective inventory management upon the return on assets (ROA) for a company.  Appreciate the role and importance of inventory in the economy and why inventory levels have declined relative to Gross Domestic Product (GDP).
  • 3.
    Learning Objectives  Understandthe major reasons for carrying inventory.  Explain the role of inventory to major functional areas in the company.  Discuss the major types of inventory-related costs and their relationships to inventory decisions.
  • 4.
    Learning Objectives  Understandhow inventory items (stock- keeping units) can be designed to maximize the efficiency of managing inventory.  Appreciate the importance and value of inventory visibility to increasing supply chain effectiveness.  Understand how companies can evaluate the effectiveness of their inventory management techniques.
  • 5.
    Logistics Profile: Micros andMore  “Inventory, inventory, inventory….I am sick and tired of hearing complaints about our inventory levels and the costs associated with carrying inventory,” muttered the COO.  What is the role of inventory?  What are the important trade-offs in the management of inventory?  What are the relevant inventory costs?  Can the supply chain help control inventory?
  • 6.
    Management of InventoryFlows in the Supply Chain: Introduction  Inventory as an asset has taken on increased significance as companies struggle to reduce investment in fixed assets that accommodate inventory (plants, warehouses, etc.).  Changes in inventory affect return on assets (ROA), an important internal and external metric.  Ultimate challenge is to balance supply and demand for inventory.
  • 7.
    Inventory in theEconomy  Inventory in the Economy has decreased.  As a percentage of the GDP, from 1985 to 2000, inventory levels have decreased from 5.4% to about 3.8%  Examine Table 6-1.
  • 8.
    Table 6-1: MacroInventory Cost in Relation to U.S. Gross Domestic Product
  • 9.
    On the Line: InventoryTurns  Think of inventory turns as a measure of how well a company’s products are doing in the market and how well its inventory is managed.  There is a continuing move away from traditional build- to-forecast manufacturing models to more flexible build-to-demand systems.  Increasing emphasis on fully integrated supply chain means inventories barely spend any time sitting idle.  “Ideally, zero inventory will maximize cash flow.”  Inventory turnover potential is 30 to 40 times/year.
  • 10.
    Inventory in theFirm: Rationale for Inventory  Product Line Proliferation  Depth & breath of product lines trending up.  Results in larger inventories.  Examine Table 6-2 Total Logistics Costs-1999.  Inventory carrying costs of $332 billion approach 35 percent of total logistics costs for companies.
  • 11.
  • 12.
    Inventory in theFirm: Batching Economies/Cycle Stocks  Price discounts  Result in trade-offs between large purchases qualifying for quantity discounts and costs of storing inventory.  Because physical supply inventory is often raw materials, storage costs are often less than savings from buying in bulk, so supplies are stockpiled.
  • 13.
    Inventory in theFirm: Batching Economies/Cycle Stocks  Transportation rate discounts  Large quantities often result in carload freight rates.  Largest shipments may qualify for even lower multiple truckload, carload or trainload rates.  Lower freight rates are often reflected in lower consumer prices.
  • 14.
    Inventory in theFirm: Batching Economies/Cycle Stocks  Production economics favor long production runs.  Results in cycle stock that must be stored.  Cycle stocks can be beneficial as long as the appropriate analysis is done to cost justify the inventory.
  • 15.
    Inventory in theFirm: Uncertainty/Safety Stocks  Reasons for uncertainty are commonplace.  Net results are the same: companies accumulate safety stock to buffer themselves against uncertainty.  Safety stock more challenging and complex to manage for many firms.
  • 16.
    Inventory in theFirm: Uncertainty/Safety Stocks  Impact of information on uncertainty  Trade-off analysis appropriate to assess risk and measure inventory cost.  Information technology can be used in the supply chain to reduce inventory.  Collaborative planning and forecasting requirements (CPFR) is an example.  Bar coding, EDI, the Internet have enabled companies to reduce uncertainty.
  • 17.
    Inventory in theFirm: Time/In-Transit and Work-In-Process Stocks  Time-related trade-offs from using slower to faster transport modes  Faster modes cost more but may save a larger amount in inventory carrying costs.  Work-In-Process inventory should be examined for possible trade-offs especially in the production of high value goods.  Scheduling and actual production times can be closely examined to reduce inventory.
  • 18.
    Inventory in theFirm: Seasonal Stocks  Seasonality can occur on the inbound and/or outbound side of the firm’s logistics systems.  Perishable supply in agricultural products or seasonal-related transportation problems.  Seasonal demand compressing selling seasons in some industries results in smaller plants producing for stock.
  • 19.
    Inventory in theFirm: Anticipatory Stocks  In some cases, companies anticipate that some forecasted event will negatively impact the production cycle.  For example, labor strikes, shortage of supplies due to weather or political event, or significant price increases may prompt the firm to build inventory levels higher than normal.  Risk assessment is important in these cases.
  • 20.
    Inventory in theFirm: The Importance of Inventory in Other Functional Areas  Marketing uses inventory to provide strong customer service.  Manufacturing uses inventory to schedule longer production runs.  Finance wants inventory turnover ratios to be kept high so that risk of inventory loss is reduced and rate of return on assets kept competitively high.
  • 21.
    Inventory Costs: Whyare they so important?  First, inventory costs are a significant portion of total logistics costs for many firms.  Second, inventory levels affect customer service levels.  Third, inventory cost trade-off decisions affect inventory carrying costs.
  • 22.
    Inventory Costs: Inventory CarryingCost  Capital Cost  Opportunity cost associated with investing in inventory, or any asset.  What is the implicit value of having capital tied up in inventory, instead of some other worthwhile project?  Minimum ROR expected from any asset.  Debate on inventory valuation at fully allocated or variable costs only.
  • 23.
    Inventory Costs: Inventory CarryingCost  Storage Space Cost  Handling costs, rents, utilities.  Logistics develops a cost formula for storage space costs based on cost behaviors.  Public space mostly variable.  Private space a mix of fixed and variable.
  • 24.
    Inventory Costs: Inventory CarryingCost  Inventory Service Cost  Insurance and taxes on stored goods.  Varies according to the value of the goods.  Inventory Risk Cost  Largely beyond the control of the firm.  Due to obsolescence, damage, theft, employee pilferage.
  • 25.
    Table 6-3 Exampleof Carrying Cost Components for Computer Hard Disks Cost Percentage of Product Value Capital 12 % Storage space 2 Inventory service 3 Inventory 8 Total 25 %
  • 26.
    Inventory Costs: Calculatingthe Cost of Carrying Inventory  Step 1 - Identify the value of the item stored in inventory (e.g. $100).  Step 2 - Measure each individual carrying cost component as a percentage of product value (e.g. 25%).  Step 3 - Multiply overall carrying cost (as a percentage) times the dollar value of the product (e.g. $100 times 25% = $25 inventory carrying cost per year.
  • 27.
    Inventory Costs: Nature ofCarrying Cost  Items with basically similar carrying costs should use the same estimate of carrying cost per dollar.  There are exceptions for items that are subject to special consideration for purposes of quick obsolescence or high degree of theft, etc.
  • 28.
    Table 6-4 Inventory andCarrying Cost Information for Computer Hard Disks
  • 29.
    Inventory Costs: Order/Setup Costs Order costs  MIS costs for inventory stock level tracking.  Preparing and processing purchase orders and receiving reports.  Inspecting and preparing inventory for sale.  Setup Costs  Incurred when production changes over from one product to another.
  • 30.
    Table 6-5 OrderFrequency and Order Cost for Computer Hard Disks
  • 31.
    Inventory Costs: Carrying Costversus Order Cost  Examine Table 6-6.  Order costs and carrying costs respond in opposite ways to increases in volume.  This reinforces the logisticians need to be able to separate costs by how they behave in relation to changes in volume.  Assistance from managerial accountants is available for cost-volume-profit analysis.
  • 32.
    Table 6-6 Summaryof Inventory and Cost Information
  • 33.
  • 34.
    Inventory Costs: Expected StockoutCost  Cost of not having product available when a customer wants it.  Includes backorder costs (special order).  Losing one item profit by substituting a competing firm’s product.  Losing a customer permanently if customer finds they prefer the substituted product and/or company.
  • 35.
    Inventory Costs: Expected StockoutCost  Possible to handle this by adding safety stock.  In a manufacturing firm, a stockout may result in lost hours of production until the item is restocked.
  • 36.
    Inventory Costs: Inventory inTransit Carrying Cost  Any product inbound to the firm using F.O.B. origin should be counted.  Any product outbound from the firm using F.O.B. destination should be counted.  In transit carrying cost is generally less than for regular inventory because some cost components are not present.  No storage costs, no taxes, and reduced risk of obsolescence.
  • 37.
    Classifying Inventory: ABC Analysis Ranking system  Developed in 1951 by H. Ford Dicky of General Electric3 .  Suggested that GE classify items according to relative sales volume, cash flows, lead time, or stockout cost.  Most important inventory put in Group A.  Lesser impact goods put in Groups B and C respectively.
  • 38.
    Classifying Inventory: ABC Analysis Pareto’s Rule (80-20 Rule)  Based on a nineteenth century mathematician’s observation that many situations were dominated by a very few elements.  Conversely, most elements had very little influence in most situations.  Separates the “trivial many” from the “vital few”.
  • 39.
    Classifying Inventory: ABC Analysis 80-20 Rule  80% of sales will come from 20% of the inventory SKUs.  20% of sales will come from 80% of the inventory SKUs.  The 80-20 Rule has been found to explain many phenomena that interest managers.  For example, 80% of sales come from 20% of customers; and vice versa.
  • 40.
  • 41.
    Table 6-7 ABCAnalysis for Big Orange Products, Inc.
  • 42.
    Inventory Visibility  Theability of the firm to “see” inventory on a real-time basis throughout the supply chain system requires:  Tracking and tracing inventory SKUs for all inbound and outbound orders.  Providing summary and detailed reports of shipments, orders, products, transportation equipment, location, and trade lane activity.  Notification of failures in inventory flow.
  • 43.
    Inventory Visibility: General Benefits Improved customer service  Decreased cost-of-sales  Improved vendor relations and cost  Increased Return on Assets  Improved cash flow  Improved response time and service recovery  Improved performance metrics
  • 44.
    Evaluating the Effectivenessof a Company’s Approach to Inventory Management  Are customers satisfied with the current level of customer service?  If standards have been set in consultation with the customer, this question can be answered objectively.
  • 45.
    Evaluating the Effectivenessof a Company’s Approach to Inventory Management  How frequently does backordering and/or expediting occur?  If records of these events are kept, the answer to this question can point out the need for a modification or adoption of new inventory strategies.
  • 46.
    Evaluating the Effectivenessof a Company’s Approach to Inventory Management  Is the company calculating an Inventory Turnover ratio for each product SKU?  This ratio can provide good information on whether the inventory is being effectively and efficiently managed.  Examine Table 6-8, Figure 6-3 and Figure 6-4.
  • 47.
    Evaluating the Effectivenessof a Company’s Approach to Inventory Management  How does inventory level behave as sales rise or fall?  From sales records, the firm can determine if inventory levels rise as much as sales, less than sales, or stay about the same regardless of sales levels.
  • 48.
    Table 6-8 TheRelationship among Inventory Turnover, Average Inventory, and Inventory Carrying Costs
  • 49.
    Figure 6-3 SavingInventory Dollars by Inventory Turns
  • 50.
    Figure 6-4 Pastand Projected Inventory Turnover of Finished Goods
  • 51.
    Chapter 6: Summary andReview Questions Students should review their knowledge of the chapter by checking out the Summary and Study Questions for Chapter 6. This is the last slide for Chapter 6
  • 52.
    End of Chapter6 Slides Managing Inventory Flows in the Supply Chain