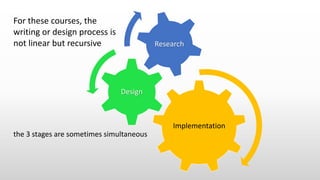
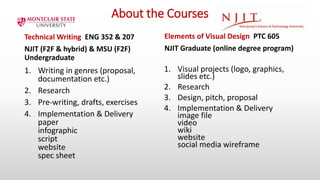
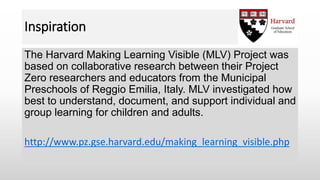
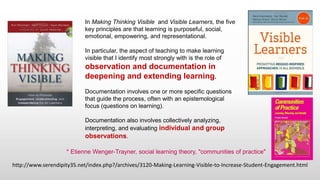
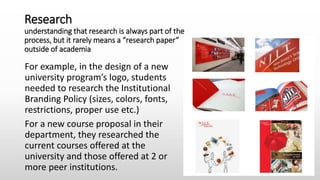
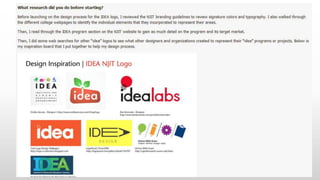
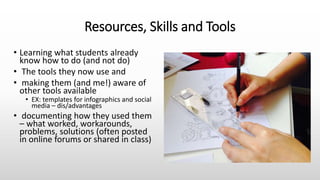
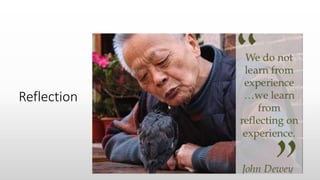
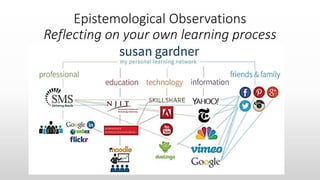
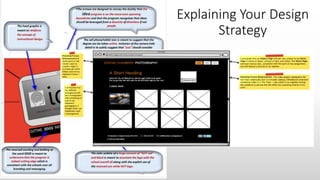
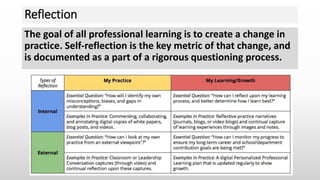
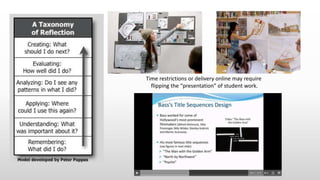
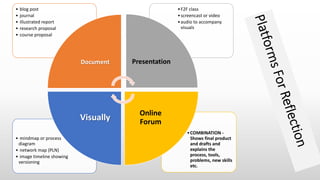
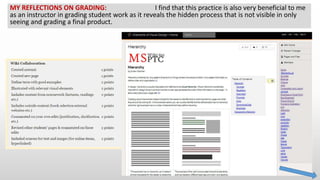
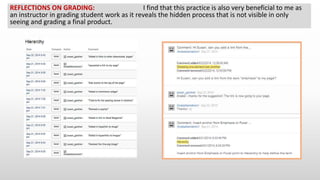
Making Learning Visible
Ken Ronkowitz
Implementation
Design
Research
For these courses, the
writing or design process is
not linear but recursive
the 3 stages are sometimes simultaneous
About the Courses
Technical Writing ENG 352 & 207
NJIT (F2F & hybrid) & MSU (F2F)
Undergraduate
1. Writing in genres (proposal,
documentation etc.)
2. Research
3. Pre-writing, drafts, exercises
4. Implementation & Delivery
paper
infographic
script
website
spec sheet
Elements of Visual Design PTC 605
NJIT Graduate (online degree program)
1. Visual projects (logo, graphics,
slides etc.)
2. Research
3. Design, pitch, proposal
4. Implementation & Delivery
image file
video
wiki
website
social media wireframe
Inspiration
The Harvard Making Learning Visible (MLV) Project was
based on collaborative research between their Project
Zero researchers and educators from the Municipal
Preschools of Reggio Emilia, Italy. MLV investigated how
best to understand, document, and support individual and
group learning for children and adults.
http://www.pz.gse.harvard.edu/making_learning_visible.php
http://www.serendipity35.net/index.php?/archives/3120-Making-Learning-Visible-to-Increase-Student-Engagement.html
In Making Thinking Visible and Visible Learners, the five
key principles are that learning is purposeful, social,
emotional, empowering, and representational.
In particular, the aspect of teaching to make learning
visible that I identify most strongly with is the role of
observation and documentation in
deepening and extending learning.
Documentation involves one or more specific questions
that guide the process, often with an epistemological
focus (questions on learning).
Documentation also involves collectively analyzing,
interpreting, and evaluating individual and group
observations.
* Etienne Wenger-Trayner, social learning theory, "communities of practice"
Research
understanding that research is always part of the
process, but it rarely means a “research paper”
outside of academia
For example, in the design of a new
university program’s logo, students
needed to research the Institutional
Branding Policy (sizes, colors, fonts,
restrictions, proper use etc.)
For a new course proposal in their
department, they researched the
current courses offered at the
university and those offered at 2 or
more peer institutions.
Resources, Skills and Tools
• Learning what students already
know how to do (and not do)
• The tools they now use and
• making them (and me!) aware of
other tools available
• EX: templates for infographics and social
media – dis/advantages
• documenting how they used them
– what worked, workarounds,
problems, solutions (often posted
in online forums or shared in class)
Reflection
Epistemological Observations
Reflecting on your own learning process
Explaining Your Design
Strategy
Reflection
The goal of all professional learning is to create a change in
practice. Self-reflection is the key metric of that change, and
is documented as a part of a rigorous questioning process.
Time restrictions or delivery online may require
flipping the “presentation” of student work.
Examples:
Logo Design Exercise
• For a new NJIT program
• Research the program info
online and the university
branding policies
• Create several rough
“sketches” and pitch/post for
comments and approval.
Seeing Drafts & Other Student Work
Reflecting on Course Concepts Used in Your Work
•COMBINATION -
Shows final product
and drafts and
explains the
process, tools,
problems, new skills
etc.
• mindmap or process
diagram
• network map (PLN)
• image timeline showing
versioning
•F2F class
•screencast or video
•audio to accompany
visuals
• blog post
• journal
• illustrated report
• research proposal
• course proposal
Document Presentation
Online
Forum
Visually
for a research proposal
Making Words Visible
Infographic by Anabel Damstrom
also displaying your work in an online portfolio
http://damstromanabel.wix.com/anabeldamstrom#!njit-infographic/c1280
http://njit2.mrooms.net/mod/forum/discuss.php?d=41558#p133326
4 SOCIAL MEDIA
GRAPHICS
Research layout &
required sizes
• Facebook: Cover image
& Profile icon
• Twitter: Profile icon &
Banner
• TEST THEM in that
network
and finally…
MY REFLECTIONS ON GRADING: I find that this practice is also very beneficial to me
as an instructor in grading student work as it reveals the hidden process that is not visible in only
seeing and grading a final product.
REFLECTIONS ON GRADING: I find that this practice is also very beneficial to me as
an instructor in grading student work as it reveals the hidden process that is not visible in only
seeing and grading a final product.
Ken Ronkowitz
ronkowitz@njit.edu
@ronkowitz on Twitter
ronkowitz.com
serendipity35.net edtech blog

Making Learning Visible

  • 1.
  • 2.
    Implementation Design Research For these courses,the writing or design process is not linear but recursive the 3 stages are sometimes simultaneous
  • 3.
    About the Courses TechnicalWriting ENG 352 & 207 NJIT (F2F & hybrid) & MSU (F2F) Undergraduate 1. Writing in genres (proposal, documentation etc.) 2. Research 3. Pre-writing, drafts, exercises 4. Implementation & Delivery paper infographic script website spec sheet Elements of Visual Design PTC 605 NJIT Graduate (online degree program) 1. Visual projects (logo, graphics, slides etc.) 2. Research 3. Design, pitch, proposal 4. Implementation & Delivery image file video wiki website social media wireframe
  • 4.
    Inspiration The Harvard MakingLearning Visible (MLV) Project was based on collaborative research between their Project Zero researchers and educators from the Municipal Preschools of Reggio Emilia, Italy. MLV investigated how best to understand, document, and support individual and group learning for children and adults. http://www.pz.gse.harvard.edu/making_learning_visible.php
  • 5.
    http://www.serendipity35.net/index.php?/archives/3120-Making-Learning-Visible-to-Increase-Student-Engagement.html In Making ThinkingVisible and Visible Learners, the five key principles are that learning is purposeful, social, emotional, empowering, and representational. In particular, the aspect of teaching to make learning visible that I identify most strongly with is the role of observation and documentation in deepening and extending learning. Documentation involves one or more specific questions that guide the process, often with an epistemological focus (questions on learning). Documentation also involves collectively analyzing, interpreting, and evaluating individual and group observations. * Etienne Wenger-Trayner, social learning theory, "communities of practice"
  • 6.
    Research understanding that researchis always part of the process, but it rarely means a “research paper” outside of academia For example, in the design of a new university program’s logo, students needed to research the Institutional Branding Policy (sizes, colors, fonts, restrictions, proper use etc.) For a new course proposal in their department, they researched the current courses offered at the university and those offered at 2 or more peer institutions.
  • 8.
    Resources, Skills andTools • Learning what students already know how to do (and not do) • The tools they now use and • making them (and me!) aware of other tools available • EX: templates for infographics and social media – dis/advantages • documenting how they used them – what worked, workarounds, problems, solutions (often posted in online forums or shared in class)
  • 9.
  • 10.
  • 11.
  • 12.
    Reflection The goal ofall professional learning is to create a change in practice. Self-reflection is the key metric of that change, and is documented as a part of a rigorous questioning process.
  • 13.
    Time restrictions ordelivery online may require flipping the “presentation” of student work.
  • 14.
    Examples: Logo Design Exercise •For a new NJIT program • Research the program info online and the university branding policies • Create several rough “sketches” and pitch/post for comments and approval.
  • 15.
    Seeing Drafts &Other Student Work
  • 16.
    Reflecting on CourseConcepts Used in Your Work
  • 17.
    •COMBINATION - Shows finalproduct and drafts and explains the process, tools, problems, new skills etc. • mindmap or process diagram • network map (PLN) • image timeline showing versioning •F2F class •screencast or video •audio to accompany visuals • blog post • journal • illustrated report • research proposal • course proposal Document Presentation Online Forum Visually
  • 18.
    for a researchproposal Making Words Visible
  • 19.
    Infographic by AnabelDamstrom also displaying your work in an online portfolio http://damstromanabel.wix.com/anabeldamstrom#!njit-infographic/c1280
  • 20.
    http://njit2.mrooms.net/mod/forum/discuss.php?d=41558#p133326 4 SOCIAL MEDIA GRAPHICS Researchlayout & required sizes • Facebook: Cover image & Profile icon • Twitter: Profile icon & Banner • TEST THEM in that network
  • 21.
  • 22.
    MY REFLECTIONS ONGRADING: I find that this practice is also very beneficial to me as an instructor in grading student work as it reveals the hidden process that is not visible in only seeing and grading a final product.
  • 23.
    REFLECTIONS ON GRADING:I find that this practice is also very beneficial to me as an instructor in grading student work as it reveals the hidden process that is not visible in only seeing and grading a final product.
  • 24.
    Ken Ronkowitz ronkowitz@njit.edu @ronkowitz onTwitter ronkowitz.com serendipity35.net edtech blog