Download as PDF, PPTX
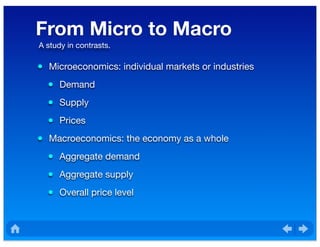
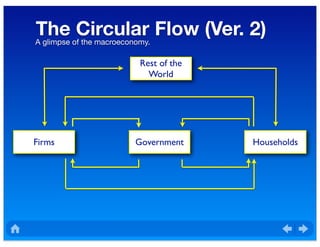
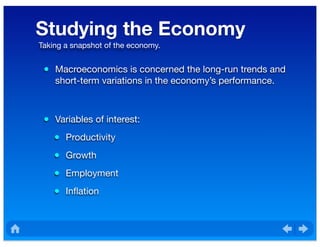
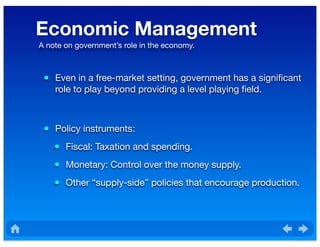
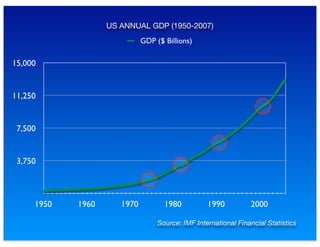
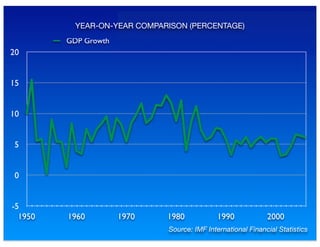
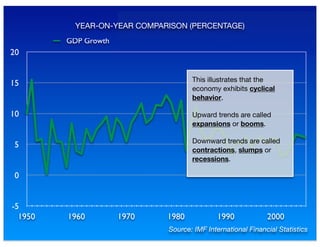
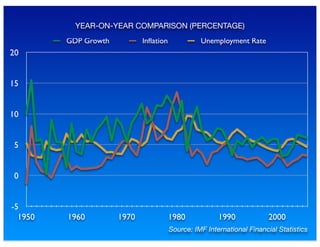
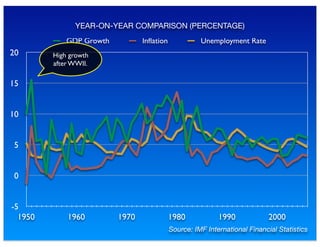
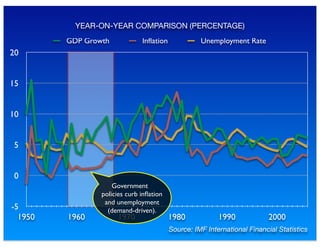
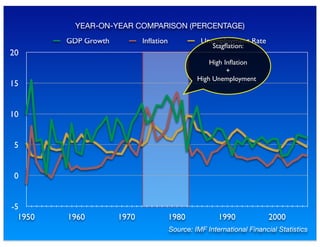
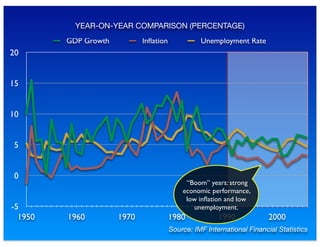

The document outlines the distinction between microeconomics and macroeconomics, focusing on the economy as a whole, including key concepts like aggregate demand and supply. It emphasizes the government's role in managing the economy through fiscal and monetary policies, particularly during cyclical trends of expansion and recession. Additionally, it presents historical data on GDP, inflation, and unemployment, illustrating economic performance over time and the effects of governmental policies.