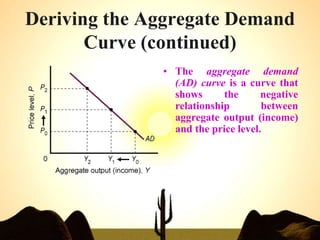
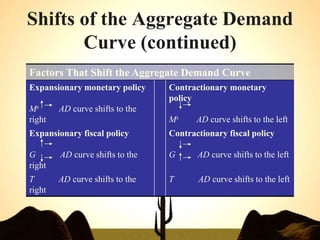
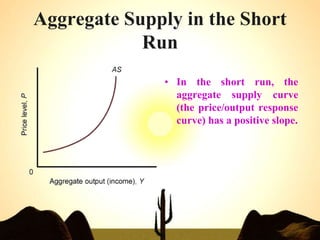
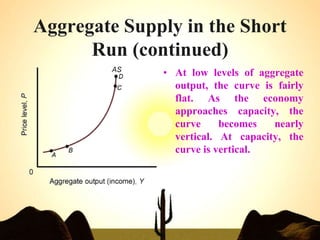
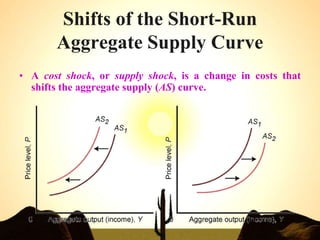
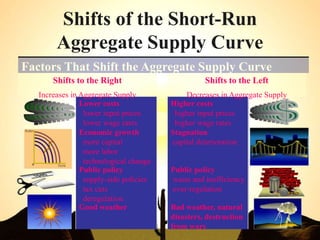
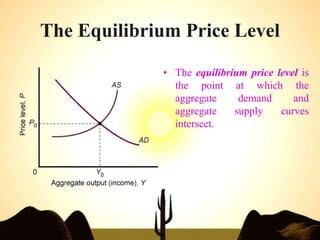
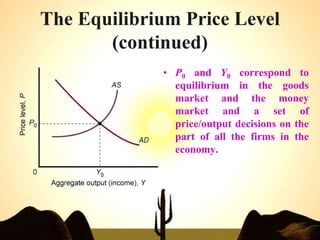
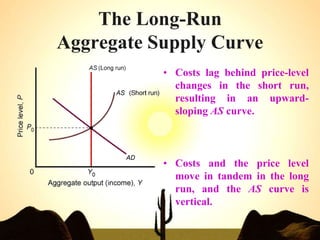
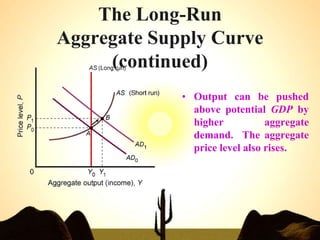
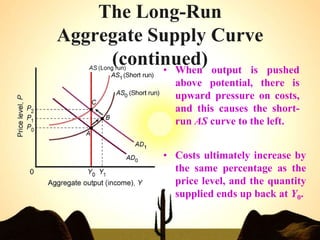
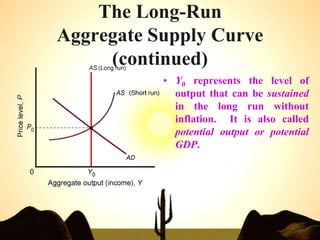
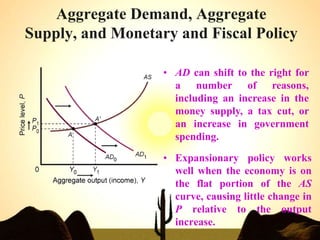
Aggregate Demand &
Aggregate Supply
Dr. Parveen Kumar Mehta
The Aggregate Demand Curve
• Aggregate demand is the total demand for
goods and services in the economy.
Deriving the Aggregate Demand
Curve
• To derive the aggregate demand curve, we examine
what happens to aggregate output (income) (Y) when
the price level (P) changes, assuming no changes in
government spending (G), net taxes (T), or the
monetary policy variable (Ms).
Deriving the Aggregate Demand
Curve (continued)
          
P M r I AE
d
Y
The Impact of an Increase in the Price Level on the
Economy – Assuming No Changes in G, T, and Ms
Deriving the Aggregate Demand
Curve (continued)
• The aggregate demand
(AD) curve is a curve that
shows the negative
relationship between
aggregate output (income)
and the price level.
The Aggregate Demand Curve:
A Warning
• The AD curve is not a market demand curve. It is a more
complex concept.
• We cannot use the ceteris paribus assumption to draw an AD
curve. In reality, many prices (including input prices) rise
together.
The Aggregate Demand Curve:
A Warning (continued)
• A higher price level causes the demand for
money to rise, which causes the interest rate
to rise.
• Then, the higher interest rate causes
aggregate output to fall.
The Aggregate Demand Curve:
A Warning (continued)
• At all points along the AD
curve, both the goods
market and the money
market are in equilibrium.
Other Reasons for a Downward-
Sloping Aggregate Demand
Curve
• The consumption link: The decrease in consumption
brought about by an increase in the interest rate
contributes to the overall decrease in output.
Other Reasons for a Downward-
Sloping Aggregate Demand
Curve (continued)
• The real wealth effect, or real balance effect is the
change in consumption brought about by a change
in real wealth that results from a change in the price
level.
Aggregate Expenditure
and Aggregate Demand
• At every point along the aggregate demand curve,
the aggregate quantity of output demanded is
exactly equal to planned aggregate expenditure.
Y = C + I + G
equilibrium
condition
Shifts of the Aggregate Demand
Curve
• An increase in the
quantity of money
supplied at a given price
level shifts the aggregate
demand curve to the right.
Shifts of the Aggregate Demand
Curve (continued)
• An increase in
government
purchases or a
decrease in net
taxes shifts the
aggregate
demand curve to
the right.
Shifts of the Aggregate Demand
Curve (continued)
Factors That Shift the Aggregate Demand Curve
Expansionary monetary policy
Ms AD curve shifts to the
right
Contractionary monetary
policy
Ms AD curve shifts to the left
Expansionary fiscal policy
G AD curve shifts to the
right
Contractionary fiscal policy
G AD curve shifts to the left
T AD curve shifts to the
right
T AD curve shifts to the left
The Aggregate Supply Curve
• Aggregate supply is the total supply of all
goods and services in the economy.
The Aggregate Supply Curve
(continued)
• The aggregate supply (AS) curve is a graph that
shows the relationship between the aggregate
quantity of output supplied by all firms in an
economy and the overall price level.
The Aggregate Supply Curve:
A Warning
• The aggregate supply curve is not a
market supply curve or the sum of all
the individual supply curves in the
economy.
The Aggregate Supply Curve:
A Warning
(continued)
• Firms do not simply respond to market-
determined prices, but they actually set
prices. Price-setting firms do not have
individual supply curves because these firms
are choosing both output and price at the
same time.
The Aggregate Supply Curve:
A Warning
(continued)
• When we draw a firm’s supply curve, we assume that input
prices are constant. In macroeconomics, an increase in the
overall price level means that at least some input prices will
be rising as well.
• The outputs of some firms are the inputs of other firms.
The Aggregate Supply Curve:
A Warning
(continued)
• Rather than an aggregate supply curve, what does exist is a
“price/output response” curve — a curve that traces out the
price and output decisions of all the markets and firms in the
economy under a given set of circumstances.
Aggregate Supply in the Short
Run
• In the short run, the
aggregate supply curve
(the price/output response
curve) has a positive slope.
Aggregate Supply in the Short
Run (continued)
• At low levels of aggregate
output, the curve is fairly
flat. As the economy
approaches capacity, the
curve becomes nearly
vertical. At capacity, the
curve is vertical.
Aggregate Supply in the Short
Run
(continued)
• Macroeconomists focus on whether or not the economy as a
whole is operating at full capacity.
• As the economy approaches maximum capacity, firms
respond to further increases in demand only by raising prices.
Output Levels and
Price/Output Responses
• When the economy is operating at low levels of output, an
increase in aggregate demand is likely to result in an increase
in output with little or no increase in the overall price level.
The Response of Input Prices to
Changes in the Overall Price
Level
• There must be a lag between changes
in input prices and changes in output
prices, otherwise the aggregate supply
(price/output response) curve would
be vertical.
The Response of Input Prices to
Changes in the Overall Price
Level (continued)
• Wage rates may increase at exactly the same rate as the
overall price level if the price-level increase is fully
anticipated. Most input prices, however, tend to lag
increases in output prices.
Shifts of the Short-Run
Aggregate Supply Curve
• A cost shock, or supply shock, is a change in costs that
shifts the aggregate supply (AS) curve.
Shifts of the Short-Run
Aggregate Supply Curve
Bad weather, natural
disasters, destruction
from wars
Good weather
Public policy
waste and inefficiency
over-regulation
Public policy
supply-side policies
tax cuts
deregulation
Stagnation
capital deterioration
Economic growth
more capital
more labor
technological change
Higher costs
higher input prices
higher wage rates
Lower costs
lower input prices
lower wage rates
Shifts to the Left
Decreases in Aggregate Supply
Shifts to the Right
Increases in Aggregate Supply
Factors That Shift the Aggregate Supply Curve
The Equilibrium Price Level
• The equilibrium price level is
the point at which the
aggregate demand and
aggregate supply curves
intersect.
The Equilibrium Price Level
(continued)
• P0 and Y0 correspond to
equilibrium in the goods
market and the money
market and a set of
price/output decisions on the
part of all the firms in the
economy.
The Long-Run
Aggregate Supply Curve
• Costs lag behind price-level
changes in the short run,
resulting in an upward-
sloping AS curve.
• Costs and the price level
move in tandem in the long
run, and the AS curve is
vertical.
The Long-Run
Aggregate Supply Curve
(continued)
• Output can be pushed
above potential GDP by
higher aggregate
demand. The aggregate
price level also rises.
The Long-Run
Aggregate Supply Curve
(continued)
• When output is pushed
above potential, there is
upward pressure on costs,
and this causes the short-
run AS curve to the left.
• Costs ultimately increase by
the same percentage as the
price level, and the quantity
supplied ends up back at Y0.
The Long-Run
Aggregate Supply Curve
(continued)
• Y0 represents the level of
output that can be sustained
in the long run without
inflation. It is also called
potential output or potential
GDP.
Aggregate Demand, Aggregate
Supply, and Monetary and Fiscal Policy
• Expansionary policy works
well when the economy is on
the flat portion of the AS
curve, causing little change in
P relative to the output
increase.
• AD can shift to the right for
a number of reasons,
including an increase in the
money supply, a tax cut, or
an increase in government
spending.
Thank You.

AggregateDemandAggregate Supply.ppt

  • 1.
    Aggregate Demand & AggregateSupply Dr. Parveen Kumar Mehta
  • 2.
    The Aggregate DemandCurve • Aggregate demand is the total demand for goods and services in the economy.
  • 3.
    Deriving the AggregateDemand Curve • To derive the aggregate demand curve, we examine what happens to aggregate output (income) (Y) when the price level (P) changes, assuming no changes in government spending (G), net taxes (T), or the monetary policy variable (Ms).
  • 4.
    Deriving the AggregateDemand Curve (continued)            P M r I AE d Y The Impact of an Increase in the Price Level on the Economy – Assuming No Changes in G, T, and Ms
  • 5.
    Deriving the AggregateDemand Curve (continued) • The aggregate demand (AD) curve is a curve that shows the negative relationship between aggregate output (income) and the price level.
  • 6.
    The Aggregate DemandCurve: A Warning • The AD curve is not a market demand curve. It is a more complex concept. • We cannot use the ceteris paribus assumption to draw an AD curve. In reality, many prices (including input prices) rise together.
  • 7.
    The Aggregate DemandCurve: A Warning (continued) • A higher price level causes the demand for money to rise, which causes the interest rate to rise. • Then, the higher interest rate causes aggregate output to fall.
  • 8.
    The Aggregate DemandCurve: A Warning (continued) • At all points along the AD curve, both the goods market and the money market are in equilibrium.
  • 9.
    Other Reasons fora Downward- Sloping Aggregate Demand Curve • The consumption link: The decrease in consumption brought about by an increase in the interest rate contributes to the overall decrease in output.
  • 10.
    Other Reasons fora Downward- Sloping Aggregate Demand Curve (continued) • The real wealth effect, or real balance effect is the change in consumption brought about by a change in real wealth that results from a change in the price level.
  • 11.
    Aggregate Expenditure and AggregateDemand • At every point along the aggregate demand curve, the aggregate quantity of output demanded is exactly equal to planned aggregate expenditure. Y = C + I + G equilibrium condition
  • 12.
    Shifts of theAggregate Demand Curve • An increase in the quantity of money supplied at a given price level shifts the aggregate demand curve to the right.
  • 13.
    Shifts of theAggregate Demand Curve (continued) • An increase in government purchases or a decrease in net taxes shifts the aggregate demand curve to the right.
  • 14.
    Shifts of theAggregate Demand Curve (continued) Factors That Shift the Aggregate Demand Curve Expansionary monetary policy Ms AD curve shifts to the right Contractionary monetary policy Ms AD curve shifts to the left Expansionary fiscal policy G AD curve shifts to the right Contractionary fiscal policy G AD curve shifts to the left T AD curve shifts to the right T AD curve shifts to the left
  • 15.
    The Aggregate SupplyCurve • Aggregate supply is the total supply of all goods and services in the economy.
  • 16.
    The Aggregate SupplyCurve (continued) • The aggregate supply (AS) curve is a graph that shows the relationship between the aggregate quantity of output supplied by all firms in an economy and the overall price level.
  • 17.
    The Aggregate SupplyCurve: A Warning • The aggregate supply curve is not a market supply curve or the sum of all the individual supply curves in the economy.
  • 18.
    The Aggregate SupplyCurve: A Warning (continued) • Firms do not simply respond to market- determined prices, but they actually set prices. Price-setting firms do not have individual supply curves because these firms are choosing both output and price at the same time.
  • 19.
    The Aggregate SupplyCurve: A Warning (continued) • When we draw a firm’s supply curve, we assume that input prices are constant. In macroeconomics, an increase in the overall price level means that at least some input prices will be rising as well. • The outputs of some firms are the inputs of other firms.
  • 20.
    The Aggregate SupplyCurve: A Warning (continued) • Rather than an aggregate supply curve, what does exist is a “price/output response” curve — a curve that traces out the price and output decisions of all the markets and firms in the economy under a given set of circumstances.
  • 21.
    Aggregate Supply inthe Short Run • In the short run, the aggregate supply curve (the price/output response curve) has a positive slope.
  • 22.
    Aggregate Supply inthe Short Run (continued) • At low levels of aggregate output, the curve is fairly flat. As the economy approaches capacity, the curve becomes nearly vertical. At capacity, the curve is vertical.
  • 23.
    Aggregate Supply inthe Short Run (continued) • Macroeconomists focus on whether or not the economy as a whole is operating at full capacity. • As the economy approaches maximum capacity, firms respond to further increases in demand only by raising prices.
  • 24.
    Output Levels and Price/OutputResponses • When the economy is operating at low levels of output, an increase in aggregate demand is likely to result in an increase in output with little or no increase in the overall price level.
  • 25.
    The Response ofInput Prices to Changes in the Overall Price Level • There must be a lag between changes in input prices and changes in output prices, otherwise the aggregate supply (price/output response) curve would be vertical.
  • 26.
    The Response ofInput Prices to Changes in the Overall Price Level (continued) • Wage rates may increase at exactly the same rate as the overall price level if the price-level increase is fully anticipated. Most input prices, however, tend to lag increases in output prices.
  • 27.
    Shifts of theShort-Run Aggregate Supply Curve • A cost shock, or supply shock, is a change in costs that shifts the aggregate supply (AS) curve.
  • 28.
    Shifts of theShort-Run Aggregate Supply Curve Bad weather, natural disasters, destruction from wars Good weather Public policy waste and inefficiency over-regulation Public policy supply-side policies tax cuts deregulation Stagnation capital deterioration Economic growth more capital more labor technological change Higher costs higher input prices higher wage rates Lower costs lower input prices lower wage rates Shifts to the Left Decreases in Aggregate Supply Shifts to the Right Increases in Aggregate Supply Factors That Shift the Aggregate Supply Curve
  • 29.
    The Equilibrium PriceLevel • The equilibrium price level is the point at which the aggregate demand and aggregate supply curves intersect.
  • 30.
    The Equilibrium PriceLevel (continued) • P0 and Y0 correspond to equilibrium in the goods market and the money market and a set of price/output decisions on the part of all the firms in the economy.
  • 31.
    The Long-Run Aggregate SupplyCurve • Costs lag behind price-level changes in the short run, resulting in an upward- sloping AS curve. • Costs and the price level move in tandem in the long run, and the AS curve is vertical.
  • 32.
    The Long-Run Aggregate SupplyCurve (continued) • Output can be pushed above potential GDP by higher aggregate demand. The aggregate price level also rises.
  • 33.
    The Long-Run Aggregate SupplyCurve (continued) • When output is pushed above potential, there is upward pressure on costs, and this causes the short- run AS curve to the left. • Costs ultimately increase by the same percentage as the price level, and the quantity supplied ends up back at Y0.
  • 34.
    The Long-Run Aggregate SupplyCurve (continued) • Y0 represents the level of output that can be sustained in the long run without inflation. It is also called potential output or potential GDP.
  • 35.
    Aggregate Demand, Aggregate Supply,and Monetary and Fiscal Policy • Expansionary policy works well when the economy is on the flat portion of the AS curve, causing little change in P relative to the output increase. • AD can shift to the right for a number of reasons, including an increase in the money supply, a tax cut, or an increase in government spending.
  • 36.