•Classical theory describesthe world in
the long run, Keynesian the the short
run.
•Changes in the money supply affect
nominal variables but not real variables
in the long run.
Short-Run Economic Fluctuations
3.
•Economic fluctuations areirregular and
unpredictable.
•Fluctuations in the economy are often
called the business cycle.
THREE KEY FACTS ABOUT ECONOMIC FLUCTUATIONS
4.
•Most macroeconomic variables
fluctuatetogether.
•Most macroeconomic variables that
measure some type of income or
production also fluctuate closely
together. Although many macroeconomic
variables fluctuate together, they
fluctuate by different amounts.
THREE KEY FACTS ABOUT ECONOMIC FLUCTUATIONS
5.
•As output falls,unemployment rises.
•Changes in real GDP are inversely
related to changes in the unemployment
rate.
•During times of recession,
unemployment rises substantially.
THREE KEY FACTS ABOUT ECONOMIC FLUCTUATIONS
6.
Two variables areused to develop a
model to analyze the short-run
fluctuations :
1.The economy’s output of goods and
services measured by real GDP.
2.The overall price level measured by
the CPI or the GDP deflator.
The Basic Model of Economic Fluctuations
7.
Defined:
•Amounts of RealOutput
•Buyers Collectively Desire
•At Each Possible Price Level
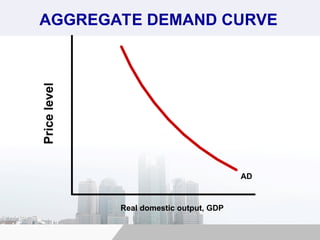
AGGREGATE DEMAND
Aggregate Demand Curve
The four components of GDP (Y)
contribute to the aggregate
demand for goods and services.
Y = C + I + G + NX
8.
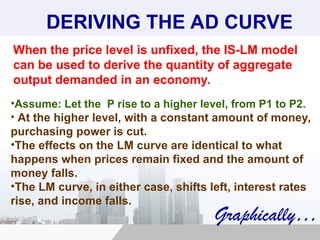
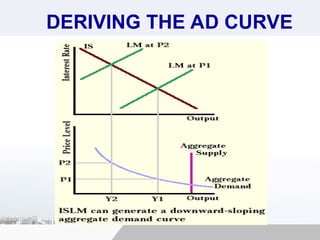
DERIVING THE ADCURVE
When the price level is unfixed, the IS-LM model
can be used to derive the quantity of aggregate
output demanded in an economy.
•Assume: Let the P rise to a higher level, from P1 to P2.
• At the higher level, with a constant amount of money,
purchasing power is cut.
•The effects on the LM curve are identical to what
happens when prices remain fixed and the amount of
money falls.
•The LM curve, in either case, shifts left, interest rates
rise, and income falls.
Graphically…
AD Curve vsIndividual Demand Curve
The following points should be noted about the
AD curve against the normal demand curve:
1. The price variable on the vertical axis is a
nominal price and not a relative one which you
meet in microeconomics.
2. The demand curve in microeconomics is
downward sloping because the substitution
effect dominates the income effect from a
relative price change.
12.
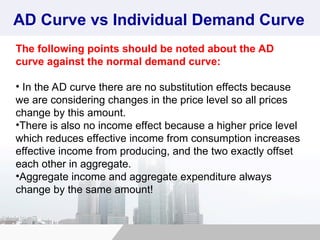
AD Curve vsIndividual Demand Curve
The following points should be noted about the AD
curve against the normal demand curve:
• In the AD curve there are no substitution effects because
we are considering changes in the price level so all prices
change by this amount.
•There is also no income effect because a higher price level
which reduces effective income from consumption increases
effective income from producing, and the two exactly offset
each other in aggregate.
•Aggregate income and aggregate expenditure always
change by the same amount!
13.
THREE MAJOR REASONS
WHYTHE AD CURVE IS DOWNWARD SLOPING
The Price Level and Consumption: The Wealth Effect
A decrease in the price level makes consumers feel
more wealthy, which in turn encourages them to spend
more.
This increase in consumer spending means larger
quantities of goods and services demanded.
While higher prices reduce the value of financial
(money) assets. When people feel less wealthy they buy
less.
14.
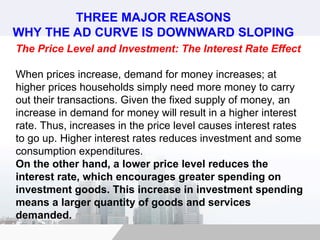
THREE MAJOR REASONS
WHYTHE AD CURVE IS DOWNWARD SLOPING
The Price Level and Investment: The Interest Rate Effect
When prices increase, demand for money increases; at
higher prices households simply need more money to carry
out their transactions. Given the fixed supply of money, an
increase in demand for money will result in a higher interest
rate. Thus, increases in the price level causes interest rates
to go up. Higher interest rates reduces investment and some
consumption expenditures.
On the other hand, a lower price level reduces the
interest rate, which encourages greater spending on
investment goods. This increase in investment spending
means a larger quantity of goods and services
demanded.
15.
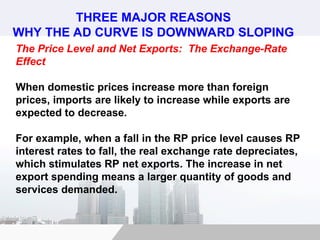
THREE MAJOR REASONS
WHYTHE AD CURVE IS DOWNWARD SLOPING
The Price Level and Net Exports: The Exchange-Rate
Effect
When domestic prices increase more than foreign
prices, imports are likely to increase while exports are
expected to decrease.
For example, when a fall in the RP price level causes RP
interest rates to fall, the real exchange rate depreciates,
which stimulates RP net exports. The increase in net
export spending means a larger quantity of goods and
services demanded.
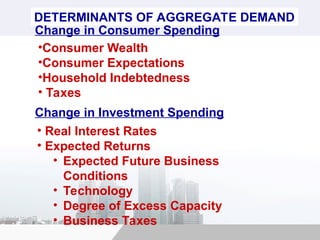
DETERMINANTS OF AGGREGATEDEMAND
Change in Consumer Spending
•Consumer Wealth
•Consumer Expectations
•Household Indebtedness
• Taxes
Change in Investment Spending
• Real Interest Rates
• Expected Returns
• Expected Future Business
Conditions
• Technology
• Degree of Excess Capacity
• Business Taxes
19.
DETERMINANTS OF AGGREGATEDEMAND
Government Spending
Net Export Spending
• National Income Abroad
• Exchange Rates
20.
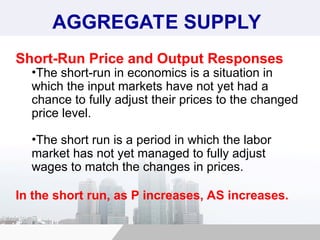
AGGREGATE SUPPLY
Short-Run Priceand Output Responses
•The short-run in economics is a situation in
which the input markets have not yet had a
chance to fully adjust their prices to the changed
price level.
•The short run is a period in which the labor
market has not yet managed to fully adjust
wages to match the changes in prices.
In the short run, as P increases, AS increases.
21.
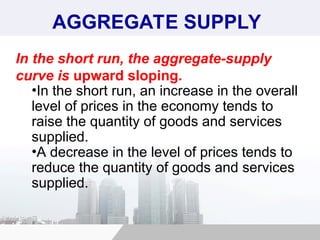
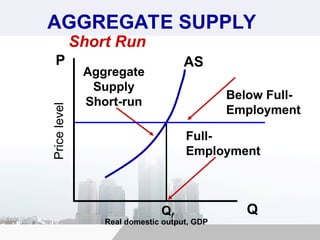
AGGREGATE SUPPLY
In theshort run, the aggregate-supply
curve is upward sloping.
•In the short run, an increase in the overall
level of prices in the economy tends to
raise the quantity of goods and services
supplied.
•A decrease in the level of prices tends to
reduce the quantity of goods and services
supplied.
22.
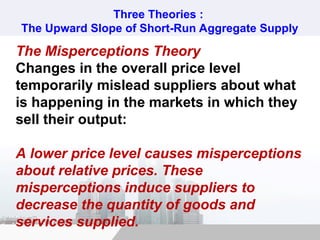
Three Theories :
TheUpward Slope of Short-Run Aggregate Supply
The Misperceptions Theory
Changes in the overall price level
temporarily mislead suppliers about what
is happening in the markets in which they
sell their output:
A lower price level causes misperceptions
about relative prices. These
misperceptions induce suppliers to
decrease the quantity of goods and
services supplied.
23.
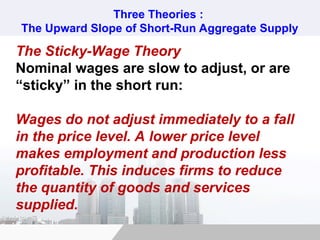
Three Theories :
TheUpward Slope of Short-Run Aggregate Supply
The Sticky-Wage Theory
Nominal wages are slow to adjust, or are
“sticky” in the short run:
Wages do not adjust immediately to a fall
in the price level. A lower price level
makes employment and production less
profitable. This induces firms to reduce
the quantity of goods and services
supplied.
24.
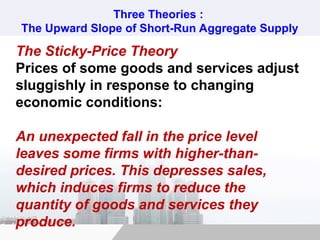
Three Theories :
TheUpward Slope of Short-Run Aggregate Supply
The Sticky-Price Theory
Prices of some goods and services adjust
sluggishly in response to changing
economic conditions:
An unexpected fall in the price level
leaves some firms with higher-than-
desired prices. This depresses sales,
which induces firms to reduce the
quantity of goods and services they
produce.
25.
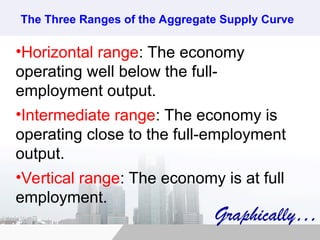
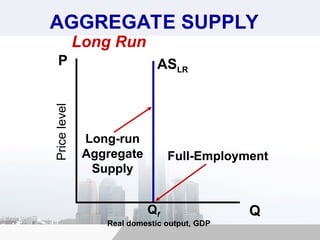
The Three Rangesof the Aggregate Supply Curve
•Horizontal range: The economy
operating well below the full-
employment output.
•Intermediate range: The economy is
operating close to the full-employment
output.
•Vertical range: The economy is at full
employment.
Graphically…
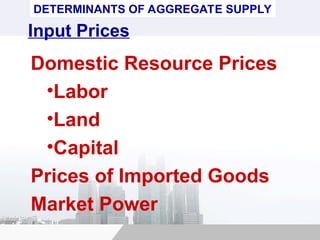
DETERMINANTS OF AGGREGATESUPPLY
Input Prices
Domestic Resource Prices
•Labor
•Land
•Capital
Prices of Imported Goods
Market Power
30.
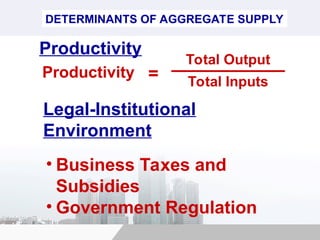
DETERMINANTS OF AGGREGATESUPPLY
Productivity
Productivity =
Total Output
Total Inputs
Legal-Institutional
Environment
• Business Taxes and
Subsidies
• Government Regulation
31.
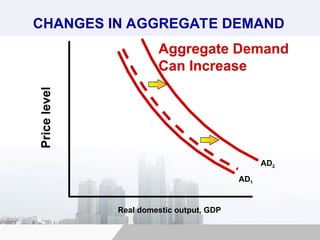
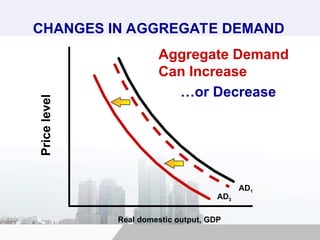
•The primary causeof shifts in the economy is
aggregate demand.
•Recall that AD can be affected by C, G, I ,and NX.
•In general, any expansionary policy shifts the
aggregate demand curve to the right while any
contractionary policy shifts the aggregate demand curve
to the left.
•In the long run, since long-term aggregate supply is
fixed by the factors of production, short-term aggregate
supply shifts to the left so that the only effect of a
change in aggregate demand is a change in the price
level.
EQUILIBRIUM AND CHANGES
IN EQUILIBRIUM
32.
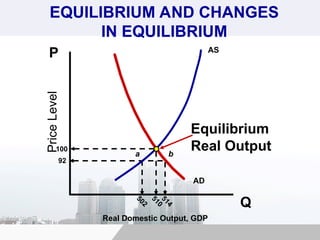
Price
Level
Real Domestic Output,GDP
Q
P AS
AD
5
1
0
5
0
2
5
1
4
EQUILIBRIUM AND CHANGES
IN EQUILIBRIUM
92
100
a b
Equilibrium
Real Output
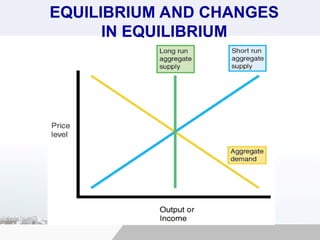
Logic Applied toall Shifts in AD
• The long-run equilibrium is always dictated by
the intersection of the vertical long-run AScurve
and the AD curve.
•The short-run equilibrium is always dictated by
the intersection of the short-run AS curve and
the AD curve.
•When the AD curve shifts, the economy always
shifts from the long-run equilibrium to the short-
run equilibrium and then back to a new long-run
equilibrium.
35.
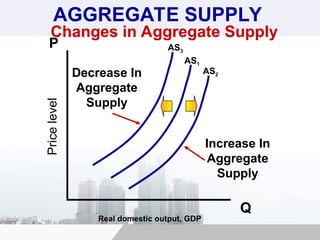
Shifts in AggregateSupply in the AS-AD Model
• Shifts in the short-run AS curve are much
rarer than shifts in the AD curve.
•Usually, the short-run AS curve only shifts
in response to the AD curve.
•But, when a supply shock occurs, the short-
run AS curve shifts without prompting from
the AD curve.
36.
Shifts in AggregateSupply in the AS-AD Model
• The correction process is exactly the same for a
shift in the short-run AS curve as it is for a shift in
the AD curve.
•That is, when the short-run AS curve shifts, a
short-run equilibrium exists where the short-run
AS curve intersects the AD curve.
•The AD curve shifts along the short-run AS curve
until the AD curve intersects both the short-run and
the long-run AS curves.
•Once the economy reaches this new long-run
equilibrium, the price level is changed but output is
not.
37.
Two Types ofSupply Shocks
1. Adverse Supply Shocks
• Include things like increases in oil prices, a
drought that destroys crops, and aggressive
union actions.
•In general, adverse supply shocks cause
the price level for a given amount of output
to increase.
•This is represented by a shift of the short-
run aggregate supply curve to the left.
38.
Two Types ofSupply Shocks
2. Positive Supply Shocks
• Include things like decreases in oil prices or
an unexpected great crop season.
•In general, positive supply shocks cause the
price level for a given amount of output to
decrease.
•This is represented by a shift of the short-
run aggregate supply curve to the right.


![Awareness of digital currency[1] (1).pptx](https://cdn.slidesharecdn.com/ss_thumbnails/awarenessofdigitalcurrency11-260125155504-b1badee4-thumbnail.jpg?width=640&height=640&fit=bounds)


