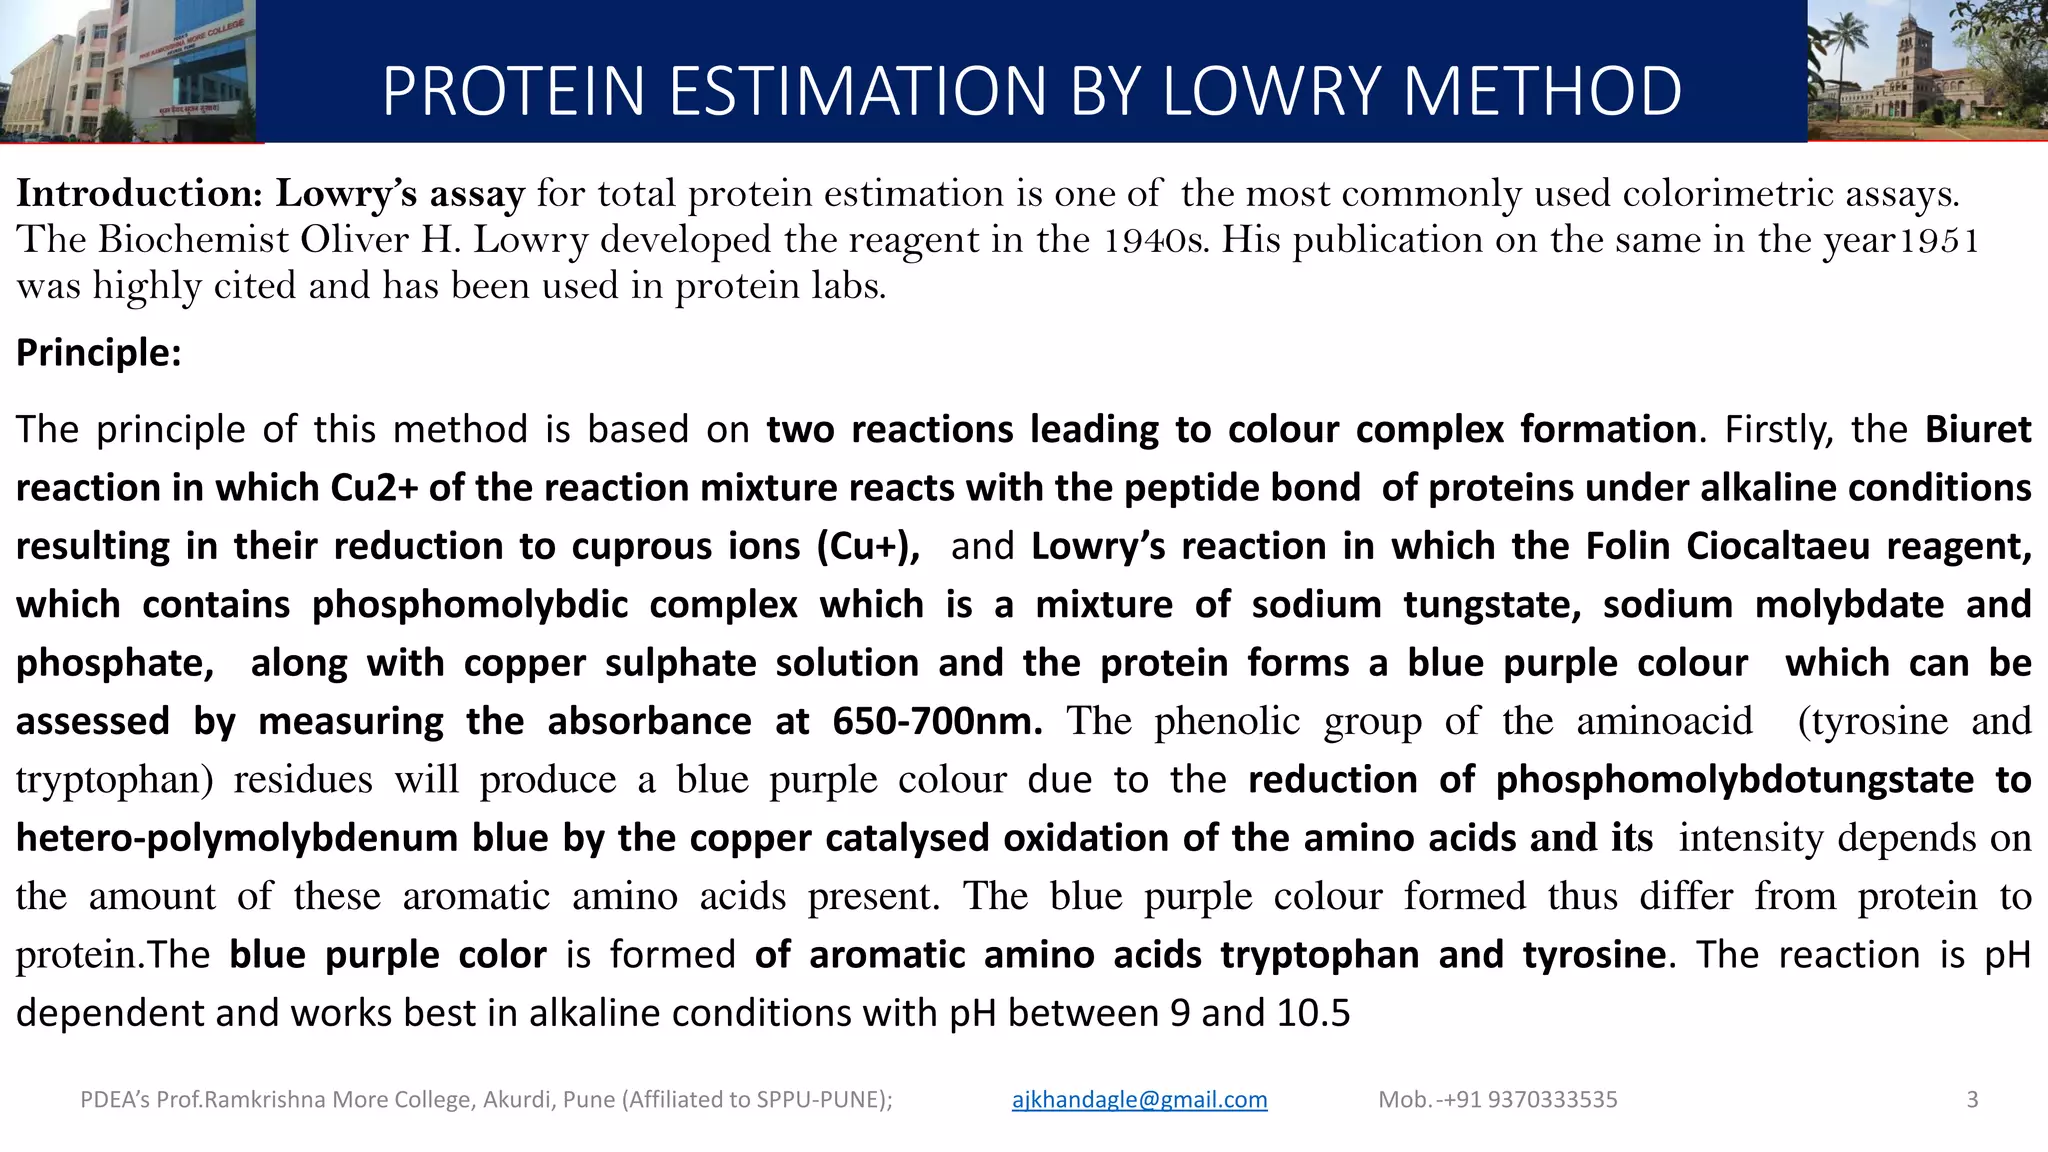
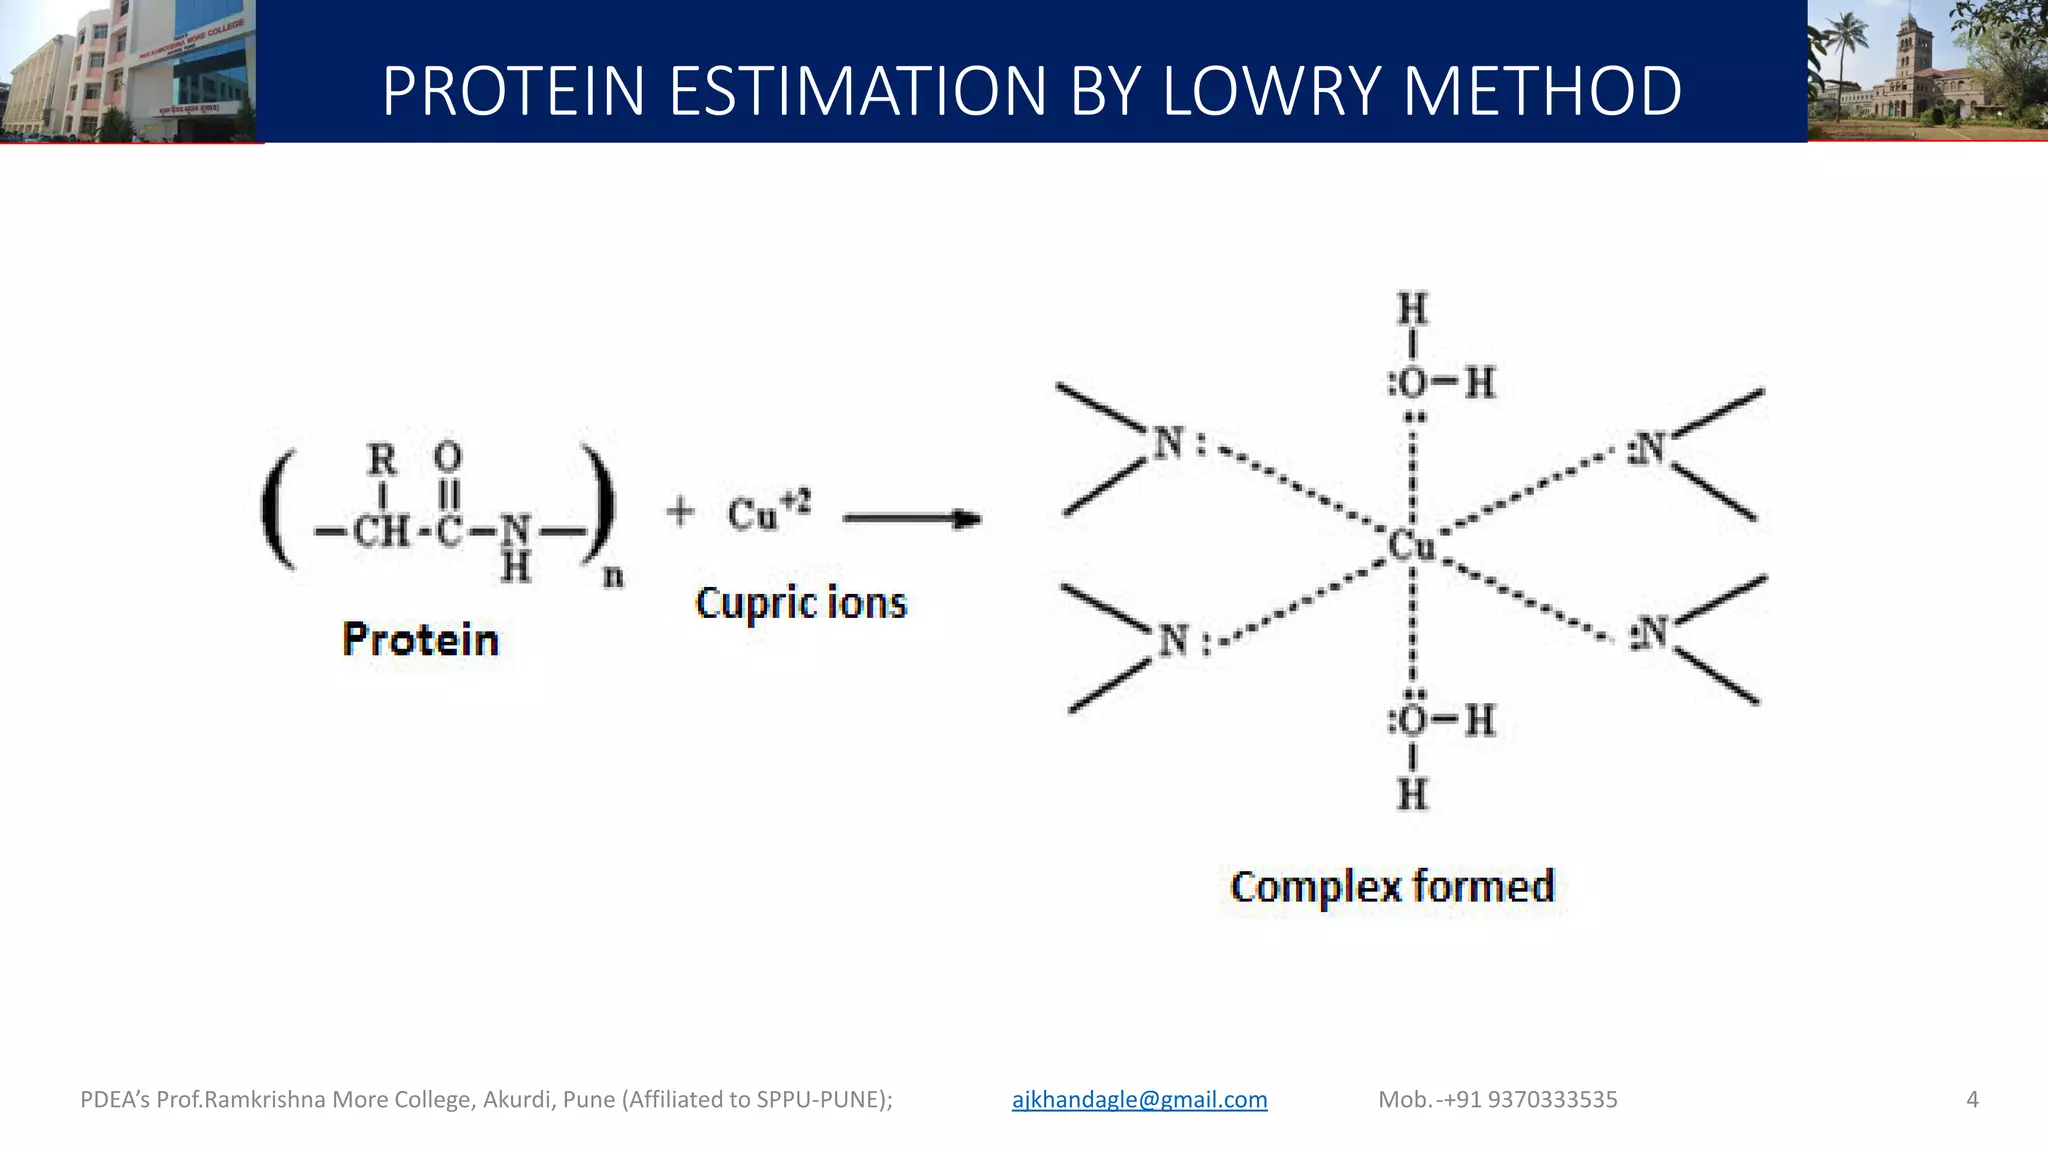
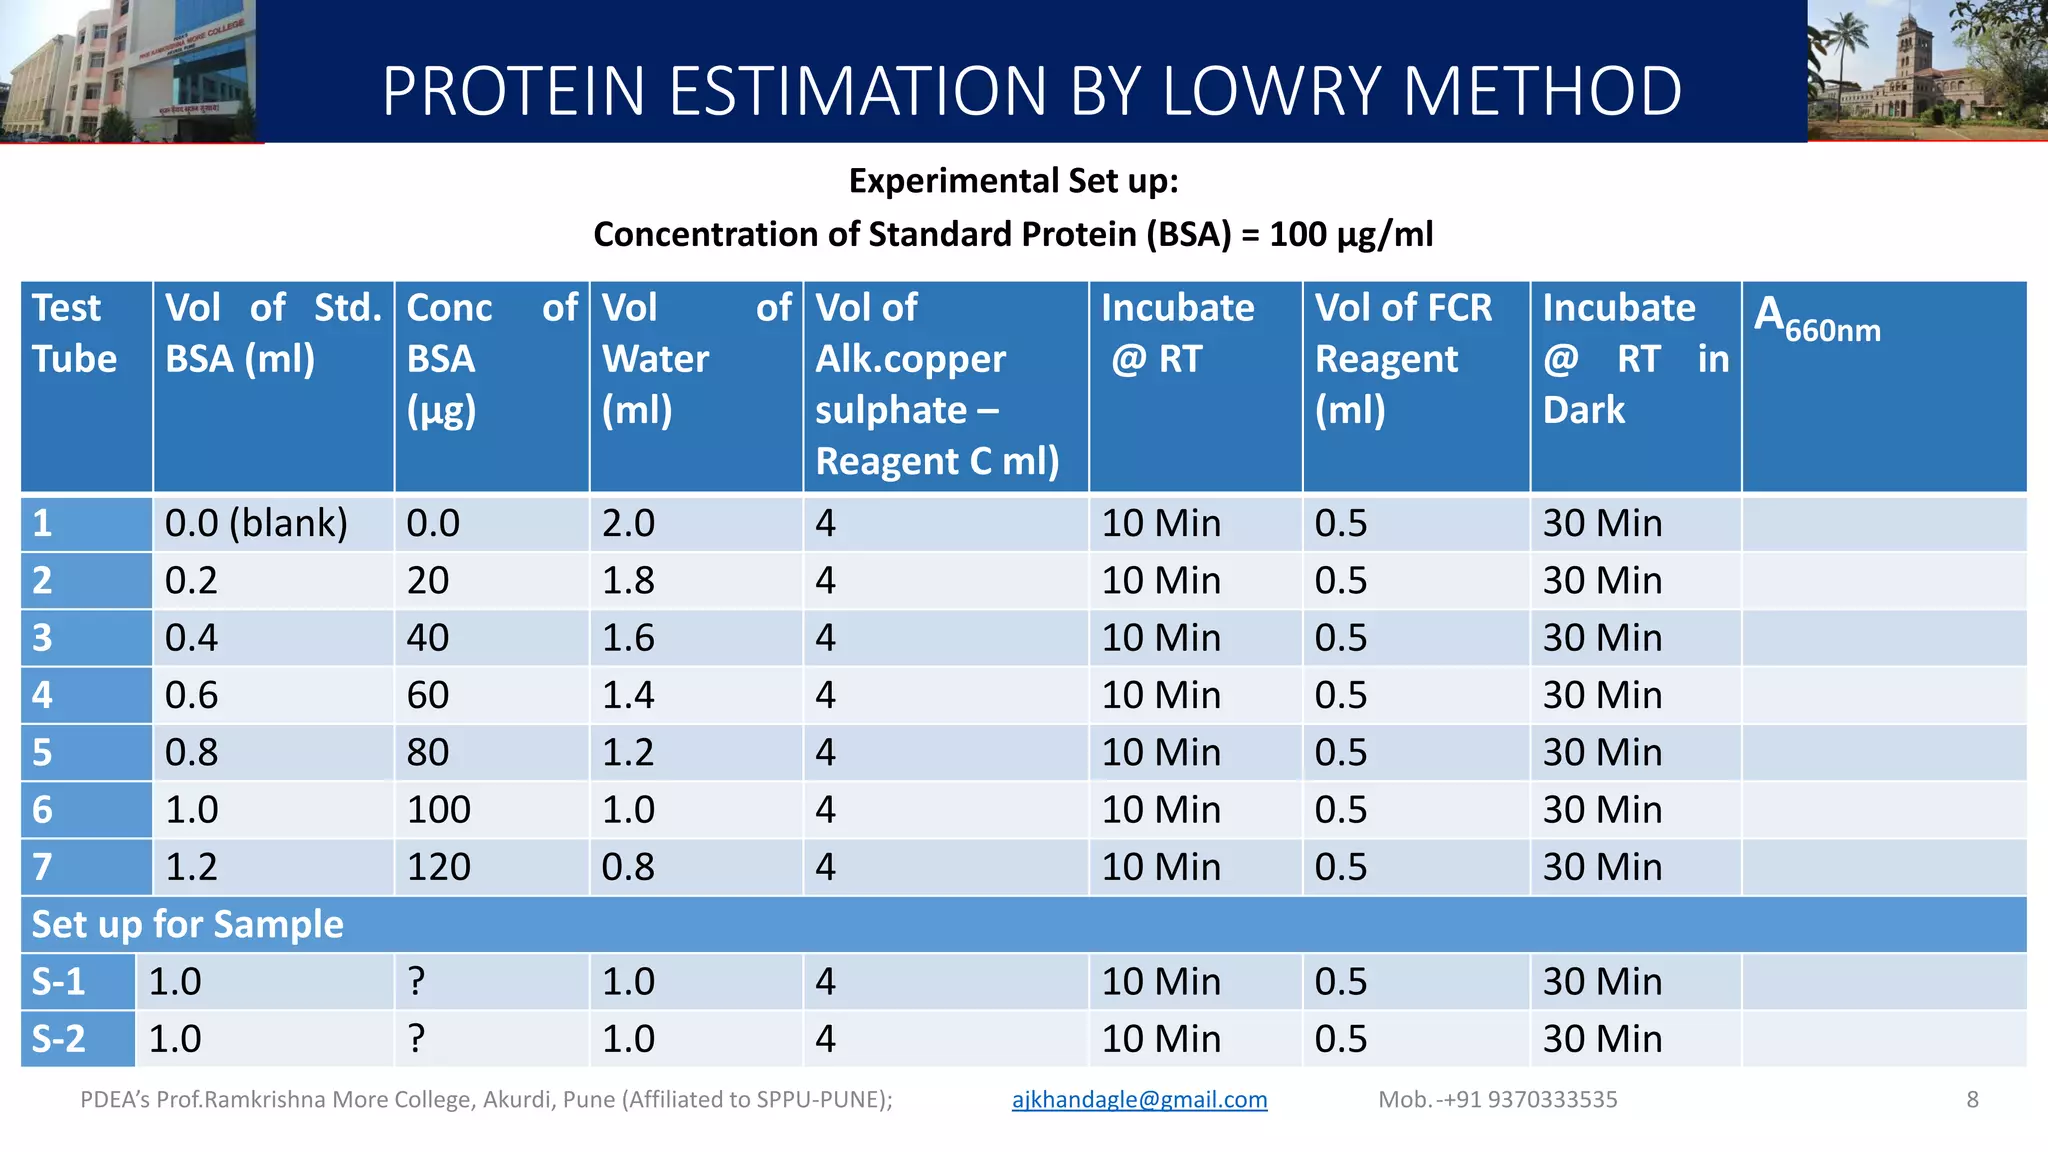
BIOCHEMISTRY LAB
Title: Total Protein Estimation by Lowry Method
Dr. Abhay Khandagle
Head, Postgraduate Department and Research Centre in Zoology
Prof. Ramkrishna More Arts, Commerce & Science College
INDIA
PDEA’s Prof.Ramkrishna More College, Akurdi, Pune (Affiliated to SPPU-PUNE); Mob.-+91 9370333535ajkhandagle@gmail.com 1
Objectives
• To deter i e the o e tratio of protei s y Lowry’s method.
• To prepare the required lab reagents.
• To construct standard graph on paper.
• To develop standard graph with Spreadsheet.
PDEA’s Prof.Ramkrishna More College, Akurdi, Pune (Affiliated to SPPU-PUNE); ajkhandagle@gmail.com Mob.-+91 9370333535 2
PROTEIN ESTIMATION BY LOWRY METHOD
Introduction: Lowry’s assay for total protein estimation is one of the most commonly used colorimetric assays.
The Biochemist Oliver H. Lowry developed the reagent in the 1940s. His publication on the same in the year1951
was highly cited and has been used in protein labs.
Principle:
The principle of this method is based on two reactions leading to colour complex formation. Firstly, the Biuret
reaction in which Cu2+ of the reaction mixture reacts with the peptide bond of proteins under alkaline conditions
resulting in their reduction to cuprous ions (Cu+), and Lowry’s reaction in which the Folin Ciocaltaeu reagent,
which contains phosphomolybdic complex which is a mixture of sodium tungstate, sodium molybdate and
phosphate, along with copper sulphate solution and the protein forms a blue purple colour which can be
assessed by measuring the absorbance at 650-700nm. The phenolic group of the aminoacid (tyrosine and
tryptophan) residues will produce a blue purple colour due to the reduction of phosphomolybdotungstate to
hetero-polymolybdenum blue by the copper catalysed oxidation of the amino acids and its intensity depends on
the amount of these aromatic amino acids present. The blue purple colour formed thus differ from protein to
protein.The blue purple color is formed of aromatic amino acids tryptophan and tyrosine. The reaction is pH
dependent and works best in alkaline conditions with pH between 9 and 10.5
PDEA’s Prof.Ramkrishna More College, Akurdi, Pune (Affiliated to SPPU-PUNE); Mob.-+91 9370333535ajkhandagle@gmail.com 3
PROTEIN ESTIMATION BY LOWRY METHOD
PDEA’s Prof.Ramkrishna More College, Akurdi, Pune (Affiliated to SPPU-PUNE); Mob.-+91 9370333535ajkhandagle@gmail.com 4
PROTEIN ESTIMATION BY LOWRY METHOD
Advantages
It is a sensitive assay which requires no digestion of protein.
It is 10 or 20 times more sensitive as compared with ultraviolet absorption at 280 nm.
It is more specific and less interrupted by turbidity,
It is significantly more sensitive than the ninhydrin reaction and biuret reaction.
It is simple to perform and can be easily used on small scale in the labs.
Disadvantages
The amount of colour developed differs from protein to protein,
It is less constant than the biuret reaction, but more constant than the absorption at 280 nm.
The color is not exactingly proportional to concentration.
Applications:
It is used in measurement of protein during enzyme fractionations, mixed tissue proteins, measurement of
very small absolute amounts of protein, or highly diluted protein and analyses of large numbers of similar
protein samples.
PDEA’s Prof.Ramkrishna More College, Akurdi, Pune (Affiliated to SPPU-PUNE); Mob.-+91 9370333535ajkhandagle@gmail.com 5
PROTEIN ESTIMATION BY LOWRY METHOD
Reagents for Lowry method:
Lowry Reagent (or) alkaline copper sulfate solution:
Mix 50ml of solution A with 1 ml of solution B, just prior to use.
Solution A : 2% sodium carbonate in 0.1N NaOH.
Solution B : 0.5% copper sulfate solution in 1% sodium potassium tartarate solution (to be prepared fresh)
Folin-Ciocalteau reagent: This is commercially available and has to be diluted with equal
volume of water just before use.
Standard protein solution: Dissolve 10mg of BSA (as it is easily available, cheap and with improved
purity) in 100ml of distilled water in a volumetric flask.
(for concentration-100 µg/ml)
PDEA’s Prof.Ramkrishna More College, Akurdi, Pune (Affiliated to SPPU-PUNE); Mob.-+91 9370333535ajkhandagle@gmail.com 6
PROTEIN ESTIMATION BY LOWRY METHOD
Procedure:
Pipette out into clean glass tubes 0.2, 0.4, 0.6, 0.8, and 1.0 of the protein solution and make
up the total volume to 2ml with addition of distilled water.
To each tube add 4ml of the alkaline-copper sulfate solution (Reagent C), mix well and allow
to stand at room temperature for 10 minutes.
Pipette out 0.5ml of the FCR reagent and add into each tube, mix immediately after each
addition.
Allow the tubes to stand for 30 minutes.
Measure the Absorbance of the blue Purple color formed at 660nm.
Prepare a blank tube with 2 ml of distilled water(instead of the standard protein) followed
by all additions mentioned above and with 1ml of unknown solution (Sample) and perform
the additions as in case of the standards.
Prepare a calibration curve with mg of protein on X-axis and O.D. (A660nm) on Y-axis and
determine the amount of protein present in a given unknown sample.
PDEA’s Prof.Ramkrishna More College, Akurdi, Pune (Affiliated to SPPU-PUNE); Mob.-+91 9370333535ajkhandagle@gmail.com 7
PROTEIN ESTIMATION BY LOWRY METHOD
Experimental Set up:
Concentration of Standard Protein (BSA) = 100 µg/ml
PDEA’s Prof.Ramkrishna More College, Akurdi, Pune (Affiliated to SPPU-PUNE); Mob.-+91 9370333535ajkhandagle@gmail.com 8
Test
Tube
Vol of Std.
BSA (ml)
Conc of
BSA
(µg)
Vol of
Water
(ml)
Vol of
Alk.copper
sulphate –
Reagent C ml)
Incubate
@ RT
Vol of FCR
Reagent
(ml)
Incubate
@ RT in
Dark
A660nm
1 0.0 (blank) 0.0 2.0 4 10 Min 0.5 30 Min
2 0.2 20 1.8 4 10 Min 0.5 30 Min
3 0.4 40 1.6 4 10 Min 0.5 30 Min
4 0.6 60 1.4 4 10 Min 0.5 30 Min
5 0.8 80 1.2 4 10 Min 0.5 30 Min
6 1.0 100 1.0 4 10 Min 0.5 30 Min
7 1.2 120 0.8 4 10 Min 0.5 30 Min
Set up for Sample
S-1 1.0 ? 1.0 4 10 Min 0.5 30 Min
S-2 1.0 ? 1.0 4 10 Min 0.5 30 Min
How to plot the graph…
• To determine the total protein concentration using graph paper plot.
1. Plot the values of protein concentrations on X axis and the values of
absorbance on Y axis of a graph paper.
2. Construct a straight line through the points representing the values of
absorbance drawn on the paper.
3. From the absorbance value of the Unknown Protein drop a perpendicular on
the X axis and find the protein concentration for the unknown.
PDEA’s Prof.Ramkrishna More College, Akurdi, Pune (Affiliated to SPPU-PUNE); ajkhandagle@gmail.com Mob.-+91 9370333535
9
How to plot the graph…
• Determine the protein concentration using Microsoft Excel
• Enter the BSA standard concentration and absorbance value in 2 columns .
• select the data in the two columns
• From the menu bar, choose Insert then Chart.
• For Chart type sele t: XY S atter
• GO to Chart elements to select Axis titles, data labels, legend and Trendline
• Click Trendline to select equation and R-squared on chart
• Using the equation get the concentration of the sample
PDEA’s Prof.Ramkrishna More College, Akurdi, Pune (Affiliated to SPPU-PUNE); ajkhandagle@gmail.com Mob.-+91 9370333535
10
PROTEIN ESTIMATION BY LOWRY METHOD
PDEA’s Prof.Ramkrishna More College, Akurdi, Pune (Affiliated to SPPU-PUNE); Mob.-+91 9370333535ajkhandagle@gmail.com 11
Calculations:
A)A of sample/ A of Standard X Conc of Standard = ------------- µg/ml
A)Calculate by Graph using the standard curve = ------------- µg/ml
Result: The concentration of protein in the given unknown sample is
_____________ mg/ml.
References:
PDEA’s Prof.Ramkrishna More College, Akurdi, Pune (Affiliated to SPPU-PUNE); Mob.-+91 9370333535
ajkhandagle@gmail.com
12
Lowry, OH; Rosebrough, NJ; Farr, AL; Randall, RJ (1951). "Protein measurement with the
Folin phenol reagent". Journal of Biological Chemistry. 193 (1): 265–75.
THANK
YOU
PDEA’s Prof.Ramkrishna More College, Akurdi, Pune (Affiliated to SPPU-PUNE); Mob.-+91 9370333535
ajkhandagle@gmail.com
13

Lowry method for protein estimation

  • 1.
    BIOCHEMISTRY LAB Title: TotalProtein Estimation by Lowry Method Dr. Abhay Khandagle Head, Postgraduate Department and Research Centre in Zoology Prof. Ramkrishna More Arts, Commerce & Science College INDIA PDEA’s Prof.Ramkrishna More College, Akurdi, Pune (Affiliated to SPPU-PUNE); Mob.-+91 9370333535ajkhandagle@gmail.com 1
  • 2.
    Objectives • To deteri e the o e tratio of protei s y Lowry’s method. • To prepare the required lab reagents. • To construct standard graph on paper. • To develop standard graph with Spreadsheet. PDEA’s Prof.Ramkrishna More College, Akurdi, Pune (Affiliated to SPPU-PUNE); ajkhandagle@gmail.com Mob.-+91 9370333535 2
  • 3.
    PROTEIN ESTIMATION BYLOWRY METHOD Introduction: Lowry’s assay for total protein estimation is one of the most commonly used colorimetric assays. The Biochemist Oliver H. Lowry developed the reagent in the 1940s. His publication on the same in the year1951 was highly cited and has been used in protein labs. Principle: The principle of this method is based on two reactions leading to colour complex formation. Firstly, the Biuret reaction in which Cu2+ of the reaction mixture reacts with the peptide bond of proteins under alkaline conditions resulting in their reduction to cuprous ions (Cu+), and Lowry’s reaction in which the Folin Ciocaltaeu reagent, which contains phosphomolybdic complex which is a mixture of sodium tungstate, sodium molybdate and phosphate, along with copper sulphate solution and the protein forms a blue purple colour which can be assessed by measuring the absorbance at 650-700nm. The phenolic group of the aminoacid (tyrosine and tryptophan) residues will produce a blue purple colour due to the reduction of phosphomolybdotungstate to hetero-polymolybdenum blue by the copper catalysed oxidation of the amino acids and its intensity depends on the amount of these aromatic amino acids present. The blue purple colour formed thus differ from protein to protein.The blue purple color is formed of aromatic amino acids tryptophan and tyrosine. The reaction is pH dependent and works best in alkaline conditions with pH between 9 and 10.5 PDEA’s Prof.Ramkrishna More College, Akurdi, Pune (Affiliated to SPPU-PUNE); Mob.-+91 9370333535ajkhandagle@gmail.com 3
  • 4.
    PROTEIN ESTIMATION BYLOWRY METHOD PDEA’s Prof.Ramkrishna More College, Akurdi, Pune (Affiliated to SPPU-PUNE); Mob.-+91 9370333535ajkhandagle@gmail.com 4
  • 5.
    PROTEIN ESTIMATION BYLOWRY METHOD Advantages It is a sensitive assay which requires no digestion of protein. It is 10 or 20 times more sensitive as compared with ultraviolet absorption at 280 nm. It is more specific and less interrupted by turbidity, It is significantly more sensitive than the ninhydrin reaction and biuret reaction. It is simple to perform and can be easily used on small scale in the labs. Disadvantages The amount of colour developed differs from protein to protein, It is less constant than the biuret reaction, but more constant than the absorption at 280 nm. The color is not exactingly proportional to concentration. Applications: It is used in measurement of protein during enzyme fractionations, mixed tissue proteins, measurement of very small absolute amounts of protein, or highly diluted protein and analyses of large numbers of similar protein samples. PDEA’s Prof.Ramkrishna More College, Akurdi, Pune (Affiliated to SPPU-PUNE); Mob.-+91 9370333535ajkhandagle@gmail.com 5
  • 6.
    PROTEIN ESTIMATION BYLOWRY METHOD Reagents for Lowry method: Lowry Reagent (or) alkaline copper sulfate solution: Mix 50ml of solution A with 1 ml of solution B, just prior to use. Solution A : 2% sodium carbonate in 0.1N NaOH. Solution B : 0.5% copper sulfate solution in 1% sodium potassium tartarate solution (to be prepared fresh) Folin-Ciocalteau reagent: This is commercially available and has to be diluted with equal volume of water just before use. Standard protein solution: Dissolve 10mg of BSA (as it is easily available, cheap and with improved purity) in 100ml of distilled water in a volumetric flask. (for concentration-100 µg/ml) PDEA’s Prof.Ramkrishna More College, Akurdi, Pune (Affiliated to SPPU-PUNE); Mob.-+91 9370333535ajkhandagle@gmail.com 6
  • 7.
    PROTEIN ESTIMATION BYLOWRY METHOD Procedure: Pipette out into clean glass tubes 0.2, 0.4, 0.6, 0.8, and 1.0 of the protein solution and make up the total volume to 2ml with addition of distilled water. To each tube add 4ml of the alkaline-copper sulfate solution (Reagent C), mix well and allow to stand at room temperature for 10 minutes. Pipette out 0.5ml of the FCR reagent and add into each tube, mix immediately after each addition. Allow the tubes to stand for 30 minutes. Measure the Absorbance of the blue Purple color formed at 660nm. Prepare a blank tube with 2 ml of distilled water(instead of the standard protein) followed by all additions mentioned above and with 1ml of unknown solution (Sample) and perform the additions as in case of the standards. Prepare a calibration curve with mg of protein on X-axis and O.D. (A660nm) on Y-axis and determine the amount of protein present in a given unknown sample. PDEA’s Prof.Ramkrishna More College, Akurdi, Pune (Affiliated to SPPU-PUNE); Mob.-+91 9370333535ajkhandagle@gmail.com 7
  • 8.
    PROTEIN ESTIMATION BYLOWRY METHOD Experimental Set up: Concentration of Standard Protein (BSA) = 100 µg/ml PDEA’s Prof.Ramkrishna More College, Akurdi, Pune (Affiliated to SPPU-PUNE); Mob.-+91 9370333535ajkhandagle@gmail.com 8 Test Tube Vol of Std. BSA (ml) Conc of BSA (µg) Vol of Water (ml) Vol of Alk.copper sulphate – Reagent C ml) Incubate @ RT Vol of FCR Reagent (ml) Incubate @ RT in Dark A660nm 1 0.0 (blank) 0.0 2.0 4 10 Min 0.5 30 Min 2 0.2 20 1.8 4 10 Min 0.5 30 Min 3 0.4 40 1.6 4 10 Min 0.5 30 Min 4 0.6 60 1.4 4 10 Min 0.5 30 Min 5 0.8 80 1.2 4 10 Min 0.5 30 Min 6 1.0 100 1.0 4 10 Min 0.5 30 Min 7 1.2 120 0.8 4 10 Min 0.5 30 Min Set up for Sample S-1 1.0 ? 1.0 4 10 Min 0.5 30 Min S-2 1.0 ? 1.0 4 10 Min 0.5 30 Min
  • 9.
    How to plotthe graph… • To determine the total protein concentration using graph paper plot. 1. Plot the values of protein concentrations on X axis and the values of absorbance on Y axis of a graph paper. 2. Construct a straight line through the points representing the values of absorbance drawn on the paper. 3. From the absorbance value of the Unknown Protein drop a perpendicular on the X axis and find the protein concentration for the unknown. PDEA’s Prof.Ramkrishna More College, Akurdi, Pune (Affiliated to SPPU-PUNE); ajkhandagle@gmail.com Mob.-+91 9370333535 9
  • 10.
    How to plotthe graph… • Determine the protein concentration using Microsoft Excel • Enter the BSA standard concentration and absorbance value in 2 columns . • select the data in the two columns • From the menu bar, choose Insert then Chart. • For Chart type sele t: XY S atter • GO to Chart elements to select Axis titles, data labels, legend and Trendline • Click Trendline to select equation and R-squared on chart • Using the equation get the concentration of the sample PDEA’s Prof.Ramkrishna More College, Akurdi, Pune (Affiliated to SPPU-PUNE); ajkhandagle@gmail.com Mob.-+91 9370333535 10
  • 11.
    PROTEIN ESTIMATION BYLOWRY METHOD PDEA’s Prof.Ramkrishna More College, Akurdi, Pune (Affiliated to SPPU-PUNE); Mob.-+91 9370333535ajkhandagle@gmail.com 11 Calculations: A)A of sample/ A of Standard X Conc of Standard = ------------- µg/ml A)Calculate by Graph using the standard curve = ------------- µg/ml Result: The concentration of protein in the given unknown sample is _____________ mg/ml.
  • 12.
    References: PDEA’s Prof.Ramkrishna MoreCollege, Akurdi, Pune (Affiliated to SPPU-PUNE); Mob.-+91 9370333535 ajkhandagle@gmail.com 12 Lowry, OH; Rosebrough, NJ; Farr, AL; Randall, RJ (1951). "Protein measurement with the Folin phenol reagent". Journal of Biological Chemistry. 193 (1): 265–75.
  • 13.
    THANK YOU PDEA’s Prof.Ramkrishna MoreCollege, Akurdi, Pune (Affiliated to SPPU-PUNE); Mob.-+91 9370333535 ajkhandagle@gmail.com 13