Downloaded 19 times

![CTU: EE 331 - Circuit Analysis II: Lab 4: Simple AC Circuit 5
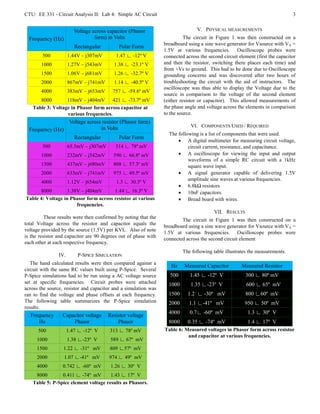
Voltage Amplitudes Phase Angles
Resistor Capacitor Resistor Capacitor
-4.4% -1.36 2.5% 16.66%
1.69% 2.17% -1.6% 0.45%
-0.99% -4.7% 4.71% 8.25
2.5% -3.5% 1.01% 2.25%
0% -7.5% 0.99% 0.671%
0% -4.98% -8.15 0.407%
Table 7: Percentage error results
IX. CONCLUSION
This lab was a success and was effective in
demonstrating the behavior of simple AC circuits at various
frequencies. It also was beneficial in demonstrating the power
and beauty of using Phasors and complex numbers to simplify
circuit analysis. The ability for RC circuits to act as band pass
filters is a powerful feature for engineers and will be
invaluable in work to come. Selective band pass filters are
critical in communication and digital systems and provides
most of the technology we have today. Using Phasor analysis
techniques instead of dealing with differential equations is a
tremendous relief.
Finally, the unexpected finding that only the second
circuit element could be measured at the same time as Vs due
to grounding issues with the oscilloscope was frustrating but
will be invaluable in future laboratory work.
REFERENCES
[1] R. E. Thomas, A. J. Rosa, and G. J. Toussaint, “The Analysis & Design
of Linear Circuits, sixth edition” John Wiley & Sons, Inc. Hoboken, NJ,
pp. 309, 2009.](https://image.slidesharecdn.com/lorenk-schwappach-ee331-lab4-120112073525-phpapp01/85/Loren-k-schwappach-ee331-lab-4-5-320.jpg)

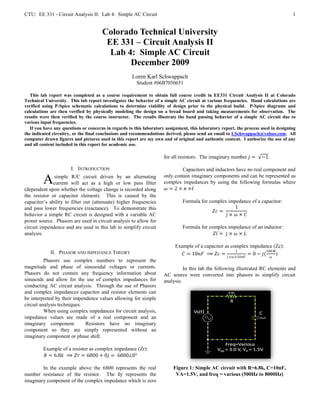
This lab report investigates the behavior of a simple AC circuit using a resistor and capacitor at various frequencies. Hand calculations using phasor analysis are performed and verified using PSpice simulations. The circuit is then built on a breadboard and measurements are taken with an oscilloscope. The results show the band passing behavior of the circuit due to different input frequencies, with higher frequencies being attenuated by the capacitor.