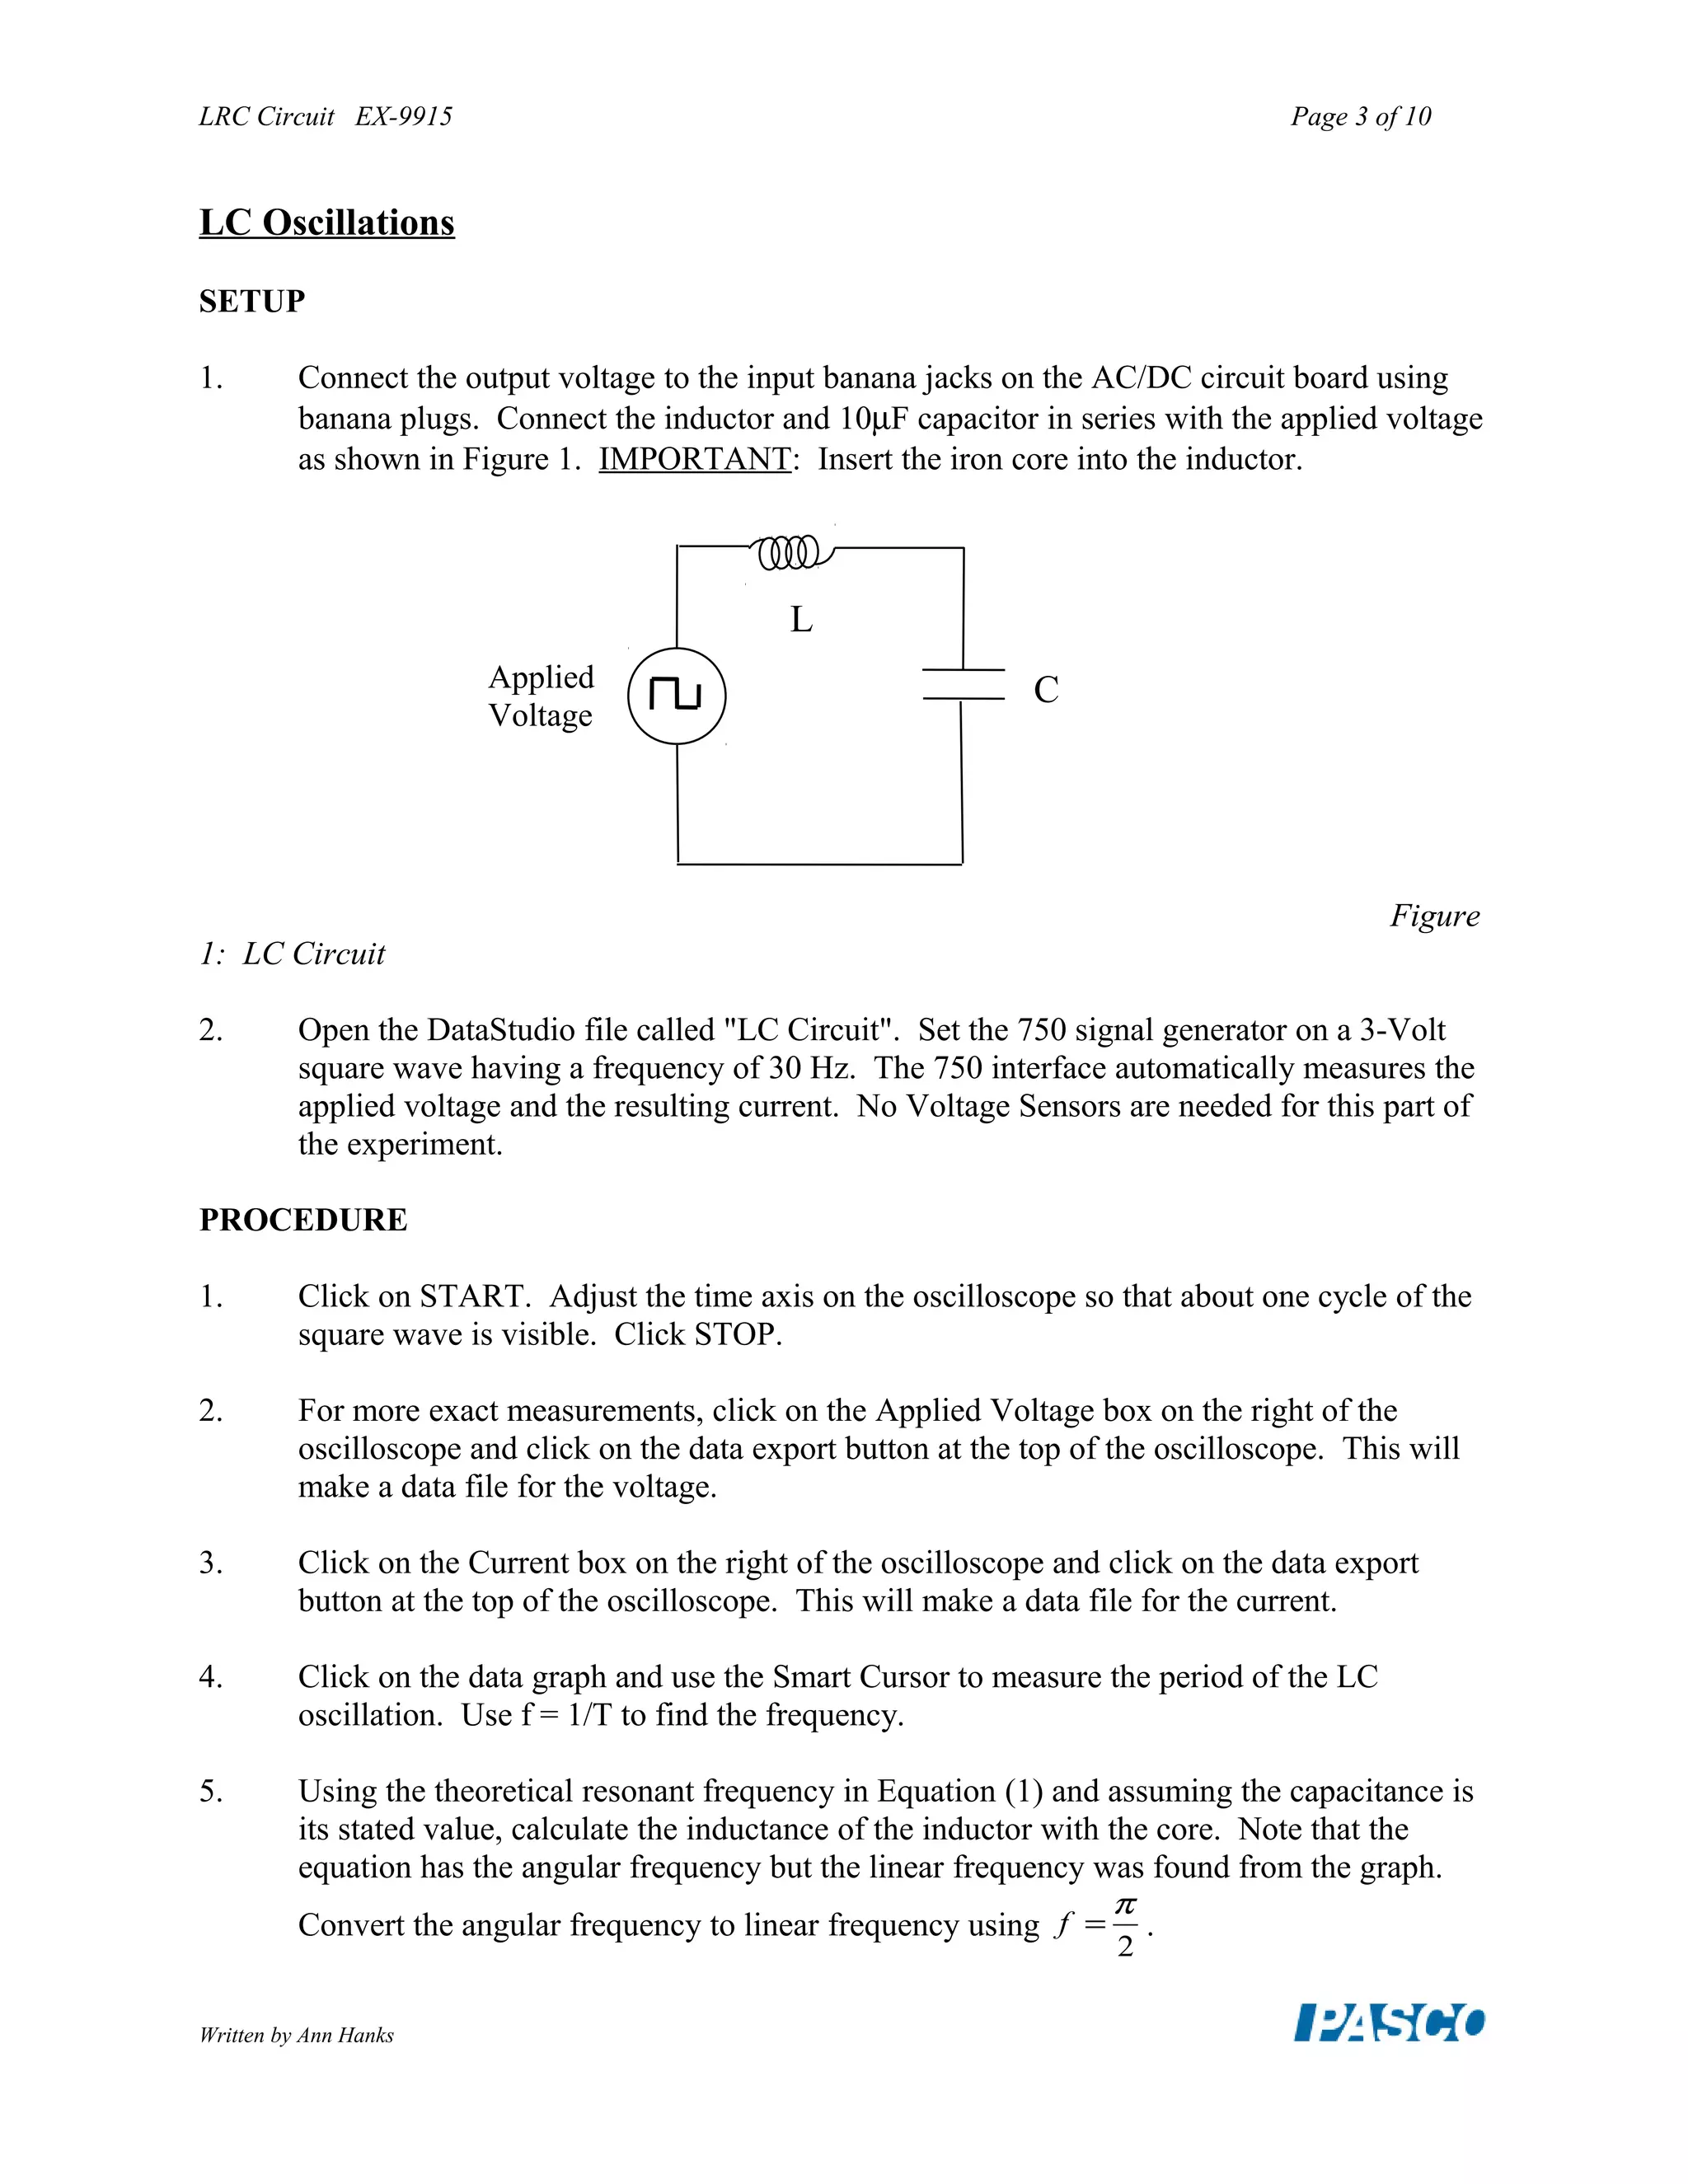
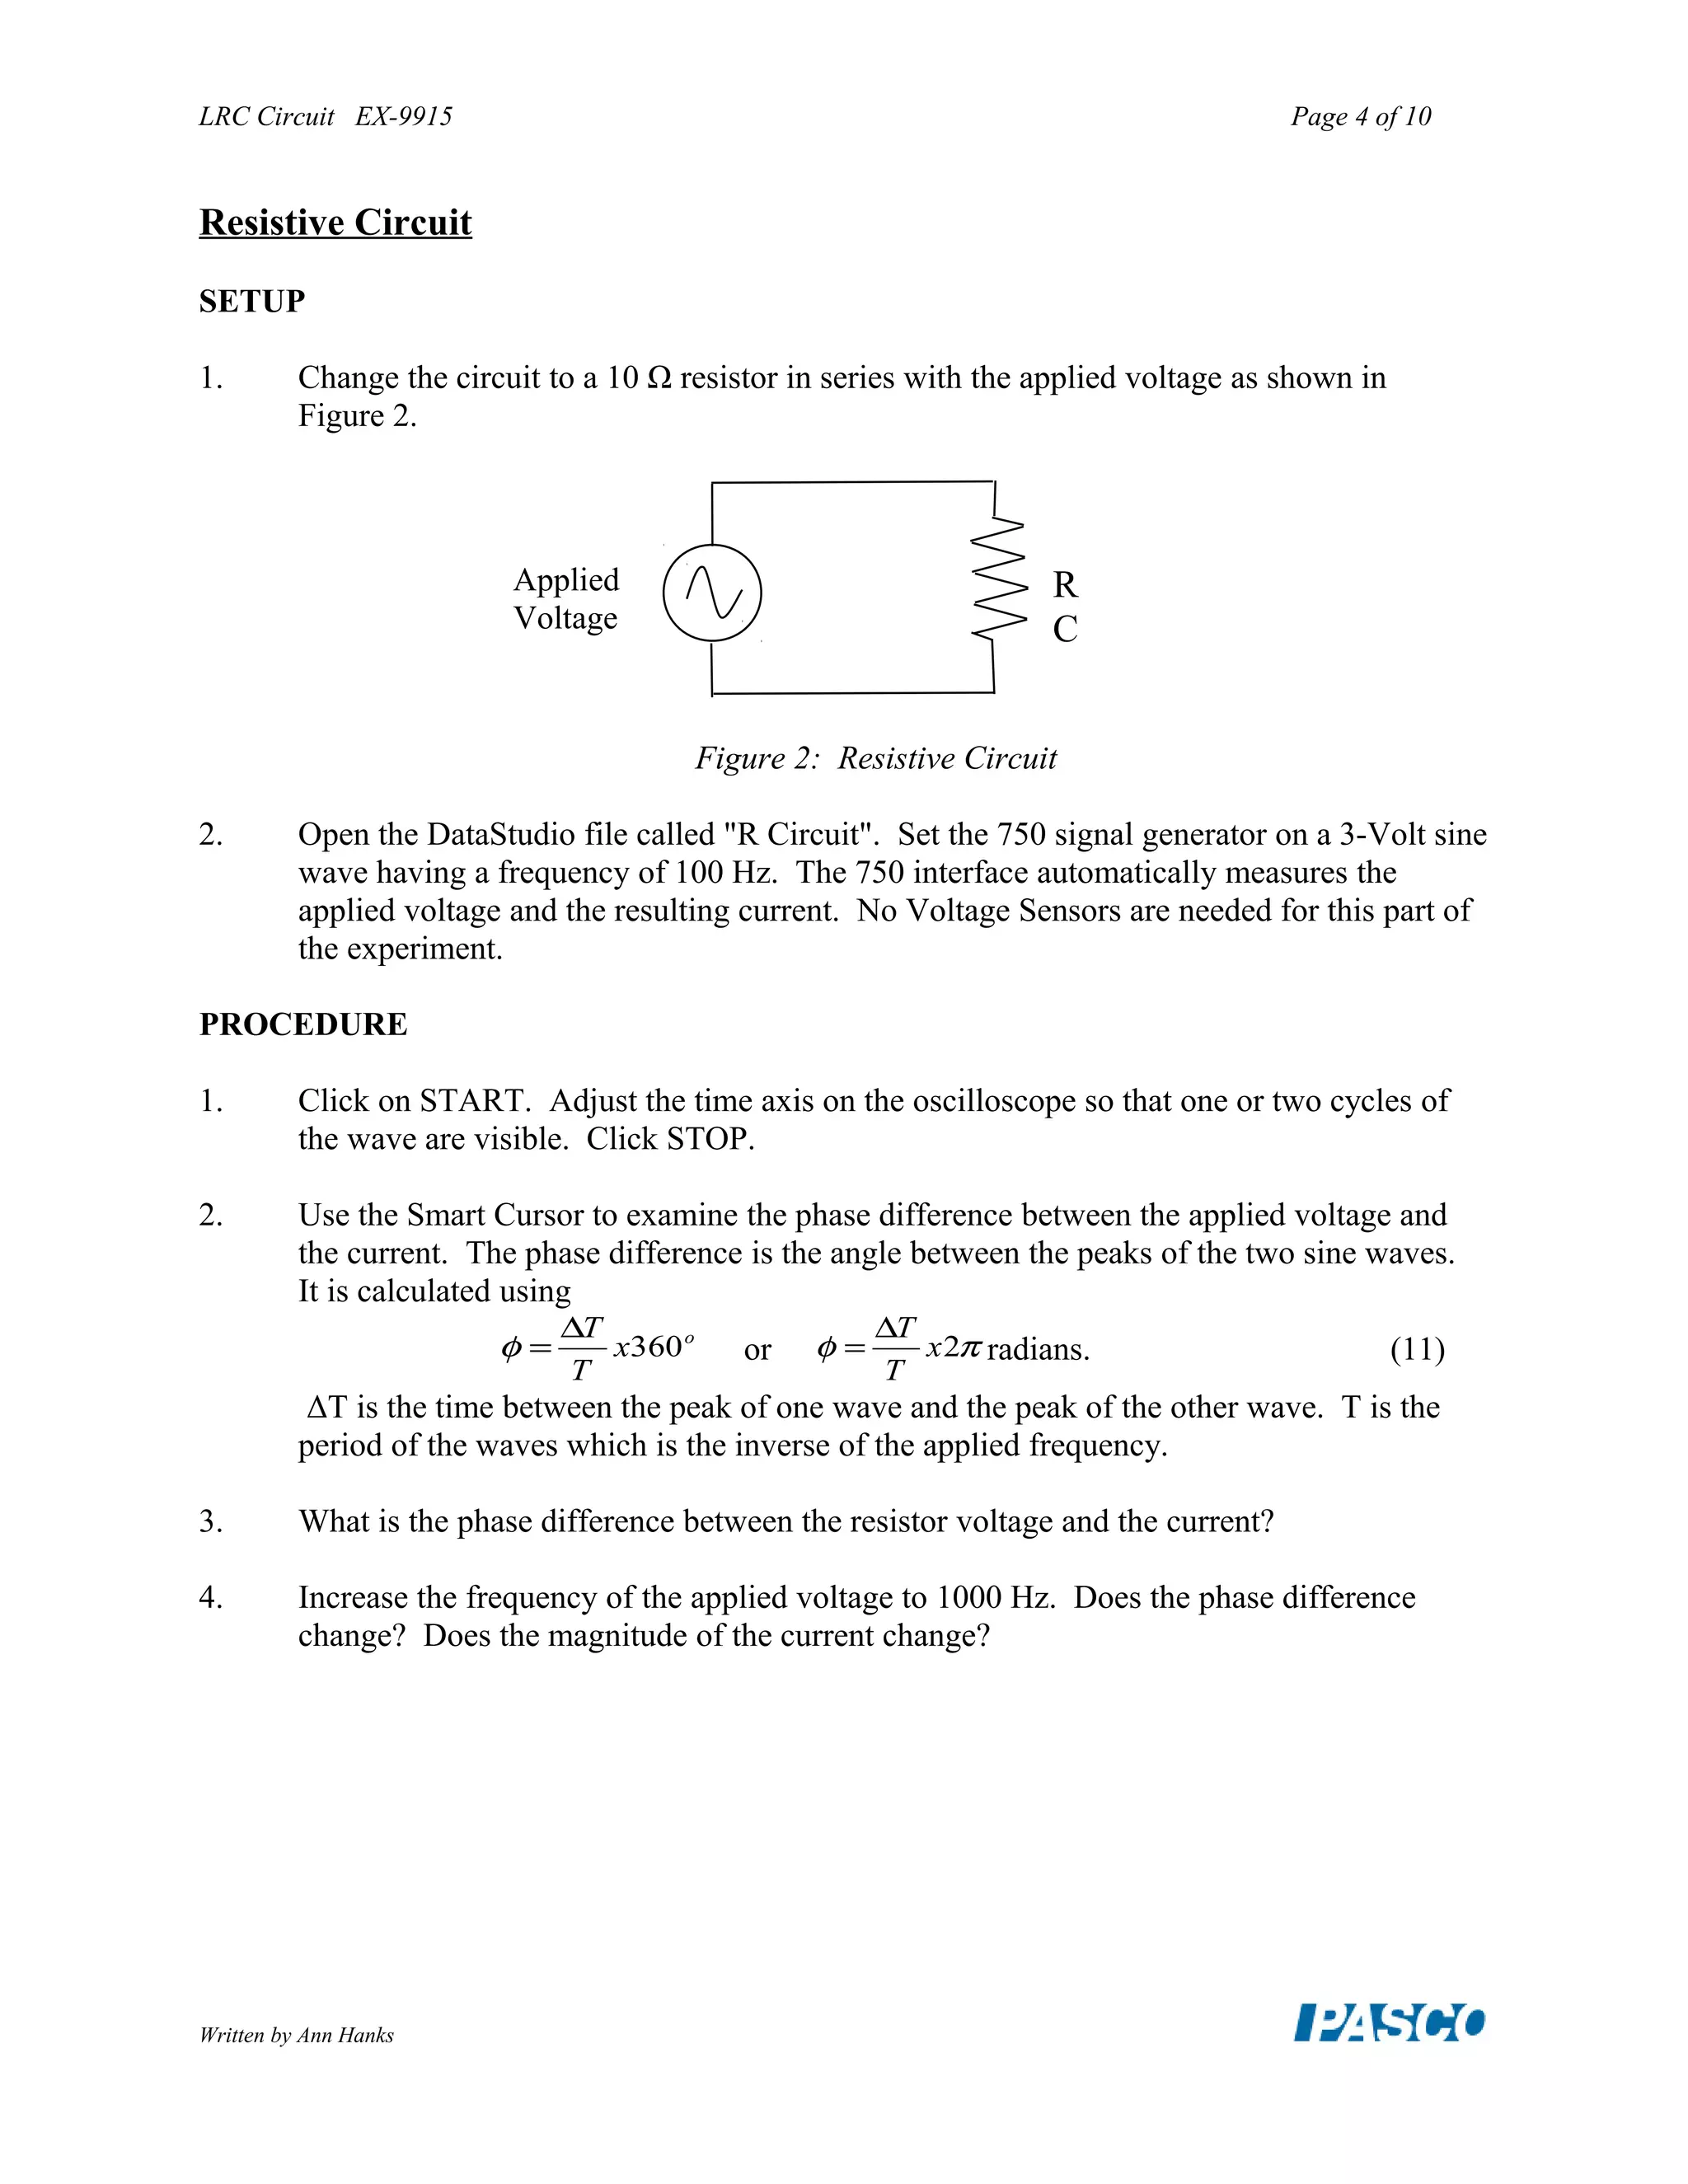
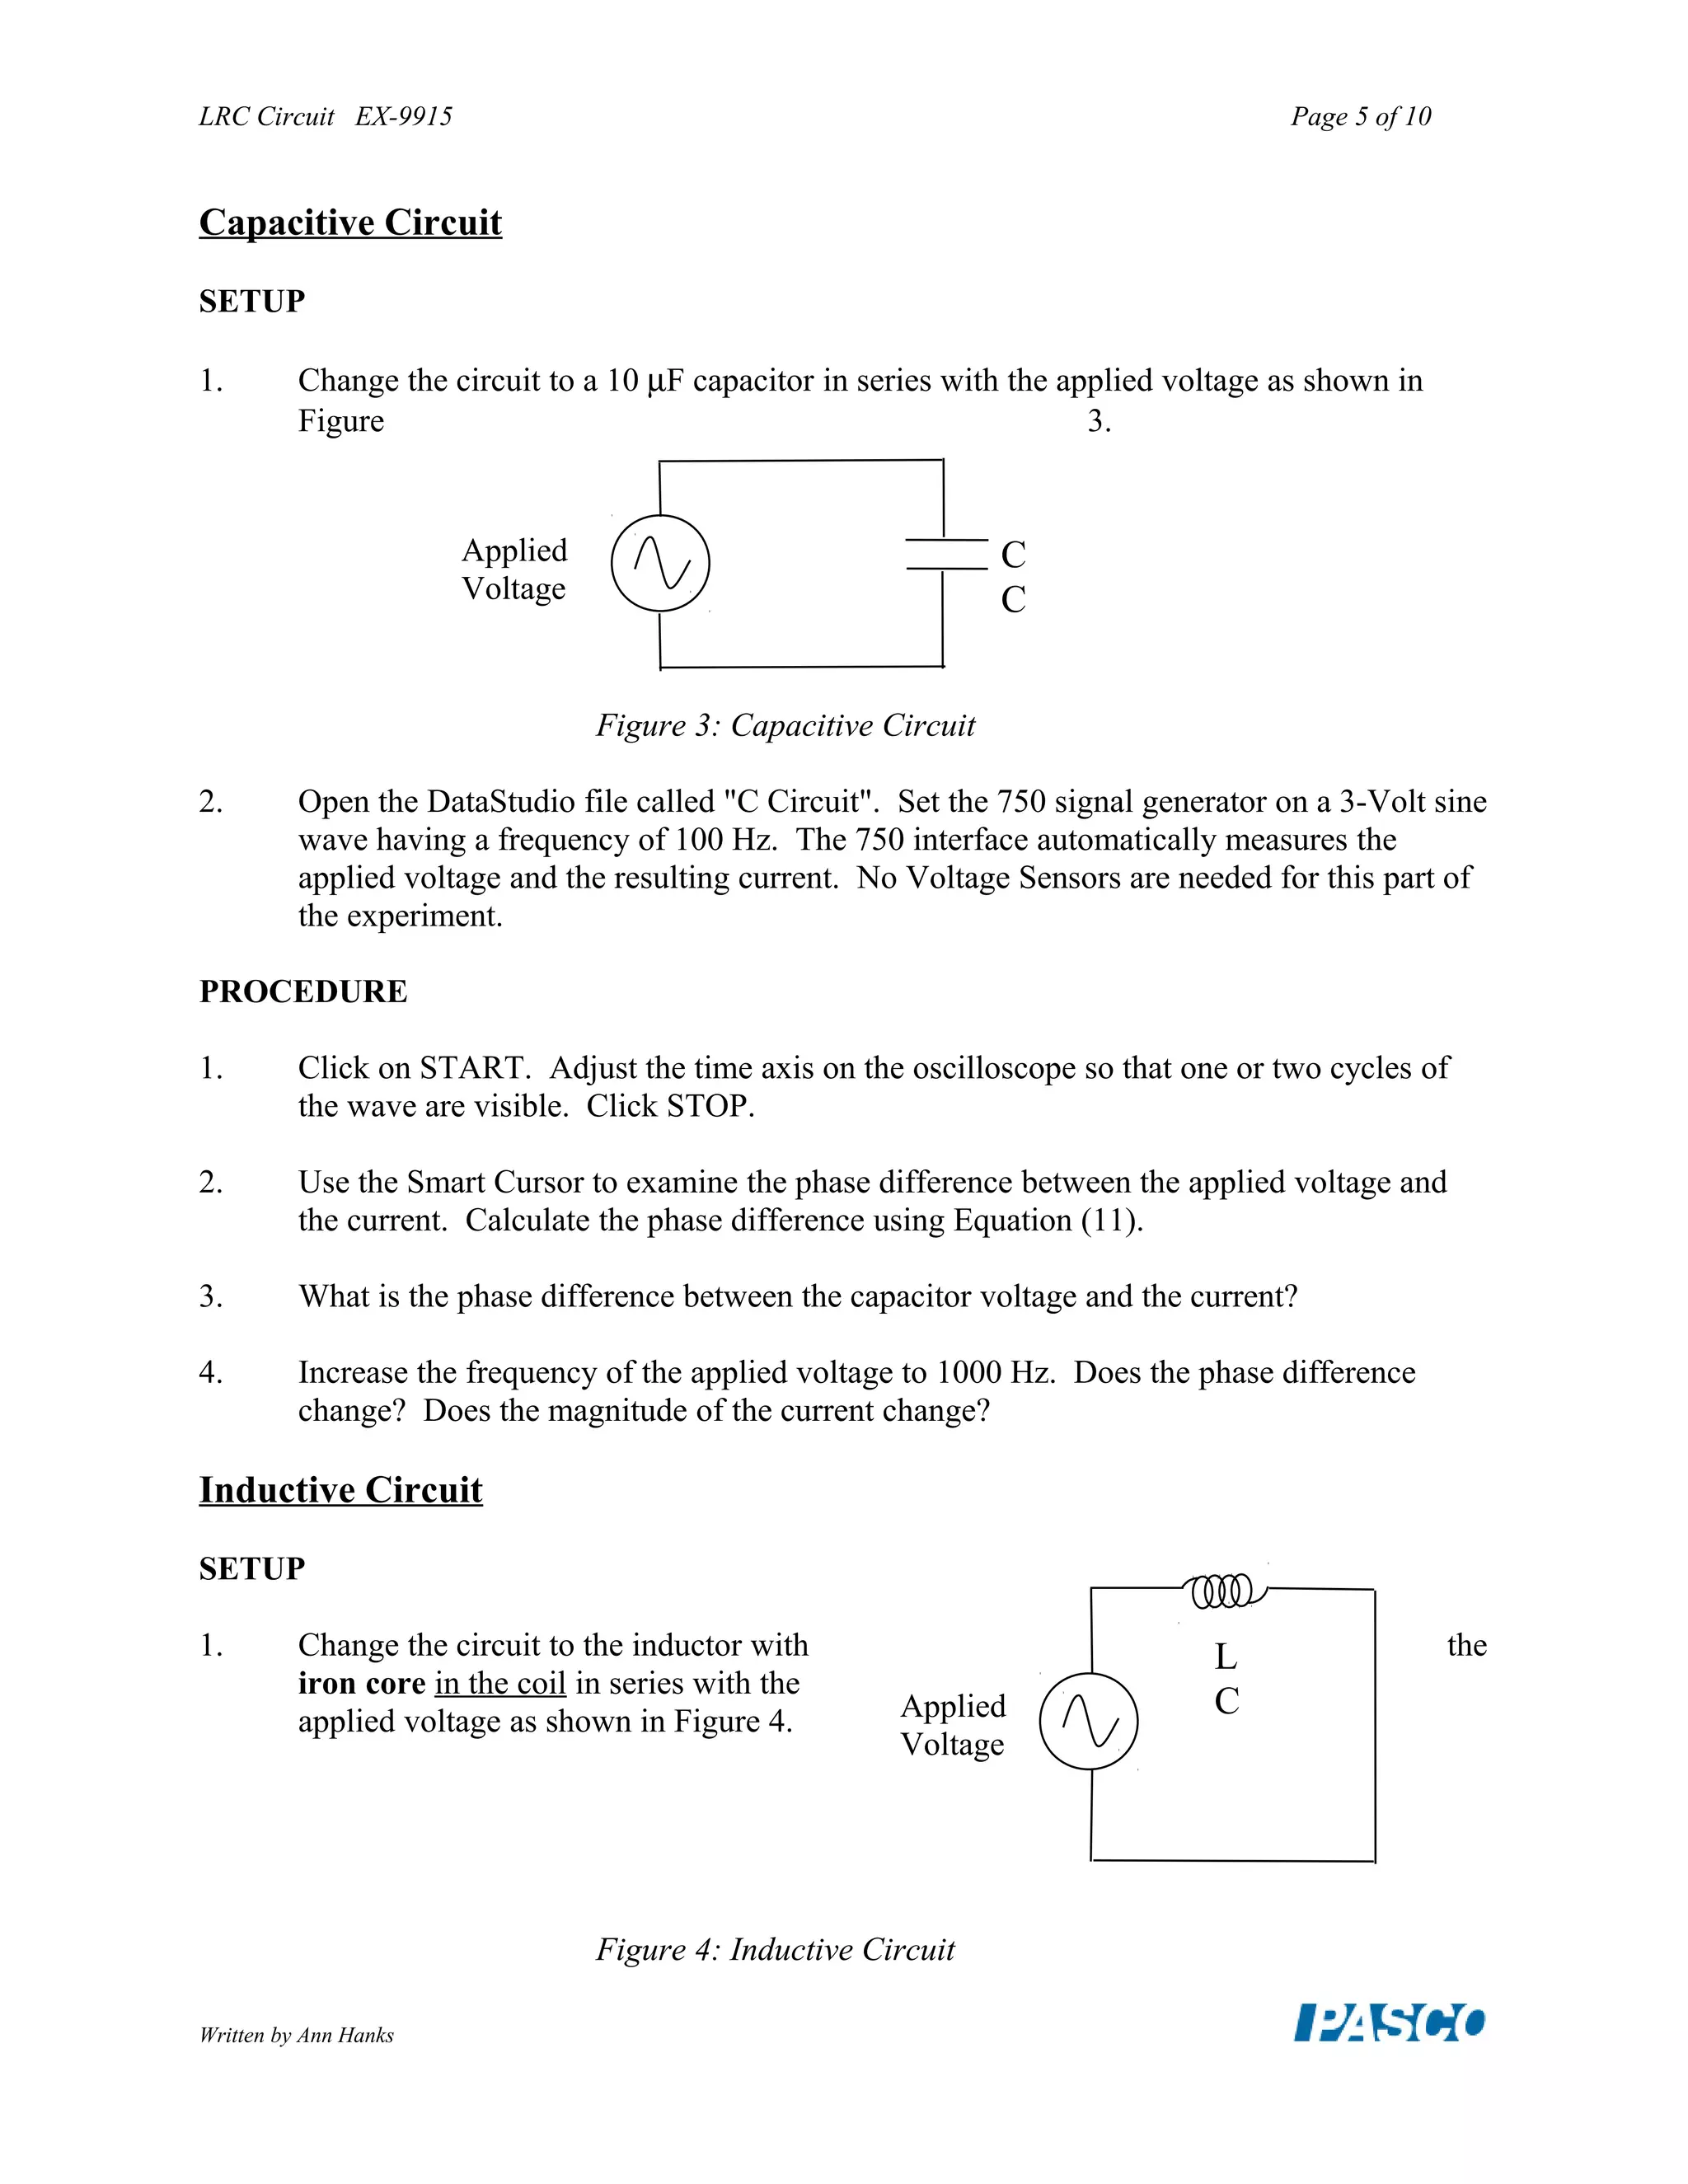
This document describes an experiment involving measuring voltages and currents in various AC circuits containing resistors, capacitors, and inductors. Key points:
1) An LC circuit is used to measure the resonant frequency and calculate the inductance. Current and voltage relationships are examined for resistive, capacitive, and inductive circuits individually.
2) Current and voltage measurements are taken for an LRC circuit as the frequency is varied to observe the resonance curve. Peak current frequency agrees with theoretical LC resonance frequency.
3) Voltage sensors are added to an LRC circuit to measure voltages across each component and verify Kirchhoff's loop rule and theoretical phase relationships.
Electrical Technology Notes for preparation.
Kindly note :- Don't forget to use class note book while studying.
Use my theory questions to clear ET and solved all the problems.
Electrical Engineering is the Branch of Engineering. Electrical Engineering field requires an understanding of core areas including Thermal and Hydraulics Prime Movers, Analog Electronic Circuits, Network Analysis and Synthesis, DC Machines and Transformers, Digital Electronic Circuits, Fundamentals of Power Electronics, Control System Engineering, Engineering Electromagnetics, Microprocessor and Microcontroller. Ekeeda offers Online Mechanical Engineering Courses for all the Subjects as per the Syllabus. Visit : https://ekeeda.com/streamdetails/stream/Electrical-and-Electronics-Engineering
Electrical Engineering is the Branch of Engineering. Electrical Engineering field requires an understanding of core areas including Thermal and Hydraulics Prime Movers, Analog Electronic Circuits, Network Analysis and Synthesis, DC Machines and Transformers, Digital Electronic Circuits, Fundamentals of Power Electronics, Control System Engineering, Engineering Electromagnetics, Microprocessor and Microcontroller. Ekeeda offers Online Mechanical Engineering Courses for all the Subjects as per the Syllabus Visit : https://ekeeda.com/streamdetails/stream/Electrical-Engineering
This is the experiment for undergraduate science and engineering students in the subjects of Physics, Applied Physics, Basic electronics etc. The experiment is explained in detail so that the students and faculty member can get the better knowledge of the experiment.
Embracing GenAI - A Strategic ImperativePeter Windle
Artificial Intelligence (AI) technologies such as Generative AI, Image Generators and Large Language Models have had a dramatic impact on teaching, learning and assessment over the past 18 months. The most immediate threat AI posed was to Academic Integrity with Higher Education Institutes (HEIs) focusing their efforts on combating the use of GenAI in assessment. Guidelines were developed for staff and students, policies put in place too. Innovative educators have forged paths in the use of Generative AI for teaching, learning and assessments leading to pockets of transformation springing up across HEIs, often with little or no top-down guidance, support or direction.
This Gasta posits a strategic approach to integrating AI into HEIs to prepare staff, students and the curriculum for an evolving world and workplace. We will highlight the advantages of working with these technologies beyond the realm of teaching, learning and assessment by considering prompt engineering skills, industry impact, curriculum changes, and the need for staff upskilling. In contrast, not engaging strategically with Generative AI poses risks, including falling behind peers, missed opportunities and failing to ensure our graduates remain employable. The rapid evolution of AI technologies necessitates a proactive and strategic approach if we are to remain relevant.
June 3, 2024 Anti-Semitism Letter Sent to MIT President Kornbluth and MIT Cor...Levi Shapiro
Letter from the Congress of the United States regarding Anti-Semitism sent June 3rd to MIT President Sally Kornbluth, MIT Corp Chair, Mark Gorenberg
Dear Dr. Kornbluth and Mr. Gorenberg,
The US House of Representatives is deeply concerned by ongoing and pervasive acts of antisemitic
harassment and intimidation at the Massachusetts Institute of Technology (MIT). Failing to act decisively to ensure a safe learning environment for all students would be a grave dereliction of your responsibilities as President of MIT and Chair of the MIT Corporation.
This Congress will not stand idly by and allow an environment hostile to Jewish students to persist. The House believes that your institution is in violation of Title VI of the Civil Rights Act, and the inability or
unwillingness to rectify this violation through action requires accountability.
Postsecondary education is a unique opportunity for students to learn and have their ideas and beliefs challenged. However, universities receiving hundreds of millions of federal funds annually have denied
students that opportunity and have been hijacked to become venues for the promotion of terrorism, antisemitic harassment and intimidation, unlawful encampments, and in some cases, assaults and riots.
The House of Representatives will not countenance the use of federal funds to indoctrinate students into hateful, antisemitic, anti-American supporters of terrorism. Investigations into campus antisemitism by the Committee on Education and the Workforce and the Committee on Ways and Means have been expanded into a Congress-wide probe across all relevant jurisdictions to address this national crisis. The undersigned Committees will conduct oversight into the use of federal funds at MIT and its learning environment under authorities granted to each Committee.
• The Committee on Education and the Workforce has been investigating your institution since December 7, 2023. The Committee has broad jurisdiction over postsecondary education, including its compliance with Title VI of the Civil Rights Act, campus safety concerns over disruptions to the learning environment, and the awarding of federal student aid under the Higher Education Act.
• The Committee on Oversight and Accountability is investigating the sources of funding and other support flowing to groups espousing pro-Hamas propaganda and engaged in antisemitic harassment and intimidation of students. The Committee on Oversight and Accountability is the principal oversight committee of the US House of Representatives and has broad authority to investigate “any matter” at “any time” under House Rule X.
• The Committee on Ways and Means has been investigating several universities since November 15, 2023, when the Committee held a hearing entitled From Ivory Towers to Dark Corners: Investigating the Nexus Between Antisemitism, Tax-Exempt Universities, and Terror Financing. The Committee followed the hearing with letters to those institutions on January 10, 202
How to Make a Field invisible in Odoo 17Celine George
It is possible to hide or invisible some fields in odoo. Commonly using “invisible” attribute in the field definition to invisible the fields. This slide will show how to make a field invisible in odoo 17.
Acetabularia Information For Class 9 .docxvaibhavrinwa19
Acetabularia acetabulum is a single-celled green alga that in its vegetative state is morphologically differentiated into a basal rhizoid and an axially elongated stalk, which bears whorls of branching hairs. The single diploid nucleus resides in the rhizoid.
Operation “Blue Star” is the only event in the history of Independent India where the state went into war with its own people. Even after about 40 years it is not clear if it was culmination of states anger over people of the region, a political game of power or start of dictatorial chapter in the democratic setup.
The people of Punjab felt alienated from main stream due to denial of their just demands during a long democratic struggle since independence. As it happen all over the word, it led to militant struggle with great loss of lives of military, police and civilian personnel. Killing of Indira Gandhi and massacre of innocent Sikhs in Delhi and other India cities was also associated with this movement.
Biological screening of herbal drugs: Introduction and Need for
Phyto-Pharmacological Screening, New Strategies for evaluating
Natural Products, In vitro evaluation techniques for Antioxidants, Antimicrobial and Anticancer drugs. In vivo evaluation techniques
for Anti-inflammatory, Antiulcer, Anticancer, Wound healing, Antidiabetic, Hepatoprotective, Cardio protective, Diuretics and
Antifertility, Toxicity studies as per OECD guidelines
Unit 8 - Information and Communication Technology (Paper I).pdfThiyagu K
This slides describes the basic concepts of ICT, basics of Email, Emerging Technology and Digital Initiatives in Education. This presentations aligns with the UGC Paper I syllabus.
2024.06.01 Introducing a competency framework for languag learning materials ...Sandy Millin
http://sandymillin.wordpress.com/iateflwebinar2024
Published classroom materials form the basis of syllabuses, drive teacher professional development, and have a potentially huge influence on learners, teachers and education systems. All teachers also create their own materials, whether a few sentences on a blackboard, a highly-structured fully-realised online course, or anything in between. Despite this, the knowledge and skills needed to create effective language learning materials are rarely part of teacher training, and are mostly learnt by trial and error.
Knowledge and skills frameworks, generally called competency frameworks, for ELT teachers, trainers and managers have existed for a few years now. However, until I created one for my MA dissertation, there wasn’t one drawing together what we need to know and do to be able to effectively produce language learning materials.
This webinar will introduce you to my framework, highlighting the key competencies I identified from my research. It will also show how anybody involved in language teaching (any language, not just English!), teacher training, managing schools or developing language learning materials can benefit from using the framework.
Francesca Gottschalk - How can education support child empowerment.pptxEduSkills OECD
Francesca Gottschalk from the OECD’s Centre for Educational Research and Innovation presents at the Ask an Expert Webinar: How can education support child empowerment?
Honest Reviews of Tim Han LMA Course Program.pptxtimhan337
Personal development courses are widely available today, with each one promising life-changing outcomes. Tim Han’s Life Mastery Achievers (LMA) Course has drawn a lot of interest. In addition to offering my frank assessment of Success Insider’s LMA Course, this piece examines the course’s effects via a variety of Tim Han LMA course reviews and Success Insider comments.
1. LRC Circuit EX-9915 Page 1 of 10
1LRC CIRCUIT
EQUIPMENT
INCLUDED:
1 AC/DC Electronics Laboratory EM-8656
3 Voltage Sensors CI-6503
NOT INCLUDED, BUT REQUIRED:
1 ScienceWorkshop 750 Interface CI-7650
1 DataStudio Software CI-6870
INTRODUCTION
A square wave voltage is applied to an LC circuit and the period of oscillation of the voltage
across the capacitor is measured and compared to the theoretical value. Then three AC circuits
are examined: A sinusoidal voltage is applied individually to a resistor, a capacitor, and an
inductor. The amplitude of the current and the phase difference between the applied voltage and
the current are measured in each of the three circuits to see the effect each component has on the
current. Finally, a sinusoidal voltage is applied to an inductor, resistor, and capacitor in series.
The amplitude of the current and the phase difference between the applied voltage and the
current are measured and compared to theory.
THEORY
LC Oscillations
A low frequency square wave voltage is applied to an inductor and capacitor series circuit. This
charges the capacitor. Then the capacitor discharges through the inductor and the voltage across
the capacitor oscillates at the resonant frequency of the LC circuit,
1
ω= . (1)
LC
Resistive Circuit
A resistive circuit is one in which the dominant component is resistance. In this experiment, a
voltage V = Vmaxsin(ωt) is applied to a resistor alone. The current, I, through the resistor is in
phase with the applied voltage:
I = Imaxsin(ωt) (2)
where the maximum current, Imax, is equal to Vmax/R. (3)
Written by Ann Hanks
2. LRC Circuit EX-9915 Page 2 of 10
Capacitive Circuit
A capacitive circuit is one in which the dominant component is capacitance. In this part of the
experiment, a voltage V = V maxsin(ωt) is applied to a capacitor alone. Since the voltage across
the capacitor is
Q
V = = V max sin(ωt )
C
where Q is the charge on the capacitor and C is the capacitance. Solving for Q and using
dQ
I = , the phase difference between the current through the capacitor and the applied voltage
dt
is π/2:
π
I = I max cos ωt = I max sinωt + (4)
2
Vmax 1
where I = and the capacitive reactance is χC = . (5)
χC ωC
Inductive Circuit
An inductive circuit is one in which the dominant component is inductance. In this part of the
experiment, a voltage V = V maxsin(ωt) is applied to an inductor alone. Note that the resistance of
the inductor is ignored in the theory. The voltage across the inductor is
dI
V =L = Vmax sin(ωt )
dt
where I is the current through the inductor and L is the inductance. Solving for I using
I = Ι( Vmax/L)sin(ωt)dt,
π
I = −I max cos ωt = I max sin ωt − (6)
2
Vmax
where I max = and the inductive reactance is χ L = ωL . (7)
χL
The phase difference between the current through the inductor and the applied voltage is -π/2.
LRC Circuit
A voltage V = V maxsin(ωt) is applied to an inductor, capacitor, and resistor in series. The
resulting current is given by
I = Imaxsin(ωt + φ) (8)
ξmax
where I max = and Z is the impedance, Z = R 2 + ( X C − X L ) 2 . (9)
Z
The phase constant (φ) is the phase difference between the current and applied voltage. Note that
with the sign convention used here, φ is positive when the current leads the emf (V).
XC − XL
tan φ = (10)
R
Written by Ann Hanks
3. LRC Circuit EX-9915 Page 3 of 10
LC Oscillations
SETUP
1. Connect the output voltage to the input banana jacks on the AC/DC circuit board using
banana plugs. Connect the inductor and 10µF capacitor in series with the applied voltage
as shown in Figure 1. IMPORTANT: Insert the iron core into the inductor.
L
Applied C
Voltage
Figure
1: LC Circuit
2. Open the DataStudio file called "LC Circuit". Set the 750 signal generator on a 3-Volt
square wave having a frequency of 30 Hz. The 750 interface automatically measures the
applied voltage and the resulting current. No Voltage Sensors are needed for this part of
the experiment.
PROCEDURE
1. Click on START. Adjust the time axis on the oscilloscope so that about one cycle of the
square wave is visible. Click STOP.
2. For more exact measurements, click on the Applied Voltage box on the right of the
oscilloscope and click on the data export button at the top of the oscilloscope. This will
make a data file for the voltage.
3. Click on the Current box on the right of the oscilloscope and click on the data export
button at the top of the oscilloscope. This will make a data file for the current.
4. Click on the data graph and use the Smart Cursor to measure the period of the LC
oscillation. Use f = 1/T to find the frequency.
5. Using the theoretical resonant frequency in Equation (1) and assuming the capacitance is
its stated value, calculate the inductance of the inductor with the core. Note that the
equation has the angular frequency but the linear frequency was found from the graph.
π
Convert the angular frequency to linear frequency using f = .
2
Written by Ann Hanks
4. LRC Circuit EX-9915 Page 4 of 10
Resistive Circuit
SETUP
1. Change the circuit to a 10 Ω resistor in series with the applied voltage as shown in
Figure 2.
Applied R
Voltage C
Figure 2: Resistive Circuit
2. Open the DataStudio file called "R Circuit". Set the 750 signal generator on a 3-Volt sine
wave having a frequency of 100 Hz. The 750 interface automatically measures the
applied voltage and the resulting current. No Voltage Sensors are needed for this part of
the experiment.
PROCEDURE
1. Click on START. Adjust the time axis on the oscilloscope so that one or two cycles of
the wave are visible. Click STOP.
2. Use the Smart Cursor to examine the phase difference between the applied voltage and
the current. The phase difference is the angle between the peaks of the two sine waves.
It is calculated using
∆T ∆T
φ= x360 o or φ= x 2π radians. (11)
T T
ΔT is the time between the peak of one wave and the peak of the other wave. T is the
period of the waves which is the inverse of the applied frequency.
3. What is the phase difference between the resistor voltage and the current?
4. Increase the frequency of the applied voltage to 1000 Hz. Does the phase difference
change? Does the magnitude of the current change?
Written by Ann Hanks
5. LRC Circuit EX-9915 Page 5 of 10
Capacitive Circuit
SETUP
1. Change the circuit to a 10 µF capacitor in series with the applied voltage as shown in
Figure 3.
Applied C
Voltage C
Figure 3: Capacitive Circuit
2. Open the DataStudio file called "C Circuit". Set the 750 signal generator on a 3-Volt sine
wave having a frequency of 100 Hz. The 750 interface automatically measures the
applied voltage and the resulting current. No Voltage Sensors are needed for this part of
the experiment.
PROCEDURE
1. Click on START. Adjust the time axis on the oscilloscope so that one or two cycles of
the wave are visible. Click STOP.
2. Use the Smart Cursor to examine the phase difference between the applied voltage and
the current. Calculate the phase difference using Equation (11).
3. What is the phase difference between the capacitor voltage and the current?
4. Increase the frequency of the applied voltage to 1000 Hz. Does the phase difference
change? Does the magnitude of the current change?
Inductive Circuit
SETUP
1. Change the circuit to the inductor with L the
iron core in the coil in series with the
applied voltage as shown in Figure 4. Applied C
Voltage
Figure 4: Inductive Circuit
Written by Ann Hanks
6. LRC Circuit EX-9915 Page 6 of 10
2. Open the DataStudio file called "L Circuit". Set the 750 signal generator on a 3-Volt sine
wave having a frequency of 1000 Hz. The 750 interface automatically measures the
applied voltage and the resulting current. No Voltage Sensors are needed for this part of
the experiment.
PROCEDURE
1. Click on START. Adjust the time axis on the oscilloscope so that one or two cycles of
the wave are visible. Click STOP.
2. Use the Smart Cursor to examine the phase difference between the applied voltage and
the current. Calculate the phase difference using Equation (11).
3. What is the phase difference between the inductor voltage and the current?
4. Decrease the frequency of the applied voltage to 100 Hz. Does the phase difference
change? Does the magnitude of the current change?
LRC Circuit
SETUP
1. Change the circuit to the inductor with the iron core in the coil, the 10 µF capacitor, and
the 10 Ω resistor in series with the applied voltage as shown in Figure 5.
L C
C
Applied R
Voltage C
Figure 5: LRC Circuit without Voltage Sensors
2. Open the DataStudio file called "Resonance Curve". Set the 750 signal generator on a 3-
Volt sine wave having a frequency of 20 Hz. The 750 interface automatically measures
the applied voltage and the resulting current. No Voltage Sensors are needed for this part
of the experiment.
Written by Ann Hanks
7. LRC Circuit EX-9915 Page 7 of 10
PROCEDURE
1. Click on START. Adjust the time axis on the oscilloscope so that one or two cycles of
the wave are visible. Allow the oscilloscope to run throughout this part of the
experiment.
2. Click on the Current box on the right of the oscilloscope and then use the Smart Cursor to
measure the maximum current. Enter the signal generator frequency and the maximum
current into the table labeled "10 Ohm".
3. Increase the signal generator frequency by 20 Hz and find the new current and record the
results in the table. Continue to increase the frequency by increments you choose by
watching the resulting resonance graph. If necessary, go back and take data points at
lower frequencies to fill in the resonance curve. If you go back, insert new rows into the
table at the appropriate points so the connecting line on the graph will connect the points
in order of frequency.
4. Continue until you reach 3000 Hz. Be sure you get enough data points around the peak.
5. Determine the frequency corresponding to the peak in the maximum current. Compare
this frequency to the theoretical resonance frequency given by Equation (1).
6. Measure the phase difference between the current and the applied voltage at a frequency
of 100 Hz, at 3000 Hz, and at the resonant frequency.
7. Replace the 10 Ω resistor with a 100 Ω resistor and repeat Steps 2 through 4. Take a
smaller number of data points for this resistor, concentrating on the lower frequencies,
the resonant frequency, and the higher frequencies so the general shape of the curve is
distinguished.
QUESTIONS
1. Does the frequency of the peak maximum current correspond to the frequency of the LC
oscillations? Does changing the resistance change the frequency of the peak?
2. Using Equation (9), calculate the theoretical peak current at resonance. Why is the actual
peak current at resonance less than the theoretical?
3. Why is the peak lower for the greater resistance?
4. Explain why the phase shifts are what they are at low frequency and at high frequency
and at the resonant frequency. In each case, does the current lead or lag the applied
voltage? To what value does the phase shift go as the frequency goes to zero or as it goes
to infinity? Which components dominate the circuit at these different frequencies?
Written by Ann Hanks
8. LRC Circuit EX-9915 Page 8 of 10
5. Draw phasor diagrams (approximately to scale) for 100 Hz, 3000 Hz, and the resonant
frequency.
LRC VOLTAGES
SETUP
1. Change the circuit to the inductor with the iron core in the coil, the 10 μF capacitor, and
the 10 Ω resistor in series with the applied voltage as shown in Figure 6. Add 3 Voltage
Sensors to the circuit: One across the inductor plugged into Channel A, one across the
capacitor plugged into Channel B, and one across the resistor plugged into Channel C.
Be careful to plug the sensors into the assigned channels on the interface and pay
attention to the polarity of each sensor.
Voltage Sensor
V
L
L C V Voltage
Sensor
C C
Applied
Voltage Voltage
R V Sensor
C R
Figure 6: LRC Circuit with Voltage Sensors
2. Open the DataStudio file called "LRC Voltages". Set the 750 signal generator on a 3-
Volt sine wave having a frequency of 200 Hz. The 750 interface automatically measures
the applied voltage and the resulting current.
Written by Ann Hanks
9. LRC Circuit EX-9915 Page 9 of 10
PROCEDURE
1. Click on START. Adjust the time axis on the oscilloscope so that one cycle of the waves
is visible. Click on STOP. Note that all the voltage scales are set at 1V/division so the
amplitudes of the voltages can be easily compared.
2. To compare the voltages in greater detail, the oscilloscope data must be exported to a
graph. To do this, click on the "Voltage across L" box on the right of the oscilloscope
and click on the data export button at the top of the oscilloscope. This will make a data
file for the voltage. Repeat this procedure for each of the boxes on the right of the
oscilloscope.
3. Drag each of the voltage data in the Data list at the left to a single graph.
4. Click the Lock button at the top of the graph to lock all the time axes together.
5. One by one, click on each of the Legends on the graph and then click on the Smart
Cursor at the top of the graph to turn on a cursor for each wave. Move the cursors so
they seek the data points in each wave and are locked into each other.
6. Place the cursor on the Applied Voltage on a point where the wave crosses the voltage
axis. For this particular time, read the voltages across the inductor, capacitor, and
resistor. Algebraically add these three voltages together. Does the sum equal the
Applied Voltage at that time? Does Kirchhoff's Loop Rule apply to AC circuits?
7. Using the cursors, determine the phase difference between the Applied Voltage and the
Current. Calculate the theoretical phase shift using Equation (10). Calculate the percent
difference between the measured and theoretical values.
8. Calculate the impedance at this frequency using Equation (9) and use it to calculate the
theoretical maximum current. Measure the maximum current on the graph and compare.
NOTE: If an ohmmeter is available, the resistance of the inductor can be measured and
included in the total resistance of the circuit for these calculations.
9. Measure the phase differences between the Applied Voltage and the voltages across each
component in the circuit (L, C, and R). Compare to theory.
QUESTIONS
1. How does the resistance of the inductor affect the phase difference between the current
and the applied voltage? Draw a phasor diagram which includes the fact that the voltage
across the inductor includes the resistance of the inductor.
2. Why is the measured phase difference for the capacitor and applied voltage the same as
theory while the phase for the inductor is not in agreement with theory?
Written by Ann Hanks
10. LRC Circuit EX-9915 Page 10 of 10
3. Why is the phase difference between the current and the resistor voltage zero?
4. Is this circuit being driven at resonance, or below resonance, or above resonance? How
do you know? Give at least two reasons.
Written by Ann Hanks
11. LRC Circuit EX-9915 Page 10 of 10
3. Why is the phase difference between the current and the resistor voltage zero?
4. Is this circuit being driven at resonance, or below resonance, or above resonance? How
do you know? Give at least two reasons.
Written by Ann Hanks
12. LRC Circuit EX-9915 Page 10 of 10
3. Why is the phase difference between the current and the resistor voltage zero?
4. Is this circuit being driven at resonance, or below resonance, or above resonance? How
do you know? Give at least two reasons.
Written by Ann Hanks