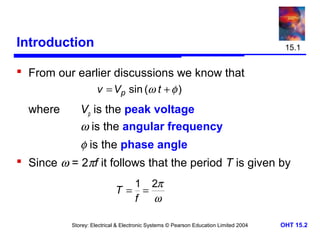
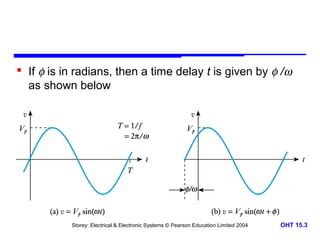
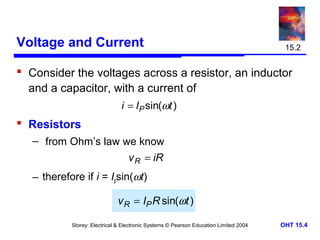
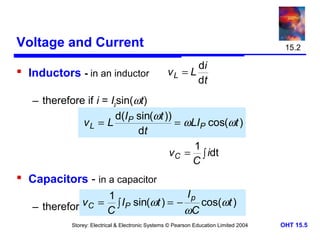
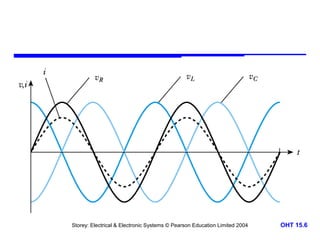
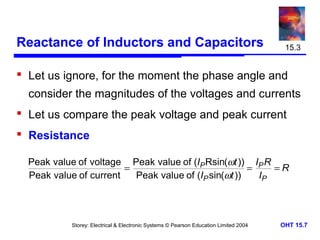
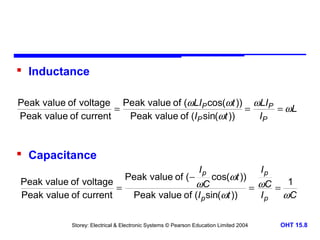
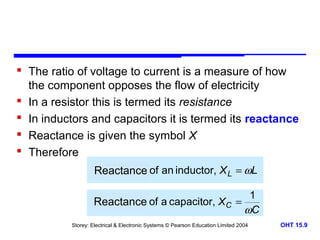
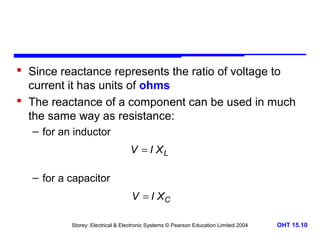
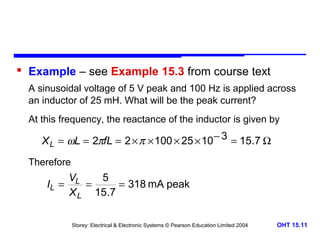
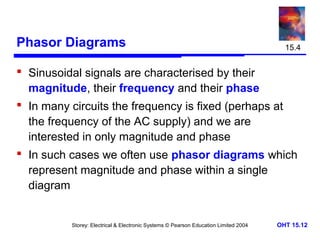
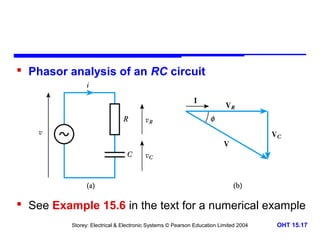
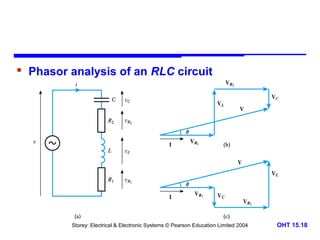
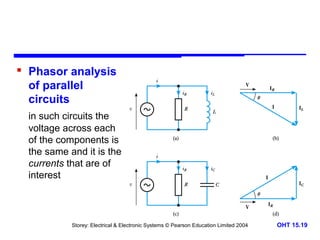
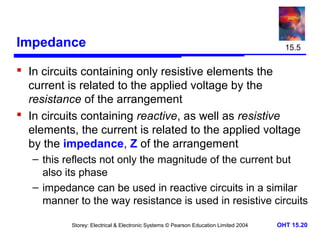
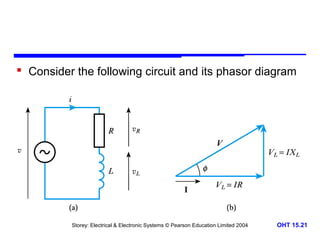
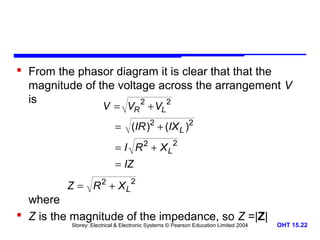
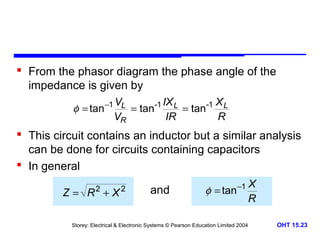
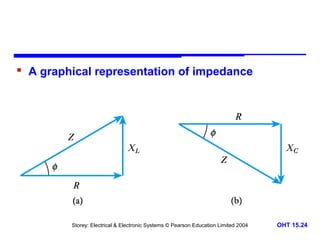
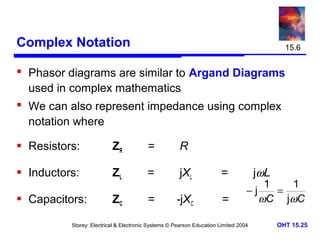
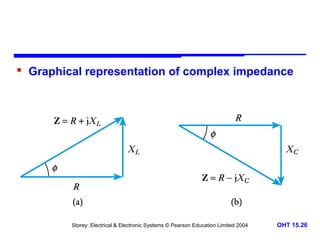
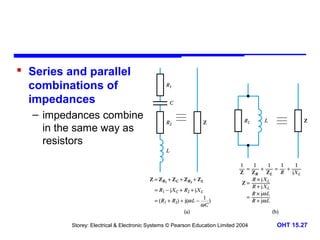
Alternating Voltages and Currents

Chapter 15

 Introduction
 Voltage and Current
 Reactance of Inductors and Capacitors
 Phasor Diagrams
 Impedance
 Complex Notation

Storey: Electrical & Electronic Systems © Pearson Education Limited 2004

OHT 15.1
Introduction

15.1

 From our earlier discussions we know that
v = Vp sin (ω t + φ )
where

Vp is the peak voltage
ω is the angular frequency

φ is the phase angle
 Since ω = 2πf it follows that the period T is given by
T =

1 2π
=
f
ω

Storey: Electrical & Electronic Systems © Pearson Education Limited 2004

OHT 15.2
 If φ is in radians, then a time delay t is given by φ /ω
as shown below

Storey: Electrical & Electronic Systems © Pearson Education Limited 2004

OHT 15.3
Voltage and Current

15.2

 Consider the voltages across a resistor, an inductor
and a capacitor, with a current of
i = IP sin(ωt )

 Resistors
– from Ohm’s law we know
v R = iR

– therefore if i = Ipsin(ωt)

v R = IP R sin(ωt )
Storey: Electrical & Electronic Systems © Pearson Education Limited 2004

OHT 15.4
Voltage and Current
 Inductors - in an inductor

15.2

di
vL = L
dt

– therefore if i = Ipsin(ωt)
d(I sin(ωt ))
vL = L P
= ωLIP cos(ωt )
dt
1
v C = ∫ idt
C

 Capacitors - in a capacitor
Ip
1
v if = I ∫ IP sin
– therefore C i= Cpsin(ωt)(ωt ) = − ωC cos(ωt )
Storey: Electrical & Electronic Systems © Pearson Education Limited 2004

OHT 15.5
Storey: Electrical & Electronic Systems © Pearson Education Limited 2004

OHT 15.6
Reactance of Inductors and Capacitors

15.3

 Let us ignore, for the moment the phase angle and
consider the magnitudes of the voltages and currents
 Let us compare the peak voltage and peak current
 Resistance
Peak value of voltage Peak value of (IP Rsin(ωt )) IP R
=
=
=R
Peak value of current
Peak value of (IP sin(ωt ))
IP

Storey: Electrical & Electronic Systems © Pearson Education Limited 2004

OHT 15.7
 Inductance
Peak value of voltage Peak value of (ωLIP cos(ωt )) ωLIP
=
=
= ωL
Peak value of current
Peak value of (IP sin(ωt ))
IP

 Capacitance
Peak value of voltage
=
Peak value of current

Peak value of ( −

Ip

cos(ωt ))

ωC
Peak value of (I p sin(ωt ))

Storey: Electrical & Electronic Systems © Pearson Education Limited 2004

Ip

1
= ωC =
Ip
ωC
OHT 15.8
 The ratio of voltage to current is a measure of how
the component opposes the flow of electricity
 In a resistor this is termed its resistance
 In inductors and capacitors it is termed its reactance
 Reactance is given the symbol X
 Therefore
Re ac tan ce of an inductor, X L = ωL
Reactance
1
Re ac tan ce of a capacitor, X C =
Reactance
ωC
Storey: Electrical & Electronic Systems © Pearson Education Limited 2004

OHT 15.9
 Since reactance represents the ratio of voltage to
current it has units of ohms
 The reactance of a component can be used in much
the same way as resistance:
– for an inductor
V = I XL

– for a capacitor
V = I XC
Storey: Electrical & Electronic Systems © Pearson Education Limited 2004

OHT 15.10
 Example – see Example 15.3 from course text
A sinusoidal voltage of 5 V peak and 100 Hz is applied across
an inductor of 25 mH. What will be the peak current?
At this frequency, the reactance of the inductor is given by

X L = ωL = 2πfL = 2 × π × 100 × 25 × 10 − 3 = 15.7 Ω
Therefore

VL
5
IL =
=
= 318 mA peak
X L 15.7
Storey: Electrical & Electronic Systems © Pearson Education Limited 2004

OHT 15.11
Phasor Diagrams

15.4

 Sinusoidal signals are characterised by their
magnitude, their frequency and their phase
 In many circuits the frequency is fixed (perhaps at
the frequency of the AC supply) and we are
interested in only magnitude and phase
 In such cases we often use phasor diagrams which
represent magnitude and phase within a single
diagram

Storey: Electrical & Electronic Systems © Pearson Education Limited 2004

OHT 15.12
 Examples of
phasor diagrams
(a) here L represents
the magnitude and φ
the phase of a
sinusoidal signal
(b) shows the voltages
across a resistor, an
inductor and a
capacitor for the same
sinusoidal current
Storey: Electrical & Electronic Systems © Pearson Education Limited 2004

OHT 15.13
 Phasor diagrams can be used to represent the
addition of signals. This gives both the magnitude
and phase of the resultant signal

Storey: Electrical & Electronic Systems © Pearson Education Limited 2004

OHT 15.14
 Phasor diagrams can also be used to show the
subtraction of signals

Storey: Electrical & Electronic Systems © Pearson Education Limited 2004

OHT 15.15
 Phasor analysis of an RL circuit

 See Example 15.5 in the text for a numerical example
Storey: Electrical & Electronic Systems © Pearson Education Limited 2004

OHT 15.16
 Phasor analysis of an RC circuit

 See Example 15.6 in the text for a numerical example
Storey: Electrical & Electronic Systems © Pearson Education Limited 2004

OHT 15.17
 Phasor analysis of an RLC circuit

Storey: Electrical & Electronic Systems © Pearson Education Limited 2004

OHT 15.18
 Phasor analysis
of parallel
circuits
in such circuits the
voltage across each
of the components is
the same and it is the
currents that are of
interest

Storey: Electrical & Electronic Systems © Pearson Education Limited 2004

OHT 15.19
Impedance

15.5

 In circuits containing only resistive elements the
current is related to the applied voltage by the
resistance of the arrangement
 In circuits containing reactive, as well as resistive
elements, the current is related to the applied voltage
by the impedance, Z of the arrangement
– this reflects not only the magnitude of the current but
also its phase
– impedance can be used in reactive circuits in a similar
manner to the way resistance is used in resistive circuits
Storey: Electrical & Electronic Systems © Pearson Education Limited 2004

OHT 15.20
 Consider the following circuit and its phasor diagram

Storey: Electrical & Electronic Systems © Pearson Education Limited 2004

OHT 15.21
 From the phasor diagram it is clear that that the
magnitude of the voltage across the arrangement V
is
2
2
V = VR + VL

= (IR )2 + (IX L )2
= I R 2 + XL2
= IZ

Z = R 2 + XL2

where
 Z is the magnitude of the impedance, so Z =|Z|
Storey: Electrical & Electronic Systems © Pearson Education Limited 2004

OHT 15.22
 From the phasor diagram the phase angle of the
impedance is given by
φ = tan −1

VL
IX
X
= tan-1 L = tan-1 L
VR
IR
R

 This circuit contains an inductor but a similar analysis
can be done for circuits containing capacitors
 In general
2

Z= R +X

2

and

φ = tan

−1

Storey: Electrical & Electronic Systems © Pearson Education Limited 2004

X
R
OHT 15.23
 A graphical representation of impedance

Storey: Electrical & Electronic Systems © Pearson Education Limited 2004

OHT 15.24
Complex Notation

15.6

 Phasor diagrams are similar to Argand Diagrams
used in complex mathematics
 We can also represent impedance using complex
notation where
 Resistors:

ZR

=

R

 Inductors:

ZL

=

jXL

=

 Capacitors:

ZC

=

-jXC

=

jω L

1
1
−j
=
ωC j ωC

Storey: Electrical & Electronic Systems © Pearson Education Limited 2004

OHT 15.25
 Graphical representation of complex impedance

Storey: Electrical & Electronic Systems © Pearson Education Limited 2004

OHT 15.26
 Series and parallel
combinations of
impedances
– impedances combine
in the same way as
resistors

Storey: Electrical & Electronic Systems © Pearson Education Limited 2004

OHT 15.27
 Manipulating complex impedances
– complex impedances can be added, subtracted,
multiplied and divided in the same way as other
complex quantities
– they can also be expressed in a range of forms such
as the rectangular, polar and exponential forms
– if you are unfamiliar with the manipulation of complex
quantities (or would like a little revision on this topic)
see Appendix D of the course text which gives a
tutorial on this subject
Storey: Electrical & Electronic Systems © Pearson Education Limited 2004

OHT 15.28
 Example – see Example 15.7 in the course text
Determine the complex
impedance of this circuit
at a frequency of 50 Hz.
At 50Hz, the angular frequency ω = 2πf = 2×π ×50 = 314 rad/s
Therefore
Z = ZC + Z R + Z L = R + j( X L − X C ) = R + j(ωL −
= 200 + j(314 × 400 × 10 −3 −
= 200 + j62 ohms

1
314 × 50 × 10

−6

1
)
ωC

)

Storey: Electrical & Electronic Systems © Pearson Education Limited 2004

OHT 15.29
 Using complex impedance
 Example – see Section 15.6.4
in course text
Determine the current in this circuit.
Since v = 100 sin 250t , then ω = 250
Therefore

Z = R − j XC
=R−j

1
ωC

= 100 − j

1

250 × 10 − 4
= 100 − j40
Storey: Electrical & Electronic Systems © Pearson Education Limited 2004

OHT 15.30
 Example (continued)
The current is given by v/Z and this is easier to compute in
polar form
Z = 100 − j40
Z = 100 2 + 40 2 = 107.7
∠Z = tan − 1

− 40
= −21.8
100

Z = 107.7∠ − 21.8 

Therefore
i=

v
100∠0
=
= 0.93∠21.8
Z 107.7∠ − 21.8

Storey: Electrical & Electronic Systems © Pearson Education Limited 2004

OHT 15.31
 A further example
A more complex task is to
find the output voltage of this
circuit.
The analysis of this circuit,
and a numerical example
based on it, are given in
Section 15.6.4 and
Example 15.8 of the
course text
Storey: Electrical & Electronic Systems © Pearson Education Limited 2004

OHT 15.32
Key Points
 A sinusoidal voltage waveform can be described by the
equation v = Vp sin (ω t + φ )
 The voltage across a resistor is in phase with the current,
the voltage across an inductor leads the current by 90°, and
the voltage across a capacitor lags the current by 90°
 The reactance of an inductor XL = ωL
 The reactance of a capacitor XC = 1/ωC
 The relationship between current and voltage in circuits
containing reactance can be described by its impedance
 The use of impedance is simplified by the use of complex
notation
Storey: Electrical & Electronic Systems © Pearson Education Limited 2004

OHT 15.33

Alternating voltages and currents

  • 1.
    Alternating Voltages andCurrents Chapter 15  Introduction  Voltage and Current  Reactance of Inductors and Capacitors  Phasor Diagrams  Impedance  Complex Notation Storey: Electrical & Electronic Systems © Pearson Education Limited 2004 OHT 15.1
  • 2.
    Introduction 15.1  From ourearlier discussions we know that v = Vp sin (ω t + φ ) where Vp is the peak voltage ω is the angular frequency φ is the phase angle  Since ω = 2πf it follows that the period T is given by T = 1 2π = f ω Storey: Electrical & Electronic Systems © Pearson Education Limited 2004 OHT 15.2
  • 3.
     If φis in radians, then a time delay t is given by φ /ω as shown below Storey: Electrical & Electronic Systems © Pearson Education Limited 2004 OHT 15.3
  • 4.
    Voltage and Current 15.2 Consider the voltages across a resistor, an inductor and a capacitor, with a current of i = IP sin(ωt )  Resistors – from Ohm’s law we know v R = iR – therefore if i = Ipsin(ωt) v R = IP R sin(ωt ) Storey: Electrical & Electronic Systems © Pearson Education Limited 2004 OHT 15.4
  • 5.
    Voltage and Current Inductors - in an inductor 15.2 di vL = L dt – therefore if i = Ipsin(ωt) d(I sin(ωt )) vL = L P = ωLIP cos(ωt ) dt 1 v C = ∫ idt C  Capacitors - in a capacitor Ip 1 v if = I ∫ IP sin – therefore C i= Cpsin(ωt)(ωt ) = − ωC cos(ωt ) Storey: Electrical & Electronic Systems © Pearson Education Limited 2004 OHT 15.5
  • 6.
    Storey: Electrical &Electronic Systems © Pearson Education Limited 2004 OHT 15.6
  • 7.
    Reactance of Inductorsand Capacitors 15.3  Let us ignore, for the moment the phase angle and consider the magnitudes of the voltages and currents  Let us compare the peak voltage and peak current  Resistance Peak value of voltage Peak value of (IP Rsin(ωt )) IP R = = =R Peak value of current Peak value of (IP sin(ωt )) IP Storey: Electrical & Electronic Systems © Pearson Education Limited 2004 OHT 15.7
  • 8.
     Inductance Peak valueof voltage Peak value of (ωLIP cos(ωt )) ωLIP = = = ωL Peak value of current Peak value of (IP sin(ωt )) IP  Capacitance Peak value of voltage = Peak value of current Peak value of ( − Ip cos(ωt )) ωC Peak value of (I p sin(ωt )) Storey: Electrical & Electronic Systems © Pearson Education Limited 2004 Ip 1 = ωC = Ip ωC OHT 15.8
  • 9.
     The ratioof voltage to current is a measure of how the component opposes the flow of electricity  In a resistor this is termed its resistance  In inductors and capacitors it is termed its reactance  Reactance is given the symbol X  Therefore Re ac tan ce of an inductor, X L = ωL Reactance 1 Re ac tan ce of a capacitor, X C = Reactance ωC Storey: Electrical & Electronic Systems © Pearson Education Limited 2004 OHT 15.9
  • 10.
     Since reactancerepresents the ratio of voltage to current it has units of ohms  The reactance of a component can be used in much the same way as resistance: – for an inductor V = I XL – for a capacitor V = I XC Storey: Electrical & Electronic Systems © Pearson Education Limited 2004 OHT 15.10
  • 11.
     Example –see Example 15.3 from course text A sinusoidal voltage of 5 V peak and 100 Hz is applied across an inductor of 25 mH. What will be the peak current? At this frequency, the reactance of the inductor is given by X L = ωL = 2πfL = 2 × π × 100 × 25 × 10 − 3 = 15.7 Ω Therefore VL 5 IL = = = 318 mA peak X L 15.7 Storey: Electrical & Electronic Systems © Pearson Education Limited 2004 OHT 15.11
  • 12.
    Phasor Diagrams 15.4  Sinusoidalsignals are characterised by their magnitude, their frequency and their phase  In many circuits the frequency is fixed (perhaps at the frequency of the AC supply) and we are interested in only magnitude and phase  In such cases we often use phasor diagrams which represent magnitude and phase within a single diagram Storey: Electrical & Electronic Systems © Pearson Education Limited 2004 OHT 15.12
  • 13.
     Examples of phasordiagrams (a) here L represents the magnitude and φ the phase of a sinusoidal signal (b) shows the voltages across a resistor, an inductor and a capacitor for the same sinusoidal current Storey: Electrical & Electronic Systems © Pearson Education Limited 2004 OHT 15.13
  • 14.
     Phasor diagramscan be used to represent the addition of signals. This gives both the magnitude and phase of the resultant signal Storey: Electrical & Electronic Systems © Pearson Education Limited 2004 OHT 15.14
  • 15.
     Phasor diagramscan also be used to show the subtraction of signals Storey: Electrical & Electronic Systems © Pearson Education Limited 2004 OHT 15.15
  • 16.
     Phasor analysisof an RL circuit  See Example 15.5 in the text for a numerical example Storey: Electrical & Electronic Systems © Pearson Education Limited 2004 OHT 15.16
  • 17.
     Phasor analysisof an RC circuit  See Example 15.6 in the text for a numerical example Storey: Electrical & Electronic Systems © Pearson Education Limited 2004 OHT 15.17
  • 18.
     Phasor analysisof an RLC circuit Storey: Electrical & Electronic Systems © Pearson Education Limited 2004 OHT 15.18
  • 19.
     Phasor analysis ofparallel circuits in such circuits the voltage across each of the components is the same and it is the currents that are of interest Storey: Electrical & Electronic Systems © Pearson Education Limited 2004 OHT 15.19
  • 20.
    Impedance 15.5  In circuitscontaining only resistive elements the current is related to the applied voltage by the resistance of the arrangement  In circuits containing reactive, as well as resistive elements, the current is related to the applied voltage by the impedance, Z of the arrangement – this reflects not only the magnitude of the current but also its phase – impedance can be used in reactive circuits in a similar manner to the way resistance is used in resistive circuits Storey: Electrical & Electronic Systems © Pearson Education Limited 2004 OHT 15.20
  • 21.
     Consider thefollowing circuit and its phasor diagram Storey: Electrical & Electronic Systems © Pearson Education Limited 2004 OHT 15.21
  • 22.
     From thephasor diagram it is clear that that the magnitude of the voltage across the arrangement V is 2 2 V = VR + VL = (IR )2 + (IX L )2 = I R 2 + XL2 = IZ Z = R 2 + XL2 where  Z is the magnitude of the impedance, so Z =|Z| Storey: Electrical & Electronic Systems © Pearson Education Limited 2004 OHT 15.22
  • 23.
     From thephasor diagram the phase angle of the impedance is given by φ = tan −1 VL IX X = tan-1 L = tan-1 L VR IR R  This circuit contains an inductor but a similar analysis can be done for circuits containing capacitors  In general 2 Z= R +X 2 and φ = tan −1 Storey: Electrical & Electronic Systems © Pearson Education Limited 2004 X R OHT 15.23
  • 24.
     A graphicalrepresentation of impedance Storey: Electrical & Electronic Systems © Pearson Education Limited 2004 OHT 15.24
  • 25.
    Complex Notation 15.6  Phasordiagrams are similar to Argand Diagrams used in complex mathematics  We can also represent impedance using complex notation where  Resistors: ZR = R  Inductors: ZL = jXL =  Capacitors: ZC = -jXC = jω L 1 1 −j = ωC j ωC Storey: Electrical & Electronic Systems © Pearson Education Limited 2004 OHT 15.25
  • 26.
     Graphical representationof complex impedance Storey: Electrical & Electronic Systems © Pearson Education Limited 2004 OHT 15.26
  • 27.
     Series andparallel combinations of impedances – impedances combine in the same way as resistors Storey: Electrical & Electronic Systems © Pearson Education Limited 2004 OHT 15.27
  • 28.
     Manipulating compleximpedances – complex impedances can be added, subtracted, multiplied and divided in the same way as other complex quantities – they can also be expressed in a range of forms such as the rectangular, polar and exponential forms – if you are unfamiliar with the manipulation of complex quantities (or would like a little revision on this topic) see Appendix D of the course text which gives a tutorial on this subject Storey: Electrical & Electronic Systems © Pearson Education Limited 2004 OHT 15.28
  • 29.
     Example –see Example 15.7 in the course text Determine the complex impedance of this circuit at a frequency of 50 Hz. At 50Hz, the angular frequency ω = 2πf = 2×π ×50 = 314 rad/s Therefore Z = ZC + Z R + Z L = R + j( X L − X C ) = R + j(ωL − = 200 + j(314 × 400 × 10 −3 − = 200 + j62 ohms 1 314 × 50 × 10 −6 1 ) ωC ) Storey: Electrical & Electronic Systems © Pearson Education Limited 2004 OHT 15.29
  • 30.
     Using compleximpedance  Example – see Section 15.6.4 in course text Determine the current in this circuit. Since v = 100 sin 250t , then ω = 250 Therefore Z = R − j XC =R−j 1 ωC = 100 − j 1 250 × 10 − 4 = 100 − j40 Storey: Electrical & Electronic Systems © Pearson Education Limited 2004 OHT 15.30
  • 31.
     Example (continued) Thecurrent is given by v/Z and this is easier to compute in polar form Z = 100 − j40 Z = 100 2 + 40 2 = 107.7 ∠Z = tan − 1 − 40 = −21.8 100 Z = 107.7∠ − 21.8  Therefore i= v 100∠0 = = 0.93∠21.8 Z 107.7∠ − 21.8 Storey: Electrical & Electronic Systems © Pearson Education Limited 2004 OHT 15.31
  • 32.
     A furtherexample A more complex task is to find the output voltage of this circuit. The analysis of this circuit, and a numerical example based on it, are given in Section 15.6.4 and Example 15.8 of the course text Storey: Electrical & Electronic Systems © Pearson Education Limited 2004 OHT 15.32
  • 33.
    Key Points  Asinusoidal voltage waveform can be described by the equation v = Vp sin (ω t + φ )  The voltage across a resistor is in phase with the current, the voltage across an inductor leads the current by 90°, and the voltage across a capacitor lags the current by 90°  The reactance of an inductor XL = ωL  The reactance of a capacitor XC = 1/ωC  The relationship between current and voltage in circuits containing reactance can be described by its impedance  The use of impedance is simplified by the use of complex notation Storey: Electrical & Electronic Systems © Pearson Education Limited 2004 OHT 15.33