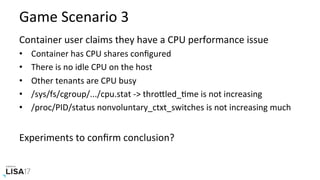
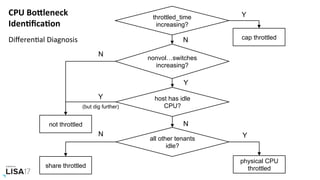
Download as PDF, PPTX

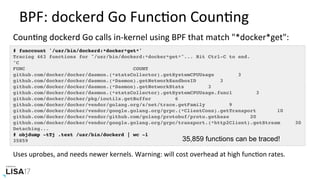
![Latency Histogram: e.g. btrfsdist
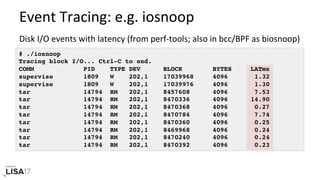
# ./btrfsdist
Tracing btrfs operation latency... Hit Ctrl-C to end.
^C
operation = 'read'
usecs : count distribution
0 -> 1 : 192529 |****************************************|
2 -> 3 : 72337 |*************** |
4 -> 7 : 5620 |* |
8 -> 15 : 1026 | |
16 -> 31 : 369 | |
32 -> 63 : 239 | |
64 -> 127 : 53 | |
128 -> 255 : 975 | |
256 -> 511 : 524 | |
512 -> 1023 : 128 | |
1024 -> 2047 : 16 | |
2048 -> 4095 : 7 | |
[…]
probably
cache reads
probably cache misses
(flash reads)
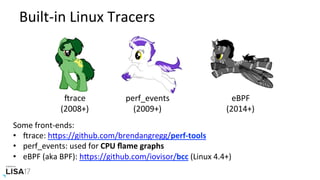
• Histograms show modes, outliers. Also in bcc/BPF (with other FSes).
• Latency heat maps: hPp://queue.acm.org/detail.cfm?id=1809426
From a test
Titus system](https://image.slidesharecdn.com/lisa2017containerperformanceanalysis-171102222328/85/LISA17-Container-Performance-Analysis-26-320.jpg)
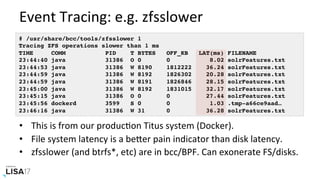
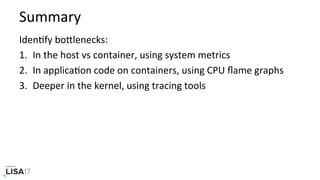
![systemd-cgtop
A "top" for cgroups:
# systemd-cgtop
Control Group Tasks %CPU Memory Input/s Output/s
/ - 798.2 45.9G - -
/docker 1082 790.1 42.1G - -
/docker/dcf3a...9d28fc4a1c72bbaff4a24834 200 610.5 24.0G - -
/docker/370a3...e64ca01198f1e843ade7ce21 170 174.0 3.0G - -
/system.slice 748 5.3 4.1G - -
/system.slice/daemontools.service 422 4.0 2.8G - -
/docker/dc277...42ab0603bbda2ac8af67996b 160 2.5 2.3G - -
/user.slice 5 2.0 34.5M - -
/user.slice/user-0.slice 5 2.0 15.7M - -
/user.slice/u....slice/session-c26.scope 3 2.0 13.3M - -
/docker/ab452...c946f8447f2a4184f3ccff2a 174 1.0 6.3G - -
/docker/e18bd...26ffdd7368b870aa3d1deb7a 156 0.8 2.9G - -
[...]](https://image.slidesharecdn.com/lisa2017containerperformanceanalysis-171102222328/85/LISA17-Container-Performance-Analysis-29-320.jpg)
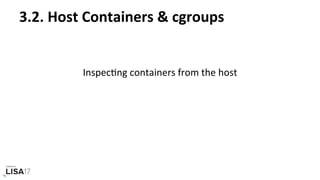
![docker stats
# docker stats
CONTAINER CPU % MEM USAGE / LIMIT MEM % NET I/O BLOCK I/O PIDS
353426a09db1 526.81% 4.061 GiB / 8.5 GiB 47.78% 0 B / 0 B 2.818 MB / 0 B 247
6bf166a66e08 303.82% 3.448 GiB / 8.5 GiB 40.57% 0 B / 0 B 2.032 MB / 0 B 267
58dcf8aed0a7 41.01% 1.322 GiB / 2.5 GiB 52.89% 0 B / 0 B 0 B / 0 B 229
61061566ffe5 85.92% 220.9 MiB / 3.023 GiB 7.14% 0 B / 0 B 43.4 MB / 0 B 61
bdc721460293 2.69% 1.204 GiB / 3.906 GiB 30.82% 0 B / 0 B 4.35 MB / 0 B 66
6c80ed61ae63 477.45% 557.7 MiB / 8 GiB 6.81% 0 B / 0 B 9.257 MB / 0 B 19
337292fb5b64 89.05% 766.2 MiB / 8 GiB 9.35% 0 B / 0 B 5.493 MB / 0 B 19
b652ede9a605 173.50% 689.2 MiB / 8 GiB 8.41% 0 B / 0 B 6.48 MB / 0 B 19
d7cd2599291f 504.28% 673.2 MiB / 8 GiB 8.22% 0 B / 0 B 12.58 MB / 0 B 19
05bf9f3e0d13 314.46% 711.6 MiB / 8 GiB 8.69% 0 B / 0 B 7.942 MB / 0 B 19
09082f005755 142.04% 693.9 MiB / 8 GiB 8.47% 0 B / 0 B 8.081 MB / 0 B 19
bd45a3e1ce16 190.26% 538.3 MiB / 8 GiB 6.57% 0 B / 0 B 10.6 MB / 0 B 19
[...]
A "top" for containers. Resource uNlizaNon. Workload characterizaNon.](https://image.slidesharecdn.com/lisa2017containerperformanceanalysis-171102222328/85/LISA17-Container-Performance-Analysis-30-320.jpg)
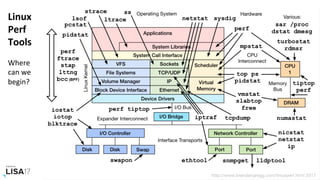
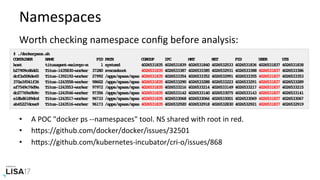
![top
# top - 22:46:53 up 36 days, 59 min, 1 user, load average: 5.77, 5.61, 5.63
Tasks: 1067 total, 1 running, 1046 sleeping, 0 stopped, 20 zombie
%Cpu(s): 34.8 us, 1.8 sy, 0.0 ni, 61.3 id, 0.0 wa, 0.0 hi, 1.9 si, 0.1 st
KiB Mem : 65958552 total, 12418448 free, 49247988 used, 4292116 buff/cache
KiB Swap: 0 total, 0 free, 0 used. 13101316 avail Mem
PID USER PR NI VIRT RES SHR S %CPU %MEM TIME+ COMMAND
28321 root 20 0 33.126g 0.023t 37564 S 621.1 38.2 35184:09 java
97712 root 20 0 11.445g 2.333g 37084 S 3.1 3.7 404:27.90 java
98306 root 20 0 12.149g 3.060g 36996 S 2.0 4.9 194:21.10 java
96511 root 20 0 15.567g 6.313g 37112 S 1.7 10.0 168:07.44 java
5283 root 20 0 1643676 100092 94184 S 1.0 0.2 401:36.16 mesos-slave
2079 root 20 0 9512 132 12 S 0.7 0.0 220:07.75 rngd
5272 titusag+ 20 0 10.473g 1.611g 23488 S 0.7 2.6 1934:44 java
[…]
In the host, top shows all processes, but currently no container IDs.
Can fix, but that would be Docker + cgroup-v1 specific. SNll need a kernel CID.](https://image.slidesharecdn.com/lisa2017containerperformanceanalysis-171102222328/85/LISA17-Container-Performance-Analysis-31-320.jpg)
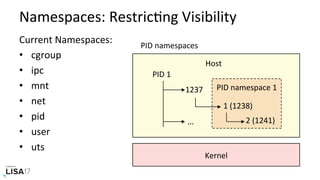
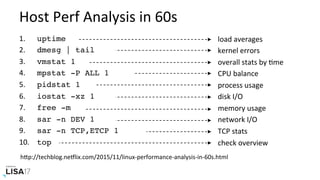
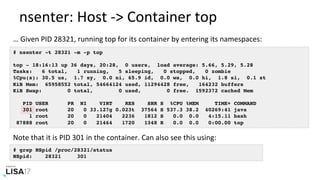
![Host PID -> Container ID
# grep 28321 /sys/fs/cgroup/cpu,cpuacct/docker/*/tasks | cut -d/ -f7
dcf3a506de453107715362f6c9ba9056fcfc6e769d28fc4a1c72bbaff4a24834
… who does that (CPU busy) PID 28321 belong to?
• Only works for Docker, and that cgroup v1 layout. Some Linux commands:
# ls -l /proc/27992/ns/*
lrwxrwxrwx 1 root root 0 Apr 13 20:49 cgroup -> cgroup:[4026531835]
lrwxrwxrwx 1 root root 0 Apr 13 20:49 ipc -> ipc:[4026533354]
lrwxrwxrwx 1 root root 0 Apr 13 20:49 mnt -> mnt:[4026533352]
[…]
# cat /proc/27992/cgroup
11:freezer:/docker/dcf3a506de453107715362f6c9ba9056fcfc6e769d28fc4a1c72bbaff4a24834
10:blkio:/docker/dcf3a506de453107715362f6c9ba9056fcfc6e769d28fc4a1c72bbaff4a24834
9:perf_event:/docker/dcf3a506de453107715362f6c9ba9056fcfc6e769d28fc4a1c72bbaff4a24834
[…]](https://image.slidesharecdn.com/lisa2017containerperformanceanalysis-171102222328/85/LISA17-Container-Performance-Analysis-33-320.jpg)
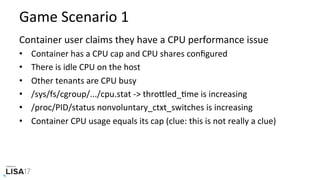

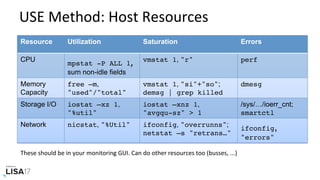
![CPU
container# uptime
20:17:19 up 45 days, 21:21, 0 users, load average: 5.08, 3.69, 2.22
container# mpstat 1
Linux 4.9.0 (02a7cf65f82e) 04/14/17 _x86_64_ (8 CPU)
20:17:26 CPU %usr %nice %sys %iowait %irq %soft %steal %guest %gnice %idle
20:17:27 all 51.00 0.00 12.28 0.00 0.00 0.00 0.00 0.00 0.00 36.72
20:17:28 all 50.88 0.00 12.31 0.00 0.00 0.00 0.00 0.00 0.00 36.81
^C
Average: all 50.94 0.00 12.30 0.00 0.00 0.00 0.00 0.00 0.00 36.76
container# pidstat 1
Linux 4.9.0 (02a7cf65f82e) 04/14/17 _x86_64_ (8 CPU)
20:17:33 UID PID %usr %system %guest %CPU CPU Command
20:17:34 UID PID %usr %system %guest %CPU CPU Command
20:17:35 UID PID %usr %system %guest %CPU CPU Command
[...]
Can see host's CPU devices, but only container (pid namespace) processes:
load!
busy CPUs
but this container
is running nothing
(we saw CPU usage
from neighbors)](https://image.slidesharecdn.com/lisa2017containerperformanceanalysis-171102222328/85/LISA17-Container-Performance-Analysis-50-320.jpg)
![Disks
Can see host's disk devices:
container# iostat -xz 1
avg-cpu: %user %nice %system %iowait %steal %idle
52.57 0.00 16.94 0.00 0.00 30.49
Device: rrqm/s wrqm/s r/s w/s rkB/s wkB/s avgrq-sz avgqu-sz await r_await w_await svctm %util
xvdap1 0.00 7.00 0.00 2.00 0.00 36.00 36.00 0.00 2.00 0.00 2.00 2.00 0.40
xvdb 0.00 0.00 200.00 0.00 3080.00 0.00 30.80 0.04 0.20 0.20 0.00 0.20 4.00
xvdc 0.00 0.00 185.00 0.00 2840.00 0.00 30.70 0.04 0.24 0.24 0.00 0.24 4.40
md0 0.00 0.00 385.00 0.00 5920.00 0.00 30.75 0.00 0.00 0.00 0.00 0.00 0.00
[...]
container# pidstat -d 1
Linux 4.9.0 (02a7cf65f82e) 04/18/17 _x86_64_ (8 CPU)
22:41:13 UID PID kB_rd/s kB_wr/s kB_ccwr/s iodelay Command
22:41:14 UID PID kB_rd/s kB_wr/s kB_ccwr/s iodelay Command
22:41:15 UID PID kB_rd/s kB_wr/s kB_ccwr/s iodelay Command
[...]
host disk I/O
but no
container I/O](https://image.slidesharecdn.com/lisa2017containerperformanceanalysis-171102222328/85/LISA17-Container-Performance-Analysis-52-320.jpg)
![Network
Can't see host's network interfaces (network namespace):
container# sar -n DEV,TCP 1
Linux 4.9.0 (02a7cf65f82e) 04/14/17 _x86_64_ (8 CPU)
21:45:07 IFACE rxpck/s txpck/s rxkB/s txkB/s rxcmp/s txcmp/s rxmcst/s %ifutil
21:45:08 lo 0.00 0.00 0.00 0.00 0.00 0.00 0.00 0.00
21:45:08 eth0 0.00 0.00 0.00 0.00 0.00 0.00 0.00 0.00
21:45:07 active/s passive/s iseg/s oseg/s
21:45:08 0.00 0.00 0.00 0.00
21:45:08 IFACE rxpck/s txpck/s rxkB/s txkB/s rxcmp/s txcmp/s rxmcst/s %ifutil
21:45:09 lo 0.00 0.00 0.00 0.00 0.00 0.00 0.00 0.00
21:45:09 eth0 0.00 0.00 0.00 0.00 0.00 0.00 0.00 0.00
21:45:08 active/s passive/s iseg/s oseg/s
21:45:09 0.00 0.00 0.00 0.00
[...]
host has heavy network I/O,
container sees itself (idle)](https://image.slidesharecdn.com/lisa2017containerperformanceanalysis-171102222328/85/LISA17-Container-Performance-Analysis-53-320.jpg)
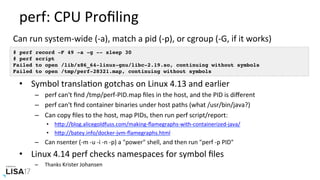
![perf: CPU Profiling
Needs capabiliNes to run from a container:
container# ./perf record -F 99 -a -g -- sleep 10
perf_event_open(..., PERF_FLAG_FD_CLOEXEC) failed with unexpected error 1 (Operation not permitted)
perf_event_open(..., 0) failed unexpectedly with error 1 (Operation not permitted)
Error: You may not have permission to collect system-wide stats.
Consider tweaking /proc/sys/kernel/perf_event_paranoid,
[...]
Although tweaking perf_event_paranoid (to -1) doesn't fix it. The real problem is:
hPps://docs.docker.com/engine/security/seccomp/#significant-syscalls-blocked-by-the-default-profile:](https://image.slidesharecdn.com/lisa2017containerperformanceanalysis-171102222328/85/LISA17-Container-Performance-Analysis-55-320.jpg)
![trace: Overlay FS FuncNon Calls
Using trace via my perf-tools to count funcNon calls in-kernel context:
Each can be a target for further study with kprobes
# funccount '*ovl*'
Tracing "*ovl*"... Ctrl-C to end.
^C
FUNC COUNT
ovl_cache_free 3
ovl_xattr_get 3
[...]
ovl_fill_merge 339
ovl_path_real 617
ovl_path_upper 777
ovl_update_time 777
ovl_permission 1408
ovl_d_real 1434
ovl_override_creds 1804
Ending tracing...](https://image.slidesharecdn.com/lisa2017containerperformanceanalysis-171102222328/85/LISA17-Container-Performance-Analysis-59-320.jpg)
![trace: Overlay FS FuncNon Tracing
Using kprobe (perf-tools) to trace ovl_fill_merg() args and stack trace:
Good for debugging, although dumping all events can cost too much overhead. trace has some
soluNons to this, BPF has more…
# kprobe -s 'p:ovl_fill_merge ctx=%di name=+0(%si):string'
Tracing kprobe ovl_fill_merge. Ctrl-C to end.
bash-16633 [000] d... 14390771.218973: ovl_fill_merge: (ovl_fill_merge+0x0/0x1f0
[overlay]) ctx=0xffffc90042477db0 name="iostat"
bash-16633 [000] d... 14390771.218981: <stack trace>
=> ovl_fill_merge
=> ext4_readdir
=> iterate_dir
=> ovl_dir_read_merged
=> ovl_iterate
=> iterate_dir
=> SyS_getdents
=> do_syscall_64
=> return_from_SYSCALL_64
[…]](https://image.slidesharecdn.com/lisa2017containerperformanceanalysis-171102222328/85/LISA17-Container-Performance-Analysis-60-320.jpg)
![BPF: Scheduler Latency
host# runqlat --pidnss -m
Tracing run queue latency... Hit Ctrl-C to end.
^C
pidns = 4026532382
msecs : count distribution
0 -> 1 : 646 |****************************************|
2 -> 3 : 18 |* |
4 -> 7 : 48 |** |
8 -> 15 : 17 |* |
16 -> 31 : 150 |********* |
32 -> 63 : 134 |******** |
[…]
pidns = 4026532870
msecs : count distribution
0 -> 1 : 264 |****************************************|
2 -> 3 : 0 | |
[...]
Per-PID namespace histograms
summarized in-kernel
for efficiency
- Shows CPU share throPling when present (eg, 8 - 65 ms)
- Currently using task_struct->nsproxy->pid_ns_for_children->ns.inum
for pidns. We could add a stable bpf_get_current_pidns() call to BPF.](https://image.slidesharecdn.com/lisa2017containerperformanceanalysis-171102222328/85/LISA17-Container-Performance-Analysis-63-320.jpg)
![BPF: dockerd Go Stack Tracing
# stackcount 'p:/usr/bin/dockerd:*/ioutils.getBuffer'
Tracing 1 functions for "p:/usr/bin/dockerd:*/ioutils.getBuffer"... Hit Ctrl-C to end.
^C
github.com/docker/docker/pkg/ioutils.getBuffer
github.com/docker/docker/pkg/broadcaster.(*Unbuffered).Write
bufio.(*Reader).writeBuf
bufio.(*Reader).WriteTo
io.copyBuffer
io.Copy
github.com/docker/docker/pkg/pools.Copy
github.com/docker/docker/container/stream.(*Config).CopyToPipe.func1.1
runtime.goexit
dockerd [18176]
110
Detaching...
means this stack was seen 110 times
Can also trace funcNon arguments, and latency (with some work)
hPp://www.brendangregg.com/blog/2017-01-31/golang-bcc-bpf-funcNon-tracing.html
CounNng stack traces that led to this iouNls.getBuffer() call:](https://image.slidesharecdn.com/lisa2017containerperformanceanalysis-171102222328/85/LISA17-Container-Performance-Analysis-66-320.jpg)

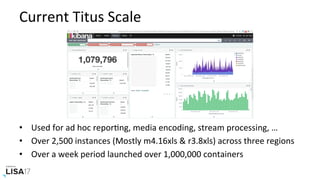
The document covers a presentation on container performance analysis, highlighting the identification of bottlenecks in both the host and application code using system metrics and CPU flame graphs. It discusses the architecture and operational aspects of the Titus container management platform, which manages over 1,000,000 containers and focuses on performance tuning, capacity planning, and resource management. Additionally, it details methodologies for analyzing container performance and challenges related to host analysis and resource utilization.