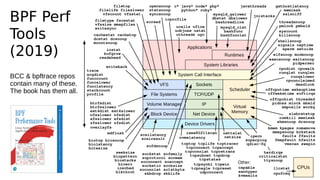
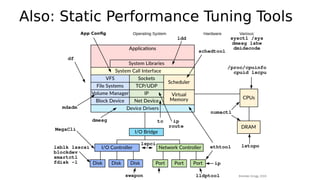
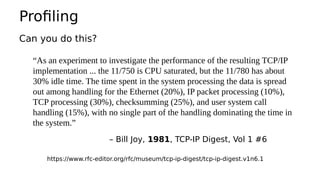
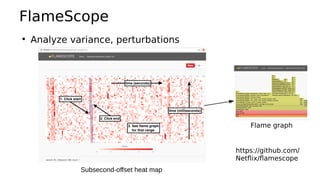
This document provides an overview of Linux performance monitoring tools including mpstat, top, htop, vmstat, iostat, free, strace, and tcpdump. It discusses what each tool measures and how to use it to observe system performance and diagnose issues. The tools presented provide visibility into CPU usage, memory usage, disk I/O, network traffic, and system call activity which are essential for understanding workload performance on Linux systems.


![mpstat
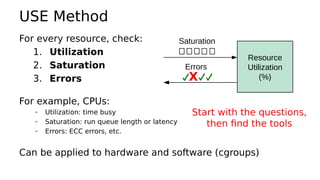
serverA# mpstat 10
Linux 4.4.0-130-generic (serverA) 07/18/2019 _x86_64_ (48 CPU)
10:07:55 PM CPU %usr %nice %sys %iowait %irq %soft %steal %guest %gnice %idle
10:08:05 PM all 89.72 0.00 7.84 0.00 0.00 0.04 0.00 0.00 0.00 2.40
10:08:15 PM all 88.60 0.00 9.18 0.00 0.00 0.05 0.00 0.00 0.00 2.17
10:08:25 PM all 89.71 0.00 9.01 0.00 0.00 0.05 0.00 0.00 0.00 1.23
[...]
Average: all 89.49 0.00 8.47 0.00 0.00 0.05 0.00 0.00 0.00 1.99
serverB# mpstat 10
Linux 4.19.26-nflx (serverB) 07/18/2019 _x86_64_ (64 CPU)
09:56:11 PM CPU %usr %nice %sys %iowait %irq %soft %steal %guest %gnice %idle
09:56:21 PM all 23.21 0.01 0.32 0.00 0.00 0.10 0.00 0.00 0.00 76.37
09:56:31 PM all 20.21 0.00 0.38 0.00 0.00 0.08 0.00 0.00 0.00 79.33
09:56:41 PM all 21.58 0.00 0.39 0.00 0.00 0.10 0.00 0.00 0.00 77.92
[...]
Average: all 21.50 0.00 0.36 0.00 0.00 0.09 0.00 0.00 0.00 78.04
load averages: serverA 90, serverB 17](https://image.slidesharecdn.com/lisa19slidesgregg-200313042443/85/test-3-320.jpg)
![perf
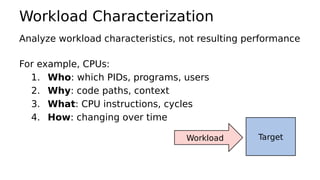
serverA# perf stat -e cs -a -I 1000
# time counts unit events
1.000411740 2,063,105 cs
2.000977435 2,065,354 cs
3.001537756 1,527,297 cs
4.002028407 515,509 cs
5.002538455 2,447,126 cs
[...]
serverB# perf stat -e cs -p 1928219 -I 1000
# time counts unit events
1.001931945 1,172 cs
2.002664012 1,370 cs
3.003441563 1,034 cs
4.004140394 1,207 cs
5.004947675 1,053 cs
[...]](https://image.slidesharecdn.com/lisa19slidesgregg-200313042443/85/test-5-320.jpg)
![bcc/BPF
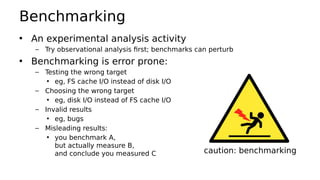
serverA# /usr/share/bcc/tools/cpudist -p 4093 10 1
Tracing on-CPU time... Hit Ctrl-C to end.
usecs : count distribution
0 -> 1 : 3618650 |****************************************|
2 -> 3 : 2704935 |***************************** |
4 -> 7 : 421179 |**** |
8 -> 15 : 99416 |* |
16 -> 31 : 16951 | |
32 -> 63 : 6355 | |
[...]
serverB# /usr/share/bcc/tools/cpudist -p 1928219 10 1
Tracing on-CPU time... Hit Ctrl-C to end.
usecs : count distribution
256 -> 511 : 44 | |
512 -> 1023 : 156 |* |
1024 -> 2047 : 238 |** |
2048 -> 4095 : 4511 |****************************************|
4096 -> 8191 : 277 |** |
8192 -> 16383 : 286 |** |
16384 -> 32767 : 77 | |
[...]](https://image.slidesharecdn.com/lisa19slidesgregg-200313042443/85/test-6-320.jpg)


![top
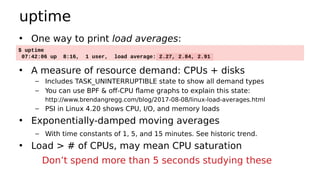
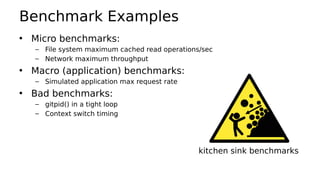
• System and per-process interval summary:
• %CPU is summed across all CPUs
• Can miss short-lived processes (atop won’t)
$ top - 18:50:26 up 7:43, 1 user, load average: 4.11, 4.91, 5.22
Tasks: 209 total, 1 running, 206 sleeping, 0 stopped, 2 zombie
Cpu(s): 47.1%us, 4.0%sy, 0.0%ni, 48.4%id, 0.0%wa, 0.0%hi, 0.3%si, 0.2%st
Mem: 70197156k total, 44831072k used, 25366084k free, 36360k buffers
Swap: 0k total, 0k used, 0k free, 11873356k cached
PID USER PR NI VIRT RES SHR S %CPU %MEM TIME+ COMMAND
5738 apiprod 20 0 62.6g 29g 352m S 417 44.2 2144:15 java
1386 apiprod 20 0 17452 1388 964 R 0 0.0 0:00.02 top
1 root 20 0 24340 2272 1340 S 0 0.0 0:01.51 init
2 root 20 0 0 0 0 S 0 0.0 0:00.00 kthreadd
[…]](https://image.slidesharecdn.com/lisa19slidesgregg-200313042443/85/test-15-320.jpg)
![htop
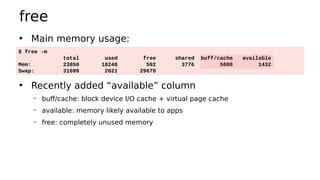
• Pros: configurable. Cons: misleading colors.
• dstat is similar, and now dead (May 2019); see pcp-dstat
$ htop
1 [||||||||||70.0%] 13 [||||||||||70.6%] 25 [||||||||||69.7%] 37 [||||||||||66.6%]
2 [||||||||||68.7%] 14 [||||||||||69.4%] 26 [||||||||||67.7%] 38 [||||||||||66.0%]
3 [||||||||||68.2%] 15 [||||||||||68.5%] 27 [||||||||||68.8%] 39 [||||||||||73.3%]
4 [||||||||||69.3%] 16 [||||||||||69.2%] 28 [||||||||||67.6%] 40 [||||||||||67.0%]
5 [||||||||||68.0%] 17 [||||||||||67.6%] 29 [||||||||||70.1%] 41 [||||||||||66.5%]
[…]
Mem[||||||||||||||||||||||||||||||176G/187G] Tasks: 80, 3206 thr; 43 running
Swp[ 0K/0K] Load average: 36.95 37.19 38.29
Uptime: 01:39:36
PID USER PRI NI VIRT RES SHR S CPU% MEM% TIME+ Command
4067 www-data 20 0 202G 173G 55392 S 3359 93.0 48h51:30 /apps/java/bin/java -Dnop -Djdk.map
6817 www-data 20 0 202G 173G 55392 R 56.9 93.0 48:37.89 /apps/java/bin/java -Dnop -Djdk.map
6826 www-data 20 0 202G 173G 55392 R 25.7 93.0 22:26.90 /apps/java/bin/java -Dnop -Djdk.map
6721 www-data 20 0 202G 173G 55392 S 25.0 93.0 22:05.51 /apps/java/bin/java -Dnop -Djdk.map
6616 www-data 20 0 202G 173G 55392 S 13.6 93.0 11:15.51 /apps/java/bin/java -Dnop -Djdk.map
[…]
F1Help F2Setup F3SearchF4FilterF5Tree F6SortByF7Nice -F8Nice +F9Kill F10Quit](https://image.slidesharecdn.com/lisa19slidesgregg-200313042443/85/test-16-320.jpg)
![vmstat
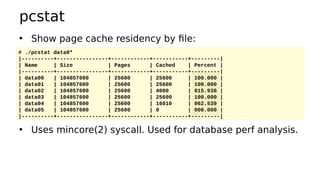
• Virtual memory statistics and more:
• USAGE: vmstat [interval [count]]
• First output line has some summary since boot values
• High level CPU summary
– “r” is runnable tasks
$ vmstat –Sm 1
procs -----------memory---------- ---swap-- -----io---- -system-- ----cpu----
r b swpd free buff cache si so bi bo in cs us sy id wa
8 0 0 1620 149 552 0 0 1 179 77 12 25 34 0 0
7 0 0 1598 149 552 0 0 0 0 205 186 46 13 0 0
8 0 0 1617 149 552 0 0 0 8 210 435 39 21 0 0
8 0 0 1589 149 552 0 0 0 0 218 219 42 17 0 0
[…]](https://image.slidesharecdn.com/lisa19slidesgregg-200313042443/85/test-17-320.jpg)
![iostat
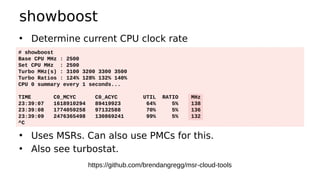
• Block I/O (disk) stats. 1st output is since boot.
$ iostat -xz 1
Linux 5.0.21 (c099.xxxx) 06/24/19 _x86_64_ (32 CPU)
[...]
Device r/s w/s rkB/s wkB/s rrqm/s wrqm/s %rrqm %wrqm ...
sda 0.01 0.00 0.16 0.00 0.00 0.00 0.00 0.00 /...
nvme3n1 19528.04 20.39 293152.56 14758.05 0.00 4.72 0.00 18.81 ...
nvme1n1 18513.51 17.83 286402.15 13089.56 0.00 4.05 0.00 18.52 /...
nvme0n1 16560.88 19.70 258184.52 14218.55 0.00 4.78 0.00 19.51 ...
... r_await w_await aqu-sz rareq-sz wareq-sz svctm %util
.../ 1.90 0.00 0.00 17.01 0.00 1.13 0.00
... 0.13 53.56 1.05 15.01 723.80 0.02 47.29
.../ 0.13 49.26 0.85 15.47 734.21 0.03 48.09
... 0.13 50.46 0.96 15.59 721.65 0.03 46.64
Workload
Resulting Performance
Very useful
set of stats](https://image.slidesharecdn.com/lisa19slidesgregg-200313042443/85/test-18-320.jpg)
![strace
• System call tracer:
• Translates syscall arguments
• Not all kernel requests (e.g., page faults)
• Currently has massive overhead (ptrace based)
– Can slow the target by > 100x. Skews measured time (-ttt, -T).
– http://www.brendangregg.com/blog/2014-05-11/strace-wow-much-syscall.html
• perf trace will replace it: uses a ring buffer & BPF
$ strace –tttT –p 313
1408393285.779746 getgroups(0, NULL) = 1 <0.000016>
1408393285.779873 getgroups(1, [0]) = 1 <0.000015>
1408393285.780797 close(3) = 0 <0.000016>
1408393285.781338 write(1, "wow much syscalln", 17wow much syscall
) = 17 <0.000048>](https://image.slidesharecdn.com/lisa19slidesgregg-200313042443/85/test-20-320.jpg)
![tcpdump
• Sniff network packets for post analysis:
• Study packet sequences with timestamps (us)
• CPU overhead optimized (socket ring buffers), but can
still be significant. Use BPF in-kernel summaries
instead.
$ tcpdump -i eth0 -w /tmp/out.tcpdump
tcpdump: listening on eth0, link-type EN10MB (Ethernet), capture size 65535 bytes
^C7985 packets captured
8996 packets received by filter
1010 packets dropped by kernel
# tcpdump -nr /tmp/out.tcpdump | head
reading from file /tmp/out.tcpdump, link-type EN10MB (Ethernet)
20:41:05.038437 IP 10.44.107.151.22 > 10.53.237.72.46425: Flags [P.], seq 18...
20:41:05.038533 IP 10.44.107.151.22 > 10.53.237.72.46425: Flags [P.], seq 48...
20:41:05.038584 IP 10.44.107.151.22 > 10.53.237.72.46425: Flags [P.], seq 96...
[…]](https://image.slidesharecdn.com/lisa19slidesgregg-200313042443/85/test-21-320.jpg)
![nstat
• Replacement for netstat from iproute2
• Various network protocol statistics:
– -s won’t reset counters,
otherwise intervals
can be examined
– -d for daemon mode
• Linux keeps adding
more counters
$ nstat -s
#kernel
IpInReceives 31109659 0.0
IpInDelivers 31109371 0.0
IpOutRequests 33209552 0.0
[...]
TcpActiveOpens 508924 0.0
TcpPassiveOpens 388584 0.0
TcpAttemptFails 933 0.0
TcpEstabResets 1545 0.0
TcpInSegs 31099176 0.0
TcpOutSegs 56254112 0.0
TcpRetransSegs 3762 0.0
TcpOutRsts 3183 0.0
[...]](https://image.slidesharecdn.com/lisa19slidesgregg-200313042443/85/test-22-320.jpg)
![slabtop
• Kernel slab allocator memory usage:
$ slabtop
Active / Total Objects (% used) : 4692768 / 4751161 (98.8%)
Active / Total Slabs (% used) : 129083 / 129083 (100.0%)
Active / Total Caches (% used) : 71 / 109 (65.1%)
Active / Total Size (% used) : 729966.22K / 738277.47K (98.9%)
Minimum / Average / Maximum Object : 0.01K / 0.16K / 8.00K
OBJS ACTIVE USE OBJ SIZE SLABS OBJ/SLAB CACHE SIZE NAME
3565575 3565575 100% 0.10K 91425 39 365700K buffer_head
314916 314066 99% 0.19K 14996 21 59984K dentry
184192 183751 99% 0.06K 2878 64 11512K kmalloc-64
138618 138618 100% 0.94K 4077 34 130464K xfs_inode
138602 138602 100% 0.21K 3746 37 29968K xfs_ili
102116 99012 96% 0.55K 3647 28 58352K radix_tree_node
97482 49093 50% 0.09K 2321 42 9284K kmalloc-96
22695 20777 91% 0.05K 267 85 1068K shared_policy_node
21312 21312 100% 0.86K 576 37 18432K ext4_inode_cache
16288 14601 89% 0.25K 509 32 4072K kmalloc-256
[…]](https://image.slidesharecdn.com/lisa19slidesgregg-200313042443/85/test-23-320.jpg)
![docker stats
• Soft limits (cgroups) by container:
• Stats are in /sys/fs/cgroups
• CPU shares and bursting breaks monitoring assumptions
# docker stats
CONTAINER CPU % MEM USAGE / LIMIT MEM % NET I/O BLOCK I/O PIDS
353426a09db1 526.81% 4.061 GiB / 8.5 GiB 47.78% 0 B / 0 B 2.818 MB / 0 B 247
6bf166a66e08 303.82% 3.448 GiB / 8.5 GiB 40.57% 0 B / 0 B 2.032 MB / 0 B 267
58dcf8aed0a7 41.01% 1.322 GiB / 2.5 GiB 52.89% 0 B / 0 B 0 B / 0 B 229
61061566ffe5 85.92% 220.9 MiB / 3.023 GiB 7.14% 0 B / 0 B 43.4 MB / 0 B 61
bdc721460293 2.69% 1.204 GiB / 3.906 GiB 30.82% 0 B / 0 B 4.35 MB / 0 B 66
6c80ed61ae63 477.45% 557.7 MiB / 8 GiB 6.81% 0 B / 0 B 9.257 MB / 0 B 19
337292fb5b64 89.05% 766.2 MiB / 8 GiB 9.35% 0 B / 0 B 5.493 MB / 0 B 19
b652ede9a605 173.50% 689.2 MiB / 8 GiB 8.41% 0 B / 0 B 6.48 MB / 0 B 19
d7cd2599291f 504.28% 673.2 MiB / 8 GiB 8.22% 0 B / 0 B 12.58 MB / 0 B 19
05bf9f3e0d13 314.46% 711.6 MiB / 8 GiB 8.69% 0 B / 0 B 7.942 MB / 0 B 19
09082f005755 142.04% 693.9 MiB / 8 GiB 8.47% 0 B / 0 B 8.081 MB / 0 B 19
[...]](https://image.slidesharecdn.com/lisa19slidesgregg-200313042443/85/test-25-320.jpg)


![perf: CPU profiling
• Sampling full stack traces at 99 Hertz, for 30 secs:
# perf record -F 99 -ag -- sleep 30
[ perf record: Woken up 9 times to write data ]
[ perf record: Captured and wrote 2.745 MB perf.data (~119930 samples) ]
# perf report -n --stdio
1.40% 162 java [kernel.kallsyms] [k] _raw_spin_lock
|
--- _raw_spin_lock
|
|--63.21%-- try_to_wake_up
| |
| |--63.91%-- default_wake_function
| | |
| | |--56.11%-- __wake_up_common
| | | __wake_up_locked
| | | ep_poll_callback
| | | __wake_up_common
| | | __wake_up_sync_key
| | | |
| | | |--59.19%-- sock_def_readable
[…78,000 lines truncated…]](https://image.slidesharecdn.com/lisa19slidesgregg-200313042443/85/test-43-320.jpg)

![perf: Counters
• Performance Monitoring Counters (PMCs):
•
• Measure instructions-per-cycle (IPC) and CPU stall types
• PMCs only enabled for some cloud instance types
$ perf list | grep –i hardware
cpu-cycles OR cycles [Hardware event]
stalled-cycles-frontend OR idle-cycles-frontend [Hardware event]
stalled-cycles-backend OR idle-cycles-backend [Hardware event]
instructions [Hardware event]
[…]
L1-dcache-loads [Hardware cache event]
L1-dcache-load-misses [Hardware cache event]
[…]
rNNN (see 'perf list --help' on how to encode it) [Raw hardware event …
mem:<addr>[:access] [Hardware breakpoint]
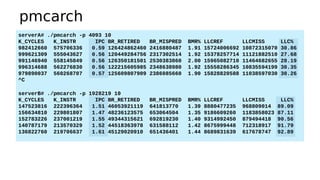
My front-ends, incl. pmcarch:
https://github.com/brendangregg/pmc-cloud-tools](https://image.slidesharecdn.com/lisa19slidesgregg-200313042443/85/test-49-320.jpg)

![Ftrace: perf-tools funccount
• Built-in kernel tracing capabilities, added by Steven
Rostedt and others since Linux 2.6.27
• Also see trace-cmd
# ./funccount -i 1 'bio_*'
Tracing "bio_*"... Ctrl-C to end.
FUNC COUNT
[...]
bio_alloc_bioset 536
bio_endio 536
bio_free 536
bio_fs_destructor 536
bio_init 536
bio_integrity_enabled 536
bio_put 729
bio_add_page 1004](https://image.slidesharecdn.com/lisa19slidesgregg-200313042443/85/test-53-320.jpg)
![perf: Tracing Tracepoints
http://www.brendangregg.com/perf.html
https://perf.wiki.kernel.org/index.php/Main_Page
# perf stat -e block:block_rq_complete -a sleep 10
Performance counter stats for 'system wide':
91 block:block_rq_complete
●
perf was introduced earlier; it is also a powerful tracer
# perf record -e block:block_rq_complete -a sleep 10
[ perf record: Woken up 1 times to write data ]
[ perf record: Captured and wrote 0.428 MB perf.data (~18687 samples) ]
# perf script
run 30339 [000] 2083345.722857: block:block_rq_complete: 202,1 W () 12986336 + 8 [0]
run 30339 [000] 2083345.723180: block:block_rq_complete: 202,1 W () 12986528 + 8 [0]
swapper 0 [000] 2083345.723489: block:block_rq_complete: 202,1 W () 12986496 + 8 [0]
swapper 0 [000] 2083346.745840: block:block_rq_complete: 202,1 WS () 1052984 + 144 [0]
supervise 30342 [000] 2083346.746571: block:block_rq_complete: 202,1 WS () 1053128 + 8 [0]
[...]
In-kernel counts (efficient)
Dump & post-process](https://image.slidesharecdn.com/lisa19slidesgregg-200313042443/85/test-54-320.jpg)
![BCC/BPF: ext4slower
• ext4 operations slower than the threshold:
• Better indicator of application pain than disk I/O
• Measures & filters in-kernel for efficiency using BPF
# ./ext4slower 1
Tracing ext4 operations slower than 1 ms
TIME COMM PID T BYTES OFF_KB LAT(ms) FILENAME
06:49:17 bash 3616 R 128 0 7.75 cksum
06:49:17 cksum 3616 R 39552 0 1.34 [
06:49:17 cksum 3616 R 96 0 5.36 2to3-2.7
06:49:17 cksum 3616 R 96 0 14.94 2to3-3.4
06:49:17 cksum 3616 R 10320 0 6.82 411toppm
06:49:17 cksum 3616 R 65536 0 4.01 a2p
06:49:17 cksum 3616 R 55400 0 8.77 ab
06:49:17 cksum 3616 R 36792 0 16.34 aclocal-1.14
[…]
https://github.com/iovisor/bcc](https://image.slidesharecdn.com/lisa19slidesgregg-200313042443/85/test-55-320.jpg)
![bpftrace: one-liners
• Block I/O (disk) events by type; by size & comm:
# bpftrace -e 't:block:block_rq_issue { @[args->rwbs] = count(); }'
Attaching 1 probe...
^C
@[WS]: 2
@[RM]: 12
@[RA]: 1609
@[R]: 86421
# bpftrace -e 't:block:block_rq_issue { @bytes[comm] = hist(args->bytes); }'
Attaching 1 probe...
^C
@bytes[dmcrypt_write]:
[4K, 8K) 68 |@@@@@@@@@@@@@@@@@@@@@@@@@@@@@@@@@@@@@@@@@@@@@@@@@@@@|
[8K, 16K) 35 |@@@@@@@@@@@@@@@@@@@@@@@@@@ |
[16K, 32K) 4 |@@@ |
[32K, 64K) 1 | |
[64K, 128K) 2 |@ |
[...]
https://github.com/iovisor/bpftrace](https://image.slidesharecdn.com/lisa19slidesgregg-200313042443/85/test-56-320.jpg)