Download as PDF, PPTX

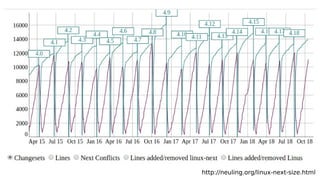
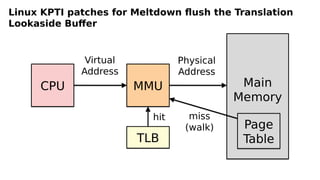
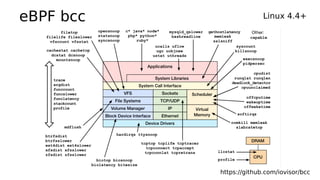
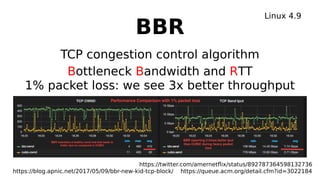
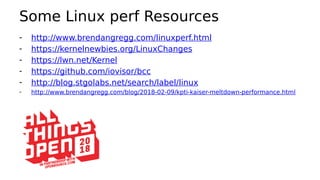
![Server A: 31353 MySQL queries/sec
Server B: 22795 queries/sec (27% slower)
serverA# mpstat 1
Linux 4.14.12-virtual (bgregg-c5.9xl-i-xxx) 02/09/2018 _x86_64_ (36 CPU)
01:09:13 AM CPU %usr %nice %sys %iowait %irq %soft %steal %guest %gnice %idle
01:09:14 AM all 86.89 0.00 13.08 0.00 0.00 0.00 0.00 0.00 0.00 0.03
01:09:15 AM all 86.77 0.00 13.23 0.00 0.00 0.00 0.00 0.00 0.00 0.00
01:09:16 AM all 86.93 0.00 13.02 0.00 0.00 0.00 0.03 0.00 0.00 0.03
[...]
serverB# mpstat 1
Linux 4.14.12-virtual (bgregg-c5.9xl-i-xxx) 02/09/2018 _x86_64_ (36 CPU)
01:09:44 AM CPU %usr %nice %sys %iowait %irq %soft %steal %guest %gnice %idle
01:09:45 AM all 82.94 0.00 17.06 0.00 0.00 0.00 0.00 0.00 0.00 0.00
01:09:46 AM all 82.78 0.00 17.22 0.00 0.00 0.00 0.00 0.00 0.00 0.00
01:09:47 AM all 83.14 0.00 16.86 0.00 0.00 0.00 0.00 0.00 0.00 0.00
[...]](https://image.slidesharecdn.com/ato2018linuxperformance2018-181022214837/85/ATO-Linux-Performance-2018-6-320.jpg)
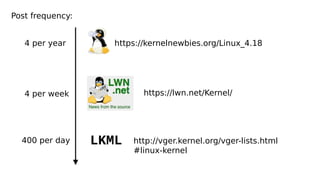
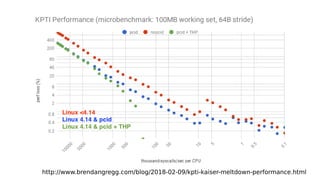
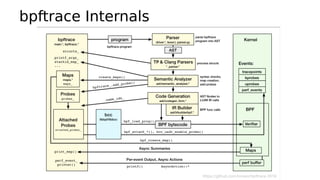
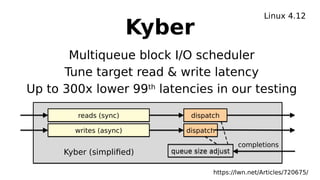
![Server A: TLB miss walks 3.5%
Server B: TLB miss walks 19.2% (16% higher)
serverA# ./tlbstat 1
K_CYCLES K_INSTR IPC DTLB_WALKS ITLB_WALKS K_DTLBCYC K_ITLBCYC DTLB% ITLB%
95913667 99982399 1.04 86588626 115441706 1507279 1837217 1.57 1.92
95810170 99951362 1.04 86281319 115306404 1507472 1842313 1.57 1.92
95844079 100066236 1.04 86564448 115555259 1511158 1845661 1.58 1.93
95978588 100029077 1.04 86187531 115292395 1508524 1845525 1.57 1.92
[...]
serverB# ./tlbstat 1
K_CYCLES K_INSTR IPC DTLB_WALKS ITLB_WALKS K_DTLBCYC K_ITLBCYC DTLB% ITLB%
95911236 80317867 0.84 911337888 719553692 10476524 7858141 10.92 8.19
95927861 80503355 0.84 913726197 721751988 10518488 7918261 10.96 8.25
95955825 80533254 0.84 912994135 721492911 10524675 7929216 10.97 8.26
96067221 80443770 0.84 912009660 720027006 10501926 7911546 10.93 8.24
[...]](https://image.slidesharecdn.com/ato2018linuxperformance2018-181022214837/85/ATO-Linux-Performance-2018-8-320.jpg)
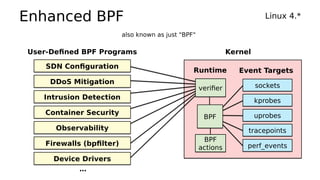
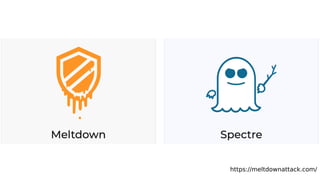
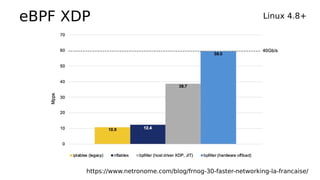
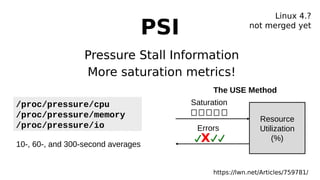
![e.g., identify multimodal disk I/O latency and outliers
with bcc/eBPF biolatency
# biolatency -mT 10
Tracing block device I/O... Hit Ctrl-C to end.
19:19:04
msecs : count distribution
0 -> 1 : 238 |********* |
2 -> 3 : 424 |***************** |
4 -> 7 : 834 |********************************* |
8 -> 15 : 506 |******************** |
16 -> 31 : 986 |****************************************|
32 -> 63 : 97 |*** |
64 -> 127 : 7 | |
128 -> 255 : 27 |* |
19:19:14
msecs : count distribution
0 -> 1 : 427 |******************* |
2 -> 3 : 424 |****************** |
[…]](https://image.slidesharecdn.com/ato2018linuxperformance2018-181022214837/85/ATO-Linux-Performance-2018-13-320.jpg)
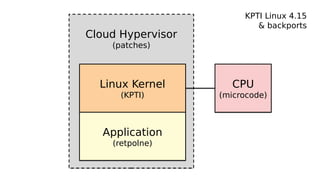
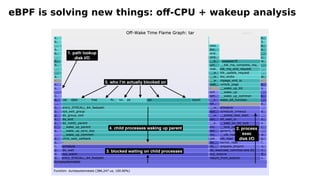
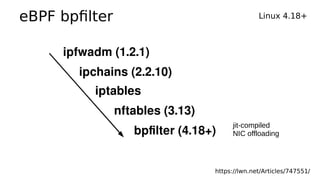
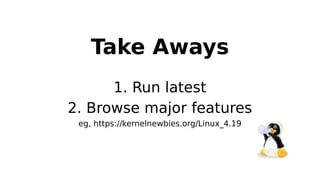
![bcc/eBPF programs are laborious: biolatency
# define BPF program
bpf_text = """
#include <uapi/linux/ptrace.h>
#include <linux/blkdev.h>
typedef struct disk_key {
char disk[DISK_NAME_LEN];
u64 slot;
} disk_key_t;
BPF_HASH(start, struct request *);
STORAGE
// time block I/O
int trace_req_start(struct pt_regs *ctx, struct request *req)
{
u64 ts = bpf_ktime_get_ns();
start.update(&req, &ts);
return 0;
}
// output
int trace_req_completion(struct pt_regs *ctx, struct request *req)
{
u64 *tsp, delta;
// fetch timestamp and calculate delta
tsp = start.lookup(&req);
if (tsp == 0) {
return 0; // missed issue
}
delta = bpf_ktime_get_ns() - *tsp;
FACTOR
// store as histogram
STORE
start.delete(&req);
return 0;
}
"""
# code substitutions
if args.milliseconds:
bpf_text = bpf_text.replace('FACTOR', 'delta /= 1000000;')
label = "msecs"
else:
bpf_text = bpf_text.replace('FACTOR', 'delta /= 1000;')
label = "usecs"
if args.disks:
bpf_text = bpf_text.replace('STORAGE',
'BPF_HISTOGRAM(dist, disk_key_t);')
bpf_text = bpf_text.replace('STORE',
'disk_key_t key = {.slot = bpf_log2l(delta)}; ' +
'void *__tmp = (void *)req->rq_disk->disk_name; ' +
'bpf_probe_read(&key.disk, sizeof(key.disk), __tmp); ' +
'dist.increment(key);')
else:
bpf_text = bpf_text.replace('STORAGE', 'BPF_HISTOGRAM(dist);')
bpf_text = bpf_text.replace('STORE',
'dist.increment(bpf_log2l(delta));')
if debug or args.ebpf:
print(bpf_text)
if args.ebpf:
exit()
# load BPF program
b = BPF(text=bpf_text)
if args.queued:
b.attach_kprobe(event="blk_account_io_start", fn_name="trace_req_start")
else:
b.attach_kprobe(event="blk_start_request", fn_name="trace_req_start")
b.attach_kprobe(event="blk_mq_start_request", fn_name="trace_req_start")
b.attach_kprobe(event="blk_account_io_completion",
fn_name="trace_req_completion")
print("Tracing block device I/O... Hit Ctrl-C to end.")
# output
exiting = 0 if args.interval else 1
dist = b.get_table("dist")
while (1):
try:
sleep(int(args.interval))
except KeyboardInterrupt:
exiting = 1
print()
if args.timestamp:
print("%-8sn" % strftime("%H:%M:%S"), end="")
dist.print_log2_hist(label, "disk")
dist.clear()
countdown -= 1
if exiting or countdown == 0:
exit()](https://image.slidesharecdn.com/ato2018linuxperformance2018-181022214837/85/ATO-Linux-Performance-2018-14-320.jpg)
![… rewritten in bpftrace (launched Oct 2018)!
#!/usr/local/bin/bpftrace
BEGIN
{
printf("Tracing block device I/O... Hit Ctrl-C to end.n");
}
kprobe:blk_account_io_start
{
@start[arg0] = nsecs;
}
kprobe:blk_account_io_completion
/@start[arg0]/
{
@usecs = hist((nsecs - @start[arg0]) / 1000);
delete(@start[arg0]);
}](https://image.slidesharecdn.com/ato2018linuxperformance2018-181022214837/85/ATO-Linux-Performance-2018-15-320.jpg)
![eBPF bpftrace (aka BPFtrace) Linux 4.9+
https://github.com/iovisor/bpftrace
# Syscall count by program
bpftrace -e 'tracepoint:raw_syscalls:sys_enter { @[comm] = count(); }'
# Read size distribution by process:
bpftrace -e 'tracepoint:syscalls:sys_exit_read { @[comm] = hist(args->ret); }'
# Files opened by process
bpftrace -e 'tracepoint:syscalls:sys_enter_open { printf("%s %sn", comm,
str(args->filename)); }'
# Trace kernel function
bpftrace -e 'kprobe:do_nanosleep { printf(“sleep by %s”, comm); }'
# Trace user-level function
Bpftrace -e 'uretprobe:/bin/bash:readline { printf(“%sn”, str(retval)); }’
…
Good for one-liners & short scripts; bcc is good for complex tools](https://image.slidesharecdn.com/ato2018linuxperformance2018-181022214837/85/ATO-Linux-Performance-2018-16-320.jpg)
![Hist Triggers
Linux 4.17
https://www.kernel.org/doc/html/latest/trace/histogram.html
# cat /sys/kernel/debug/tracing/events/kmem/kmalloc/hist
# trigger info:
hist:keys=stacktrace:vals=bytes_req,bytes_alloc:sort=bytes_alloc:size=2048
[active]
[…]
{ stacktrace:
__kmalloc+0x11b/0x1b0
seq_buf_alloc+0x1b/0x50
seq_read+0x2cc/0x370
proc_reg_read+0x3d/0x80
__vfs_read+0x28/0xe0
vfs_read+0x86/0x140
SyS_read+0x46/0xb0
system_call_fastpath+0x12/0x6a
} hitcount: 19133 bytes_req: 78368768 bytes_alloc: 78368768
ftrace
advanced
summaries](https://image.slidesharecdn.com/ato2018linuxperformance2018-181022214837/85/ATO-Linux-Performance-2018-22-320.jpg)
![More perf 4.4 - 4.19 (2016 - 2018)
●
TCP listener lockless (4.4)
●
copy_file_range() (4.5)
●
madvise() MADV_FREE (4.5)
●
epoll multithread scalability (4.5)
●
Kernel Connection Multiplexor (4.6)
●
Writeback management (4.10)
●
Hybrid block polling (4.10)
●
BFQ I/O scheduler (4.12)
●
Async I/O improvements (4.13)
●
In-kernel TLS acceleration (4.13)
●
Socket MSG_ZEROCOPY (4.14)
●
Asynchronous buffered I/O (4.14)
●
Longer-lived TLB entries with PCID (4.14)
●
mmap MAP_SYNC (4.15)
●
Software-interrupt context hrtimers (4.16)
●
Idle loop tick efficiency (4.17)
●
perf_event_open() [ku]probes (4.17)
●
AF_XDP sockets (4.18)
●
Block I/O latency controller (4.19)
●
CAKE for bufferbloat (4.19)
●
New async I/O polling (4.19)
… and many minor improvements to:
• perf
• CPU scheduling
• futexes
• NUMA
• Huge pages
• Slab allocation
• TCP, UDP
• Drivers
• Processor support
• GPUs](https://image.slidesharecdn.com/ato2018linuxperformance2018-181022214837/85/ATO-Linux-Performance-2018-24-320.jpg)

The document discusses advancements in Linux performance and features from 2018, focusing on kernel changes and performance metrics for various servers. It analyzes CPU utilization, memory management, and enhancements such as eBPF and block I/O scheduling. Key takeaways include the importance of running the latest kernel version and leveraging new performance tools and features.