Downloaded 80 times


![7
Computing Performance: On the Horizon (Brendan Gregg)
Interconnect rates
10 years:
●
3.25x bus rate
●
6x core count
Memory bus (covered later) also lagging
Year CPU Interconnect Bandwidth
Gbytes/s
2007 Intel FSB 12.8
2008 Intel QPI 25.6
2017 Intel UPI 41.6
Source: Systems Performance 2nd
Edition
Figure 6.10 [Gregg 20]](https://image.slidesharecdn.com/lisa2021computingperformance-210705140333/85/Computing-Performance-On-the-Horizon-2021-7-320.jpg)
![9
Computing Performance: On the Horizon (Brendan Gregg)
Lithography
2009 2012 2014 2016 2018 2020 2022 2023
0
5
10
15
20
25
30
35
Semiconductor Nanometer Process
nm
TSMC expects volume production
of 3nm in 2022 [Quach 21a]
Source: Semiconductor device fabrication [Wikipedia 21a]
2nm
3nm
32nm
Lithography limits expected to
be reached by 2029, switching
to stacked CPUs. [Moore 20]
BTW: Silicon atom radius ~0.1 nm [Wikipedia 21b]
IBM has already built one [Quach 21b]](https://image.slidesharecdn.com/lisa2021computingperformance-210705140333/85/Computing-Performance-On-the-Horizon-2021-9-320.jpg)
![10
Computing Performance: On the Horizon (Brendan Gregg)
Lithography
2009 2012 2014 2016 2018 2020 2022 2023
0
5
10
15
20
25
30
35
Semiconductor Nanometer Process
nm
TSMC expects volume production
of 3nm in 2022 [Quach 21a]
Source: Semiconductor device fabrication [Wikipedia 21a]
2nm
3nm
32nm
Lithography limits expected to
be reached by 2029, switching
to stacked CPUs. [Moore 20]
IBM has already built one [Quach 21b]
(it has 12nm gate length)
“Nanometer
process”
since 2010 should be
considered a
marketing term
New terms proposed include:
●
GMT (gate pitch, metal pitch, tiers)
●
LMC (logic, memory, interconnects)
[Moore 20]
BTW: Silicon atom radius ~0.1 nm [Wikipedia 21b]](https://image.slidesharecdn.com/lisa2021computingperformance-210705140333/85/Computing-Performance-On-the-Horizon-2021-10-320.jpg)
![11
Computing Performance: On the Horizon (Brendan Gregg)
Other processor scaling
Special instructions
●
E.g., AVX-512 Vector Neural Network Instructions (VNNI)
Connected chiplets
●
Using embedded multi-die interconnect bridge (EMIB) [Alcorn 17]
3D stacking](https://image.slidesharecdn.com/lisa2021computingperformance-210705140333/85/Computing-Performance-On-the-Horizon-2021-11-320.jpg)
![12
Computing Performance: On the Horizon (Brendan Gregg)
Latest server processor examples
Vendor Processor Process Clock Cores/T. LLC
Mbytes
Date
Intel Xeon Platinum
8380 (Ice Lake)
“10nm” 2.3 - 3.4 40/80 60 Apr 2021
AMD EPYC 7713P “7nm” 2.0 - 3.675 64/128 256 Mar 2021
ARM-
based
Ampere Altra
Q80-33
“7nm” 3.3 80/80 32 Dec 2020
Coming soon to a datacenter near you
(Although there is a TSMC chip shortage that may last through to 2022/2023 [Quatch 21][Ridley 21])](https://image.slidesharecdn.com/lisa2021computingperformance-210705140333/85/Computing-Performance-On-the-Horizon-2021-12-320.jpg)
![13
Computing Performance: On the Horizon (Brendan Gregg)
Amazon ARM/Graviton2
●
ARM Neoverse N1, 64 core, 2.5 GHz
Microsoft ARM
●
ARM-based something coming soon [Warren 20]
Google SoC
●
Systems-on-Chip (SoC) coming soon [Vahdat 21]
Cloud chip race
x86 AMD
Grav2
GOOG MSFT
ARM
?
Cloud processors
Generic processors](https://image.slidesharecdn.com/lisa2021computingperformance-210705140333/85/Computing-Performance-On-the-Horizon-2021-13-320.jpg)

![15
Computing Performance: On the Horizon (Brendan Gregg)
Accelerators
GPUs
●
Parallel workloads, thousands of GPU cores. Widespread adoption in machine learning.
FPGAs
●
Reprogrammable semiconductors
●
Great potential, but needs specialists to program
●
Good for algorithms: compression, cryptocurrency,
video encoding, genomics, search, etc.
●
Microsoft FPGA-based configurable cloud [Russinovich 17]
Also TPUs
●
Tensor processing units [Google 21]
CPU
GPU
FPGA
Performance potential
Ease
of
use
The “other” CPUs you
may not be monitoring](https://image.slidesharecdn.com/lisa2021computingperformance-210705140333/85/Computing-Performance-On-the-Horizon-2021-15-320.jpg)
![16
Computing Performance: On the Horizon (Brendan Gregg)
Latest GPU examples
NVIDIA GeForce RTX 3090: 10,496 CUDA cores, 2020
●
[Burnes 20]
Cerebras Gen2 WSE: 850,000 AI-optimized cores, 2021
●
Use most of the silicon wafer for one chip.
2.6 trillion transistors, 23 kW. [Trader 21]
●
Previous version was already the “Largest chip ever built,”
and US$2M. [insideHPC 20]
SM: Streaming multiprocessor
SP: Streaming processor
GPU
Cores (SPs)
Control
L1
SM
Control
L1
SM
Control
L1
SM
Control
L1
SM
...
L2 Cache](https://image.slidesharecdn.com/lisa2021computingperformance-210705140333/85/Computing-Performance-On-the-Horizon-2021-16-320.jpg)
![17
Computing Performance: On the Horizon (Brendan Gregg)
Latest FPGA examples
Xilinx Virtex UltraScale+ VU19P, 8,938,000 logic cells, 2019
●
Using 35B transistors. Also has 4.5 Tbit/s transceiver bandwidth (bidir), and 1.5 Tbit/sec DDR4 bandwidth
[Cutress 19]
Xilinx Virtex UltraScale+ VU9P, 2,586,000 logic cells, 2016
●
Deploy right now: AWS EC2 F1 instance type (up to 8 of these FPGAs per instance)
BPF (covered later) already in FPGAs
●
E.g., 400 Gbit/s packet filter FFShark [Vega 20]
FPGA](https://image.slidesharecdn.com/lisa2021computingperformance-210705140333/85/Computing-Performance-On-the-Horizon-2021-17-320.jpg)


![22
Computing Performance: On the Horizon (Brendan Gregg)
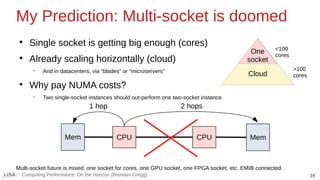
My Prediction: Core count limits
Worsening problems:
●
Memory-bound workloads
●
Kernel/app lock contention
●
False sharing
●
Power consumption
●
etc.
General-purpose computing will hit a practical core limit
●
For a given memory subsystem & kernel, and running multiple applications
●
E.g., 1024 cores (except GPUs/ML/AI)
●
Apps themselves will hit an even smaller practical limit (some already have by design, e.g., Node.js and 2 CPUs)
Source:
Figure 2.16
[Gregg 20]](https://image.slidesharecdn.com/lisa2021computingperformance-210705140333/85/Computing-Performance-On-the-Horizon-2021-22-320.jpg)

![24
Computing Performance: On the Horizon (Brendan Gregg)
My Prediction: 3 Eras of processor scaling
Practical server limits:
Era 1: Clock frequency → already reached by ~2005 (3.5 GHz)
Era 2: Core/thread count → limited by mid 2030s (e.g., 1024)
Era 3: Cache size & policy → limited by end of 2030s
Mid-century will need an entirely new computer hardware architecture, kernel memory architecture, or logic gate
technology, to progress further.
●
E.g., use of graphine, carbon nanotubes [Hruska 12]
●
This is after moving more to stacked processors](https://image.slidesharecdn.com/lisa2021computingperformance-210705140333/85/Computing-Performance-On-the-Horizon-2021-24-320.jpg)
![26
Computing Performance: On the Horizon (Brendan Gregg)
My Prediction: Cloud CPU advantage
Large cloud vendors can analyze >100,000 workloads directly
●
Via PMCs and other processor features.
Vast real-world detail to aid processor design
●
More detail than traditional processor vendors have, and detail available immediately whenever they want.
●
Will processor vendors offer their own clouds just to get the same data?
Machine-learning aided processor design
●
Based on the vast detail. Please point it at real-world workloads and not microbenchmarks.
# perf script --insn-trace --xed
date 31979 [003] 653971.670163672: ... (/lib/x86_64-linux-gnu/ld-2.27.so) mov %rsp, %rdi
date 31979 [003] 653971.670163672: ... (/lib/x86_64-linux-gnu/ld-2.27.so) callq 0x7f3bfbf4dea0
date 31979 [003] 653971.670163672: ... (/lib/x86_64-linux-gnu/ld-2.27.so) pushq %rbp
[...]
Vast detail example: processor trace showing timestamped instructions:](https://image.slidesharecdn.com/lisa2021computingperformance-210705140333/85/Computing-Performance-On-the-Horizon-2021-26-320.jpg)
![27
Computing Performance: On the Horizon (Brendan Gregg)
My Prediction: FPGA turning point
Little adoption (outside cryptocurrency) until major app support
●
Solves the ease of use issue: Developers just configure the app (which may fetch and deploy an FMI)
●
BPF use cases are welcome, but still specialized/narrow
●
Needs runtime support, e.g., the JVM. Already work in this area (e.g., [TornadoVM 21]).
JVM
JVM
FPGA
Accelerator
apt install openjdk-21
apt install openjdk-21-fpga
(none of this is real, yet)
java -XX:+UseFPGA](https://image.slidesharecdn.com/lisa2021computingperformance-210705140333/85/Computing-Performance-On-the-Horizon-2021-27-320.jpg)

![29
Computing Performance: On the Horizon (Brendan Gregg)
Many workloads memory I/O bound
# ./pmcarch 1
K_CYCLES K_INSTR IPC BR_RETIRED BR_MISPRED BMR% LLCREF LLCMISS LLC%
334937819 141680781 0.42 25744860335 536087729 2.08 1611987169 366692918 77.25
329721327 140928522 0.43 25760806599 525951093 2.04 1504594986 350931770 76.68
330388918 141393325 0.43 25821331202 484397356 1.88 1535130691 350629915 77.16
329889409 142876183 0.43 26506966225 510492279 1.93 1501785676 354458409 76.40
[...]
# ./pmcarch
K_CYCLES K_INSTR IPC BR_RETIRED BR_MISPRED BMR% LLCREF LLCMISS LLC%
122697727 13892225 0.11 2604221808 40692664 1.56 419652590 93646793 77.68
144881903 17918325 0.12 3240599094 48088436 1.48 489936685 104672186 78.64
95561140 13815722 0.14 2722513072 42575763 1.56 401658252 94214458 76.54
99311699 15034220 0.15 2815805820 41802209 1.48 386979370 84139624 78.26
[...]
# ./pmcarch 1
K_CYCLES K_INSTR IPC BR_RETIRED BR_MISPRED BMR% LLCREF LLCMISS LLC%
38222881 25412094 0.66 4692322525 91505748 1.95 780435112 117058225 85.00
40754208 26308406 0.65 5286747667 95879771 1.81 751335355 123725560 83.53
35222264 24681830 0.70 4616980753 86190754 1.87 709841242 113254573 84.05
38176994 26317856 0.69 5055959631 92760370 1.83 787333902 119976728 84.76
[...]](https://image.slidesharecdn.com/lisa2021computingperformance-210705140333/85/Computing-Performance-On-the-Horizon-2021-29-320.jpg)
![30
Computing Performance: On the Horizon (Brendan Gregg)
DDR5 has better bandwidth
DDR5 has a faster bus
●
But not width
Needs processor support
●
E.g., Intel Alder Lake / Sapphire Rapids
512GB DDR5 DIMMs
●
Already released by Samsung [Shilov 21]
Year Memory Peak Bandwidth
Gbytes/s
2000 DDR-333 2.67
2003 DDR2-800 6.4
2007 DDR3-1600 12.8
2012 DDR4-3200 25.6
2020 DDR5-6400 51.2
2000 2002 2004 2006 2008 2010 2012 2014 2016 2018 2020
0
10
20
30
40
50
60
Gbytes/s](https://image.slidesharecdn.com/lisa2021computingperformance-210705140333/85/Computing-Performance-On-the-Horizon-2021-30-320.jpg)

![32
Computing Performance: On the Horizon (Brendan Gregg)
DDR latency
Hasn’t changed in 20 years
●
This is single access latency
●
Same memory clock (200 MHz) [Greenberg 11]
●
Also see [Cutress 20][Goering 11]
Low-latency DDR does exist
●
Reduced Latency DRAM (RLDRAM) by Infineon
and Micron: lower latency but lower density
●
Not seeing widespread server use (I’ve seen it
marketed towards HFT)
Year Memory Latency (ns)
2000 DDR-333 15
2003 DDR2-800 15
2007 DDR3-1600 13.75
2012 DDR4-3200 13.75
2020 DDR5-6400 14.38
1998 2002 2006 2010 2014 2018 2022
0
2
4
6
8
10
12
14
Latency
(ns)
:-(
DDR-333 DDR5-6400](https://image.slidesharecdn.com/lisa2021computingperformance-210705140333/85/Computing-Performance-On-the-Horizon-2021-32-320.jpg)
![33
Computing Performance: On the Horizon (Brendan Gregg)
HBM
High bandwidth memory, 3D stacking
●
Target uses cases include high performance computing, and virtual reality graphical processing [Macri 15]
GPUs already use it
Can be provided on-package
●
Intel Sapphire Rapids rumored to include 64 Gbyte HBM2E [Shilov 21d]](https://image.slidesharecdn.com/lisa2021computingperformance-210705140333/85/Computing-Performance-On-the-Horizon-2021-33-320.jpg)
![34
Computing Performance: On the Horizon (Brendan Gregg)
Server DRAM size
SuperMicro SuperServer B12SPE-CPU-25G
●
Single Socket (see earlier slides)
●
16 DIMM slots
●
4 TB DDR-4
[SuperMicro 21]
Facebook Delta Lake (1S) OCP
●
6 DIMM slots
●
96 Gbytes DDR-4
●
Price/optimal for a typical WSS?
[Haken 21]
Processor
socket
DIMMs DIMMs
B12SPE-CPU-25G](https://image.slidesharecdn.com/lisa2021computingperformance-210705140333/85/Computing-Performance-On-the-Horizon-2021-34-320.jpg)
![35
Computing Performance: On the Horizon (Brendan Gregg)
Additional memory tier
3D XPoint (next section) memory mode:
- Can also operate in application direct mode and storage mode [Intel 21]
Main
memory
Persistent memory
Storage devices
DRAM (<0.1us)
3D XPoint (<1us)
SSDs (<100us)
HHDs (<1ms)](https://image.slidesharecdn.com/lisa2021computingperformance-210705140333/85/Computing-Performance-On-the-Horizon-2021-35-320.jpg)
![36
Computing Performance: On the Horizon (Brendan Gregg)
My Prediction: Extrapolation
Not a JEDEC announcement
Assumes miraculous
engineering work
●
For various challenges see [Peterson 20]
But will single-access latency
drop in DDR-6?
●
I’d guess not, DDR internals are already at
their cost-sweet-spot, leaving low-latency
for other memory technologies
Year Memory Peak Bandwidth
Gbytes/s
2000 DDR-333 2.67
2003 DDR2-800 6.4
2007 DDR3-1600 12.8
2012 DDR4-3200 25.6
2020 DDR5-6400 51.2
2028 DDR6-12800 102.4
2036 DDR7-25600 204.8
2044 DDR8-51200 409.6
doubling](https://image.slidesharecdn.com/lisa2021computingperformance-210705140333/85/Computing-Performance-On-the-Horizon-2021-36-320.jpg)


![39
Computing Performance: On the Horizon (Brendan Gregg)
My Prediction: Extra tier too late
Competition isn’t disks, it’s Tbytes of DRAM
●
SuperMicro’s single socket should hit 8 Tbytes DDR-5
●
AWS EC2 p4.24xl has 1.1 Tbytes of DRAM (deploy now!)
How often does your working set size (WSS) not fit?
Across several of these for redundancy?
●
Next tier needs to get much bigger than DRAM (10+x)
and much cheaper to find an extra-tier use case
(e.g., cost based).
●
Meanwhile, DRAM is still getting bigger and faster
●
I developed the first cache tier between main memory
and disks to see widespread use:
the ZFS L2ARC [Gregg 08]
Main
memory
Persistent memory
Storage devices
WSS
It’s more like a trapezoid
“cold”
data
?
<0.1us
<1us
<100
us](https://image.slidesharecdn.com/lisa2021computingperformance-210705140333/85/Computing-Performance-On-the-Horizon-2021-39-320.jpg)

![41
Computing Performance: On the Horizon (Brendan Gregg)
Recent timeline for rotational disks
2005: Perpendicular magnetic recording (PMR)
●
Writes vertically using a shaped magnetic field for higher density
2013: Shingled magnetic recording (SMR)
●
(next slide)
2019: Multi-actuator technology (MAT)
●
Two sets of heads and actuators; like 2-drive RAID 0 [Alcorn 17].
2020: Energy-assisted magnetic recording (EAMR)
●
Western Digital 18TB & 20TB [Salter 20]
2021: Heat-assisted magnetic recording (HAMR)
●
Seagate 20TB HAMR drives [Shilov 21b]](https://image.slidesharecdn.com/lisa2021computingperformance-210705140333/85/Computing-Performance-On-the-Horizon-2021-41-320.jpg)
![42
Computing Performance: On the Horizon (Brendan Gregg)
Recent timeline for rotational disks
2005: Perpendicular magnetic recording (PMR)
●
Writes vertically using a shaped magnetic field for higher density
2013: Shingled magnetic recording (SMR)
●
(next slide)
2019: Multi-actuator technology (MAT)
●
Two sets of heads and actuators; like 2-drive RAID 0 [Alcorn 17].
2020: Energy-assisted magnetic recording (EAMR)
●
Western Digital 18TB & 20TB [Salter 20]
2021: Heat-assisted magnetic recording (HAMR)
●
Seagate 20TB HAMR drives [Shilov 21b]
I don’t know their perf characteristics yet](https://image.slidesharecdn.com/lisa2021computingperformance-210705140333/85/Computing-Performance-On-the-Horizon-2021-42-320.jpg)
![43
Computing Performance: On the Horizon (Brendan Gregg)
SMR
11-25% more storage, worse performance
●
Writes tracks in an overlapping way, like shingles on a roof. [Shimpi 13]
●
Overwritten data must be rewritten. Suited for archival (write once) workloads.
Look out for 18TB/20TB-with-SMR drive releases
Written tracks
Read head](https://image.slidesharecdn.com/lisa2021computingperformance-210705140333/85/Computing-Performance-On-the-Horizon-2021-43-320.jpg)
![44
Computing Performance: On the Horizon (Brendan Gregg)
Flash memory-based disks
Single-Level Cell (SLC)
Multi-Level Cell (MLC)
Enterprise MLC (eMLC)
2009: Tri-Level Cell (TLC)
2009: Quad-Level Cell (QLC)
●
QLC is only rated for around 1,000 block-erase cycles [Liu 20].
2013: 3D NAND / Vertical NAND (V-NAND)
●
SK Hynix envisions 600-Layer 3D NAND [Shilov 21c]. Should be multi-Tbyte.
SSD performance pathologies: latency from aging, wear-leveling, fragmentation, internal compression, etc.](https://image.slidesharecdn.com/lisa2021computingperformance-210705140333/85/Computing-Performance-On-the-Horizon-2021-44-320.jpg)
![45
Computing Performance: On the Horizon (Brendan Gregg)
Persistent memory-based disks
2017: 3D XPoint (Intel/Micron) Optane
●
Low and consistent latency (e.g., 14 us access latency) [Hady 18]
●
App-direct mode, memory mode, and as storage
Wordlines Memory cells Bitlines
+ + =
Cell selection
DRAM: Trapped electrons in a capacitor, requires refreshing
3D XPoint: Resistance change; layers of wordlines+cells+bitlines keep stacking vertically
3D XPoint
...](https://image.slidesharecdn.com/lisa2021computingperformance-210705140333/85/Computing-Performance-On-the-Horizon-2021-45-320.jpg)

![47
Computing Performance: On the Horizon (Brendan Gregg)
Storage Interconnects
SAS-4 cards in development
●
(Storage attached SCSI)
PCIe 5.0 coming soon
●
(Peripheral Component Interconnect Express)
●
Intel already demoed on Sapphire Rapids [Hruska 20]
NVMe 1.4 latest
●
(Non-Volatile Memory Express)
●
Storage over PCIe bus
●
Support zoned namespace SSDs (ZNS) [ZonedStorage 21]
●
Bandwidth bounded by PCIe bus
These have features other than speed
●
Reliability, power management, virtualization support, etc.
Year
Specified
Interface Bandwidth
Gbit/s
2003 SAS-1 3
2009 SAS-2 6
2012 SAS-3 12
2017 SAS-4 22.5
202? SAS-5 45
Year
Specified
Interface Bandwidth 16
lane Gbyte/s
2003 PCIe 1 4
2007 PCIe 2 8
2010 PCIe 3 16
2017 PCIe 4 31.5
2019 PCIe 5 63](https://image.slidesharecdn.com/lisa2021computingperformance-210705140333/85/Computing-Performance-On-the-Horizon-2021-47-320.jpg)
![48
Computing Performance: On the Horizon (Brendan Gregg)
Linux Kyber I/O scheduler
Multi-queue, target read & write latency
●
Up to 300x lower 99th percentile latencies [Gregg 18]
●
Linux 4.12 [Corbet 17]
reads (sync) dispatch
writes (async) dispatch
completions
queue size adjust
Kyber (simplified)](https://image.slidesharecdn.com/lisa2021computingperformance-210705140333/85/Computing-Performance-On-the-Horizon-2021-48-320.jpg)


![53
Computing Performance: On the Horizon (Brendan Gregg)
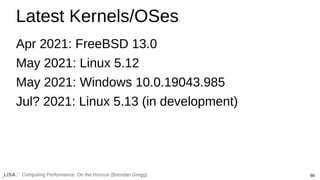
Latest Hardware
400 Gbit/s in use
●
E.g., 400 Gbit/s switches/routers by Cisco and Juniper, tranceivers by Arista and Intel
●
AWS EC2 P4 instance type (deploy now!)
●
On PCI, needs PCIe 5
800 Gbit/s next
●
[Charlene 20]
●
Terabit Ethernet (1 Tbit/s) not far away
More NIC features
●
E.g., inline kTLS (TLS offload to the NIC), e.g., Mellanox ConnectX-6-Dx [Gallatin 19]](https://image.slidesharecdn.com/lisa2021computingperformance-210705140333/85/Computing-Performance-On-the-Horizon-2021-53-320.jpg)
![54
Computing Performance: On the Horizon (Brendan Gregg)
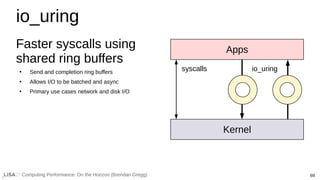
Protocols
QUIC / HTTP/3
●
TCP-like sessions over (fast) UDP.
●
0-RTT connection handshakes. For clients that have previously communicated.
MP-TCP
●
Multipath TCP. Use multiple paths in parallel to improve throughput and reliability. RFC-8684 [Ford 20]
●
Linux support starting in 5.6.](https://image.slidesharecdn.com/lisa2021computingperformance-210705140333/85/Computing-Performance-On-the-Horizon-2021-54-320.jpg)
![55
Computing Performance: On the Horizon (Brendan Gregg)
Linux TCP Congestion Control Algorithms
DCTCP
●
Data Center TCP. Linux 3.18. [Borkmann 14]
TCP NV
●
New Vegas. Linux 4.8
TCP BBR
●
Bottleneck Bandwidth and RTT (BBR) improves performance on packet loss networks [Cardwell 16]
●
With 1% packet loss, Netflix sees 3x better throughput [Gregg 18]](https://image.slidesharecdn.com/lisa2021computingperformance-210705140333/85/Computing-Performance-On-the-Horizon-2021-55-320.jpg)
![56
Computing Performance: On the Horizon (Brendan Gregg)
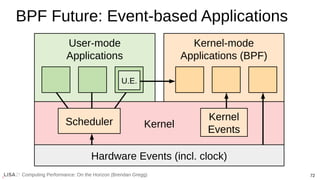
Linux Network Stack
Queues/
Tuning
Source: Systems Performance 2nd
Edition, Figure 10.8 [Gregg 20]](https://image.slidesharecdn.com/lisa2021computingperformance-210705140333/85/Computing-Performance-On-the-Horizon-2021-56-320.jpg)
![57
Computing Performance: On the Horizon (Brendan Gregg)
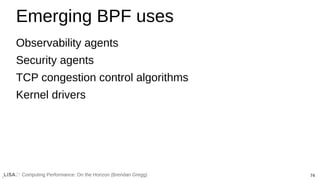
Linux TCP send path
Keeps adding performance features
Source: Systems Performance 2nd
Edition, Figure 10.11 [Gregg 20]](https://image.slidesharecdn.com/lisa2021computingperformance-210705140333/85/Computing-Performance-On-the-Horizon-2021-57-320.jpg)


![63
Computing Performance: On the Horizon (Brendan Gregg)
Latest Java
Sep 2018: Java 11 (LTS)
●
JEP 333 ZGC A Scalable Low-Latency Garbage Collector
●
JEP 331 Low-Overhead Heap Profiling
●
GC adaptive thread scaling
Sep 2021: Java 17 (LTS)
●
JEP 338: Vector API (JDK16)
●
Parallel GC improvements (JDK14)
●
Various other perf improvements (JDK12-17)
Java 11 includes JMH JDK microbenchmarks
[Redestad 19]](https://image.slidesharecdn.com/lisa2021computingperformance-210705140333/85/Computing-Performance-On-the-Horizon-2021-63-320.jpg)

![67
Computing Performance: On the Horizon (Brendan Gregg)
Recent Linux perf features
2021: Syscall user dispatch (5.11)
2020: Static calls to improve Spectre-fix (5.10)
2020: BPF on socket lookups (5.9)
2020: Thermal pressure (5.7)
2020: MultiPath TCP (5.6)
2019: MADV_COLD, MADV_PAGEOUT (5.4)
2019: io_uring (5.1)
2019: UDP GRO (5.0)
2019: Multi-queue I/O default (5.0)
2018: TCP EDT (4.20)
2018: PSI (4.20)
For 2016-2018, see my summary: [Gregg 18].
Includes CPU schedulers (thermal, topology);
Block I/O qdiscs; Kyber scheduler (earlier slide);
TCP congestion control algoritms (earlier slide); etc.](https://image.slidesharecdn.com/lisa2021computingperformance-210705140333/85/Computing-Performance-On-the-Horizon-2021-67-320.jpg)
![68
Computing Performance: On the Horizon (Brendan Gregg)
Recent Linux perf features
2021: Syscall user dispatch (5.11)
2020: Static calls to improve Spectre-fix (5.10)
2020: BPF on socket lookups (5.9)
2020: Thermal pressure (5.7)
2020: MultiPath TCP (5.6)
2019: MADV_COLD, MADV_PAGEOUT (5.4)
2019: io_uring (5.1)
2019: UDP GRO (5.0)
2019: Multi-queue I/O default (5.0)
2018: TCP EDT (4.20)
2018: PSI (4.20)
For 2016-2018, see my summary: [Gregg 18].
Includes CPU schedulers (thermal, topology);
Block I/O qdiscs; Kyber scheduler (earlier slide);
TCP congestion control algoritms (earlier slide); etc.](https://image.slidesharecdn.com/lisa2021computingperformance-210705140333/85/Computing-Performance-On-the-Horizon-2021-68-320.jpg)
![70
Computing Performance: On the Horizon (Brendan Gregg)
eBPF Everywhere
[Thaler 21]
Plus eBPF for BSD projects already started.](https://image.slidesharecdn.com/lisa2021computingperformance-210705140333/85/Computing-Performance-On-the-Horizon-2021-70-320.jpg)


![76
Computing Performance: On the Horizon (Brendan Gregg)
My Prediction: Kernels become JITed
PGO/AutoFDO shows ~10% wins, but hard to manage
●
Performance-guided optimization (PGO) / Auto feedback-directed optimization (AutoFDO)
●
Some companies already do kernel PGO (Google [Tolvanen 20], Microsoft [Bearman 20])
●
We can't leave 10% on the table forever
Kernels PGO/JIT support by default, so it “just works.”](https://image.slidesharecdn.com/lisa2021computingperformance-210705140333/85/Computing-Performance-On-the-Horizon-2021-76-320.jpg)
![78
Computing Performance: On the Horizon (Brendan Gregg)
My Prediction: OS performance
Linux: increasing complexity & worse perf defaults
●
Becomes so complex that it takes an OS team to make it perform well. This assumes that the defaults rot,
because no perf teams are running the defaults anymore to notice (e.g., high-speed network engineers
configure XDP and QUIC, and aren’t looking at defaults with TCP). A bit more room for a lightweight kernel
(e.g., BSD) with better perf defaults to compete. Similarities: Oracle DB vs MySQL; MULTICS vs UNIX.
BSD: high perf for narrow uses
●
Still serving some companies (including Netflix) very well thanks to tuned performance (see footnote on p124 of
[Gregg 20]). Path to growth is better EC2/Azure performance support, but it may take years before a big
customer (with a perf team) migrates and gets everything fixed. There are over a dozen of perf engineers
working on Linux on EC2; BSD needs at least one full time senior EC2 (not metal) perf engineer.
Windows: community perf improvements
●
BPF tracing support allows outsiders to root cause kernel problems like never before (beyond ETW/Xperf). Will
have a wave of finding “low hanging fruit” to begin with, improving perf and reliability.](https://image.slidesharecdn.com/lisa2021computingperformance-210705140333/85/Computing-Performance-On-the-Horizon-2021-78-320.jpg)
![79
Computing Performance: On the Horizon (Brendan Gregg)
My Prediction: Unikernels
Finally gets one compelling published use case
“2x perf for X”
But few people run X
●
Needs to be really kernel heavy, and not many workloads are. And there’s already a lot of competition for
reducing kernel overhead (BPF, io_uring, FPGAs, DPDK, etc.)
●
Once one use case is found, it may form a valuable community around X and Unikernels. But it needs the
published use case to start, preferably from a FAANG.
●
Does need to be 2x or more, not 20%, to overcome the cost of retooling everything, redoing all observability
metrics, profilers, etc. It’s not impossible, but not easy [Gregg 16].
●
More OS-research-style wins found from hybrid- and micro-kernels.](https://image.slidesharecdn.com/lisa2021computingperformance-210705140333/85/Computing-Performance-On-the-Horizon-2021-79-320.jpg)

![81
Computing Performance: On the Horizon (Brendan Gregg)
Containers
Cgroup v2 rollout
Container scheduler adoption
●
Kubernetes, OpenStack, and more
●
Netflix develops its own called “Titus” [Joshi 18]
●
Price/performance gains: “Tetris packing” workloads without too much interference (clever scheduler)
Many perf tools still not “container aware”
●
Usage in a container not restricted to the container, or not permitted by default (needs CAP_PERFMON
CAP_SYS_PTRACE, CAP_SYS_ADMIN)](https://image.slidesharecdn.com/lisa2021computingperformance-210705140333/85/Computing-Performance-On-the-Horizon-2021-81-320.jpg)
![82
Computing Performance: On the Horizon (Brendan Gregg)
Hardware Hypervisors
Source: Systems Performance 2nd
Edition, Figure 11.17 [Gregg 20]](https://image.slidesharecdn.com/lisa2021computingperformance-210705140333/85/Computing-Performance-On-the-Horizon-2021-82-320.jpg)
![83
Computing Performance: On the Horizon (Brendan Gregg)
VM Improvements
Source:
[Gregg 17]](https://image.slidesharecdn.com/lisa2021computingperformance-210705140333/85/Computing-Performance-On-the-Horizon-2021-83-320.jpg)
![84
Computing Performance: On the Horizon (Brendan Gregg)
Lightweight VMs
Source: Systems Performance 2nd
Edition, Figure 11.4 [Gregg 20]
E.g., AWS “Firecracker”](https://image.slidesharecdn.com/lisa2021computingperformance-210705140333/85/Computing-Performance-On-the-Horizon-2021-84-320.jpg)


![90
Computing Performance: On the Horizon (Brendan Gregg)
USENIX LISA 2010: Heat maps
2021: Latency heat maps everywhere
[Gregg 10]](https://image.slidesharecdn.com/lisa2021computingperformance-210705140333/85/Computing-Performance-On-the-Horizon-2021-90-320.jpg)
![91
Computing Performance: On the Horizon (Brendan Gregg)
USENIX LISA 2013: Flame graphs
2021: Flame graphs everywhere
[Gregg 13]](https://image.slidesharecdn.com/lisa2021computingperformance-210705140333/85/Computing-Performance-On-the-Horizon-2021-91-320.jpg)
![92
Computing Performance: On the Horizon (Brendan Gregg)
USENIX LISA 2016: BPF
2021: BPF heading everywhere
[Gregg 16b]](https://image.slidesharecdn.com/lisa2021computingperformance-210705140333/85/Computing-Performance-On-the-Horizon-2021-92-320.jpg)


![Computing Performance: On the Horizon (Brendan Gregg) 97
Example BPF tool
# execsnoop.py -T
TIME(s) PCOMM PID PPID RET ARGS
0.506 run 8745 1828 0 ./run
0.507 bash 8745 1828 0 /bin/bash
0.511 svstat 8747 8746 0 /command/svstat /service/httpd
0.511 perl 8748 8746 0 /usr/bin/perl -e $l=<>;$l=~/(d+) sec/;p...
0.514 ps 8750 8749 0 /bin/ps --ppid 1 -o pid,cmd,args
0.514 grep 8751 8749 0 /bin/grep org.apache.catalina
0.514 sed 8752 8749 0 /bin/sed s/^ *//;
0.515 xargs 8754 8749 0 /usr/bin/xargs
0.515 cut 8753 8749 0 /usr/bin/cut -d -f 1
0.523 echo 8755 8754 0 /bin/echo
0.524 mkdir 8756 8745 0 /bin/mkdir -v -p /data/tomcat
[...]
1.528 run 8785 1828 0 ./run
1.529 bash 8785 1828 0 /bin/bash
1.533 svstat 8787 8786 0 /command/svstat /service/httpd
1.533 perl 8788 8786 0 /usr/bin/perl -e $l=<>;$l=~/(d+) sec/;p...
[...]](https://image.slidesharecdn.com/lisa2021computingperformance-210705140333/85/Computing-Performance-On-the-Horizon-2021-97-320.jpg)
![Computing Performance: On the Horizon (Brendan Gregg) 98
Example bpftrace one-liner
# bpftrace -e 't:block:block_rq_issue { @[args->rwbs] = count(); }'
Attaching 1 probe...
^C
@[R]: 1
@[RM]: 1
@[WFS]: 2
@[FF]: 3
@[WSM]: 9
@[RA]: 10
@[WM]: 12
@[WS]: 29
@[R]: 107](https://image.slidesharecdn.com/lisa2021computingperformance-210705140333/85/Computing-Performance-On-the-Horizon-2021-98-320.jpg)
![Computing Performance: On the Horizon (Brendan Gregg) 99
libbpf-tools
# ./opensnoop
PID COMM FD ERR PATH
27974 opensnoop 28 0 /etc/localtime
1482 redis-server 7 0 /proc/1482/stat
[…]
# ldd opensnoop
linux-vdso.so.1 (0x00007ffddf3f1000)
libelf.so.1 => /usr/lib/x86_64-linux-gnu/libelf.so.1 (0x00007f9fb7836000)
libz.so.1 => /lib/x86_64-linux-gnu/libz.so.1 (0x00007f9fb7619000)
libc.so.6 => /lib/x86_64-linux-gnu/libc.so.6 (0x00007f9fb7228000)
/lib64/ld-linux-x86-64.so.2 (0x00007f9fb7c76000)
# ls -lh opensnoop opensnoop.stripped
-rwxr-xr-x 1 root root 645K Feb 28 23:18 opensnoop
-rwxr-xr-x 1 root root 151K Feb 28 23:33 opensnoop.stripped
●
151 Kbytes for a stand-alone BPF program!
●
(Note: A static bpftrace/BTF + scripts will also have a small average tool size)](https://image.slidesharecdn.com/lisa2021computingperformance-210705140333/85/Computing-Performance-On-the-Horizon-2021-99-320.jpg)
![100
Computing Performance: On the Horizon (Brendan Gregg)
Modern Observability Stack
OpenTelemetry
●
Standard for monitoring and tracing
Prometheus
●
Monitoring database
Grafana
●
UI with dashboards
Source: Figure 1.4 [Gregg 20]
Grafana](https://image.slidesharecdn.com/lisa2021computingperformance-210705140333/85/Computing-Performance-On-the-Horizon-2021-100-320.jpg)


![Computing Performance: On the Horizon (Brendan Gregg) 104
My Prediction: Flame scope adoption
[Spier 20]
Subsecond-offset heat map
Flame graph
Analyze variance, perturbations:](https://image.slidesharecdn.com/lisa2021computingperformance-210705140333/85/Computing-Performance-On-the-Horizon-2021-104-320.jpg)


![Computing Performance: On the Horizon (Brendan Gregg) 107
References
[Gregg 08] Brendan Gregg, “ZFS L2ARC,” http://www.brendangregg.com/blog/2008-07-22/zfs-l2arc.html, Jul 2008
[Gregg 10] Brendan Gregg, “Visualizations for Performance Analysis (and More),”
https://www.usenix.org/conference/lisa10/visualizations-performance-analysis-and-more, 2010
[Greenberg 11] Marc Greenberg, “DDR4: Double the speed, double the latency? Make sure your system can handle next-generation
DRAM,” https://www.chipestimate.com/DDR4-Double-the-speed-double-the-latencyMake-sure-your-system-can-handle-
next-generation-DRAM/Cadence/Technical-Article/2011/11/22, Nov 2011
[Hruska 12] Joel Hruska, “The future of CPU scaling: Exploring options on the cutting edge,”
https://www.extremetech.com/computing/184946-14nm-7nm-5nm-how-low-can-cmos-go-it-depends-if-you-ask-the-
engineers-or-the-economists, Feb 2012
[Gregg 13] Brendan Gregg, “Blazing Performance with Flame Graphs,”
https://www.usenix.org/conference/lisa13/technical-sessions/plenary/gregg, 2013
[Shimpi 13] Anand Lal Shimpi, “Seagate to Ship 5TB HDD in 2014 using Shingled Magnetic Recording,”
https://www.anandtech.com/show/7290/seagate-to-ship-5tb-hdd-in-2014-using-shingled-magnetic-recording, Sep 2013
[Borkmann 14] Daniel Borkmann, “net: tcp: add DCTCP congestion control algorithm,”
https://git.kernel.org/pub/scm/linux/kernel/git/torvalds/linux.git/commit/?
id=e3118e8359bb7c59555aca60c725106e6d78c5ce, 2014
[Macri 15] Joe Macri, “Introducing HBM,” https://www.amd.com/en/technologies/hbm, Jul 2015
[Cardwell 16] Neal Cardwell, et al., “BBR: Congestion-Based Congestion Control,” https://queue.acm.org/detail.cfm?id=3022184,
2016
[Gregg 16] Brendan Gregg, “Unikernel Profiling: Flame Graphs from dom0,” http://www.brendangregg.com/blog/2016-01-27/unikernel-
profiling-from-dom0.html, Jan 2016](https://image.slidesharecdn.com/lisa2021computingperformance-210705140333/85/Computing-Performance-On-the-Horizon-2021-107-320.jpg)
![Computing Performance: On the Horizon (Brendan Gregg) 108
References (2)
[Gregg 16b] Brendan Gregg, “Linux 4.X Tracing Tools: Using BPF Superpowers,”
https://www.usenix.org/conference/lisa16/conference-program/presentation/linux-4x-tracing-tools-using-bpf-superpowers,
2016
[Alcorn 17] Paul Alcorn, “Seagate To Double HDD Speed With Multi-Actuator Technology,” https://www.tomshardware.com/news/hdd-
multi-actuator-heads-seagate,36132.html, 2017
[Alcorn 17b] Paul Alcorn, “Hot Chips 2017: Intel Deep Dives Into EMIB,” https://www.tomshardware.com/news/intel-emib-interconnect-
fpga-chiplet,35316.html#xenforo-comments-3112212, 2017
[Corbet 17] Jonathan Corbet, “Two new block I/O schedulers for 4.12,” https://lwn.net/Articles/720675, Apr 2017
[Gregg 17] Brendan Gregg, “AWS EC2 Virtualization 2017: Introducing Nitro,” http://www.brendangregg.com/blog/2017-11-29/aws-
ec2-virtualization-2017.html, Nov 2017
[Russinovich 17] Mark Russinovich, “Inside the Microsoft FPGA-based configurable cloud,”
https://www.microsoft.com/en-us/research/video/inside-microsoft-fpga-based-configurable-cloud, 2017
[Gregg 18] Brendan Gregg, “Linux Performance 2018,” http://www.brendangregg.com/Slides/Percona2018_Linux_Performance.pdf,
2018
[Hady 18] Frank Hady, “Achieve Consistent Low Latency for Your Storage-Intensive Workloads,”
https://www.intel.com/content/www/us/en/architecture-and-technology/optane-technology/low-latency-for-storage-
intensive-workloads-article-brief.html, 2018
[Joshi 18] Amit Joshi, et al., “Titus, the Netflix container management platform, is now open source,” https://netflixtechblog.com/titus-
the-netflix-container-management-platform-is-now-open-source-f868c9fb5436, Apr 2018](https://image.slidesharecdn.com/lisa2021computingperformance-210705140333/85/Computing-Performance-On-the-Horizon-2021-108-320.jpg)
![Computing Performance: On the Horizon (Brendan Gregg) 109
References (3)
[Cutress 19] Dr. Ian Cutress, “Xilinx Announces World Largest FPGA: Virtex Ultrascale+ VU19P with 9m Cells,”
https://www.anandtech.com/show/14798/xilinx-announces-world-largest-fpga-virtex-ultrascale-vu19p-with-9m-cells, Aug
2019
[Gallatin 19] Drew Gallatin, “Kernel TLS and hardware TLS offload in FreeBSD 13,”
https://people.freebsd.org/~gallatin/talks/euro2019-ktls.pdf, 2019
[Redestad 19] Claes Redestad, Staffan Friberg, Aleksey Shipilev, “JEP 230: Microbenchmark Suite,” http://openjdk.java.net/jeps/230,
updated 2019
[Bearman 20] Ian Bearman, “Exploring Profile Guided Optimization of the Linux Kernel,”
https://linuxplumbersconf.org/event/7/contributions/771, 2020
[Burnes 20] Andrew Burnes, “GeForce RTX 30 Series Graphics Cards: The Ultimate Play,”
https://www.nvidia.com/en-us/geforce/news/introducing-rtx-30-series-graphics-cards, Sep 2020
[Charlene 20] Charlene, “800G Is Coming: Set Pace to More Higher Speed Applications,” https://community.fs.com/blog/800-gigabit-
ethernet-and-optics.html, May 2020
[Cutress 20] Dr. Ian Cutress, “Insights into DDR5 Sub-timings and Latencies,” https://www.anandtech.com/show/16143/insights-into-
ddr5-subtimings-and-latencies, Oct 2020
[Ford 20] A. Ford, et al., “TCP Extensions for Multipath Operation with Multiple Addresses,”
https://datatracker.ietf.org/doc/html/rfc8684, Mar 2020
[Gregg 20] Brendan Gregg, “Systems Performance: Enterprise and the Cloud, Second Edition,” Addison-Wesley, 2020
[Hruska 20] Joel Hruska, “Intel Demos PCIe 5.0 on Upcoming Sapphire Rapids CPUs,”
https://www.extremetech.com/computing/316257-intel-demos-pcie-5-0-on-upcoming-sapphire-rapids-cpus,
Oct 2020](https://image.slidesharecdn.com/lisa2021computingperformance-210705140333/85/Computing-Performance-On-the-Horizon-2021-109-320.jpg)
![Computing Performance: On the Horizon (Brendan Gregg) 110
References (4)
[Liu 20] Linda Liu, “Samsung QVO vs EVO vs PRO: What’s the Difference? [Clone Disk],” https://www.partitionwizard.com/clone-
disk/samsung-qvo-vs-evo.html, 2020
[Moore 20] Samuel K. Moore, “A Better Way to Measure Progress in Semiconductors,”
https://spectrum.ieee.org/semiconductors/devices/a-better-way-to-measure-progress-in-semiconductors, Jul 2020
[Peterson 20] Zachariah Peterson, “DDR5 vs. DDR6: Here's What to Expect in RAM Modules,” https://resources.altium.com/p/ddr5-
vs-ddr6-heres-what-expect-ram-modules, Nov 2020
[Salter 20] Jim Salter, “Western Digital releases new 18TB, 20TB EAMR drives,” https://arstechnica.com/gadgets/2020/07/western-
digital-releases-new-18tb-20tb-eamr-drives, Jul 2020
[Spier 20] Martin Spier, Brendan Gregg, et al., “FlameScope,” https://github.com/Netflix/flamescope, 2020
[Tolvanen 20] Sami Tolvanen, Bill Wendling, and Nick Desaulniers, “LTO, PGO, and AutoFDO in the Kernel,” Linux Plumber’s
Conference, https://linuxplumbersconf.org/event/7/contributions/798, 2020
[Vega 20] Juan Camilo Vega, Marco Antonio Merlini, Paul Chow, “FFShark: A 100G FPGA Implementation of BPF Filtering for
Wireshark,” IEEE 28th Annual International Symposium on Field-Programmable Custom Computing Machines (FCCM),
2020
[Warren 20] Tom Warren, “Microsoft reportedly designing its own ARM-based chips for servers and Surface PCs,”
https://www.theverge.com/2020/12/18/22189450/microsoft-arm-processors-chips-servers-surface-report, Dec 2020
[Google 21] Google, “Cloud TPU,” https://cloud.google.com/tpu, 2021
[Haken 21] Michael Haken, et al., “Delta Lake 1S Server Design Specification 1v05, https://www.opencompute.org/documents/delta-
lake-1s-server-design-specification-1v05-pdf, 2021
[Intel 21] Intel corporation, “Intel® OptaneTM Technology,” https://www.intel.com/content/www/us/en/products/docs/storage/optane-
technology-brief.html, 2021](https://image.slidesharecdn.com/lisa2021computingperformance-210705140333/85/Computing-Performance-On-the-Horizon-2021-110-320.jpg)
![Computing Performance: On the Horizon (Brendan Gregg) 111
References (5)
[Quach 21a] Katyanna Quach, “Global chip shortage probably won't let up until 2023, warns TSMC: CEO 'still expects capacity to
tighten more',” https://www.theregister.com/2021/04/16/tsmc_chip_forecast, Apr 2021
[Quach 21b] Katyanna Quach, “IBM says it's built the world's first 2nm semiconductor chips,”
https://www.theregister.com/2021/05/06/ibm_2nm_semiconductor_chips, May 2021
[Ridley 21] Jacob Ridley, “IBM agrees with Intel and TSMC: this chip shortage isn't going to end anytime soon,”
https://www.pcgamer.com/ibm-agrees-with-intel-and-tsmc-this-chip-shortage-isnt-going-to-end-anytime-soon, May 2021
[Shilov 21] Anton Shilov, “Samsung Develops 512GB DDR5 Module with HKMG DDR5 Chips,”
https://www.tomshardware.com/news/samsung-512gb-ddr5-memory-module, Mar 2021
[Shilov 21b] Anton Shilov, “Seagate Ships 20TB HAMR HDDs Commercially, Increases Shipments of Mach.2 Drives,”
https://www.tomshardware.com/news/seagate-ships-hamr-hdds-increases-dual-actuator-shipments, 2021
[Shilov 21c] Anton Shilov, “SK Hynix Envisions 600-Layer 3D NAND & EUV-Based DRAM,” https://www.tomshardware.com/news/sk-
hynix-600-layer-3d-nand-euv-dram, Mar 2021
[Shilov 21d] Anton Shilov, “Sapphire Rapids Uncovered: 56 Cores, 64GB HBM2E, Multi-Chip Design,”
https://www.tomshardware.com/news/intel-sapphire-rapids-xeon-scalable-specifications-and-features, Apr 2021
[SuperMicro 21] SuperMicro, “B12SPE-CPU-25G (For SuperServer Only),”
https://www.supermicro.com/en/products/motherboard/B12SPE-CPU-25G, 2021
[Thaler 21] Dave Thaler, Poorna Gaddehosur, “Making eBPF work on Windows,”
https://cloudblogs.microsoft.com/opensource/2021/05/10/making-ebpf-work-on-windows, May 2021
[TornadoVM 21] TornadoVM, “TornadoVM Run your software faster and simpler!” https://www.tornadovm.org, 2021](https://image.slidesharecdn.com/lisa2021computingperformance-210705140333/85/Computing-Performance-On-the-Horizon-2021-111-320.jpg)
![Computing Performance: On the Horizon (Brendan Gregg) 112
References (6)
[Trader 21] Tiffany Trader, “Cerebras Second-Gen 7nm Wafer Scale Engine Doubles AI Performance Over First-Gen Chip ,”
https://www.enterpriseai.news/2021/04/21/latest-cerebras-second-gen-7nm-wafer-scale-engine-doubles-ai-performance-
over-first-gen-chip, Apr 2021
[Vahdat 21] Amin Vahdat, “The past, present and future of custom compute at Google,”
https://cloud.google.com/blog/topics/systems/the-past-present-and-future-of-custom-compute-at-google, Mar 2021
[Wikipedia 21] “Semiconductor device fabrication,” https://en.wikipedia.org/wiki/Semiconductor_device_fabrication, 2021
[Wikipedia 21b] “Silicon,” https://en.wikipedia.org/wiki/Silicon, 2021
[ZonedStorage 21] Zoned Storage, “Zoned Namespaces (ZNS) SSDs,” https://zonedstorage.io/introduction/zns, 2021](https://image.slidesharecdn.com/lisa2021computingperformance-210705140333/85/Computing-Performance-On-the-Horizon-2021-112-320.jpg)


Brendan Gregg's talk at USENIX highlights predictions and trends in computing performance, focusing on processors, memory, disks, and networking while noting the challenges in scaling. He emphasizes the limitations of current technology, such as the stagnation of clock rates and the shift toward horizontal scaling with more CPU cores. The future of multi-socket systems and the integration of accelerators like FPGAs and GPUs are discussed, alongside the evolving landscape of cloud-based computing and machine learning's impact on processor design.