Download as PDF, PPTX
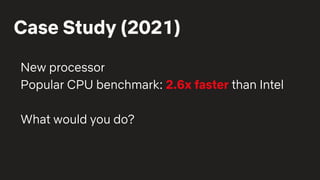

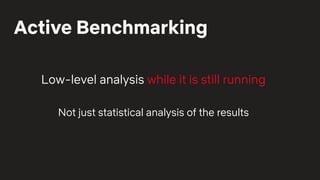
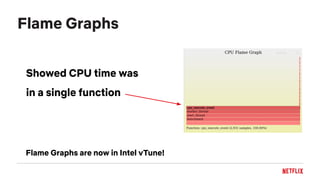
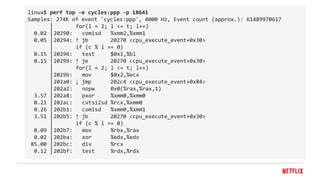
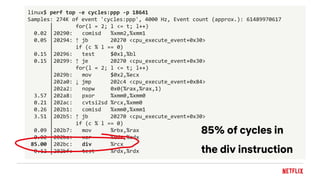
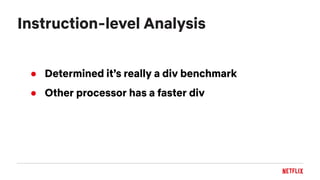
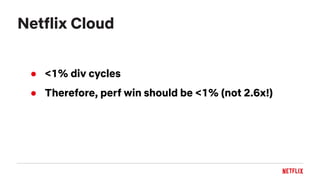
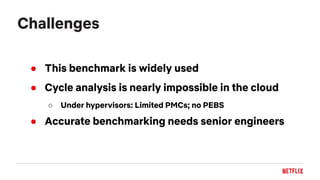
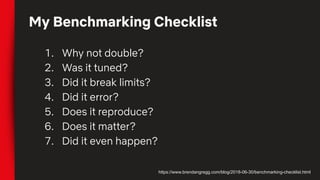

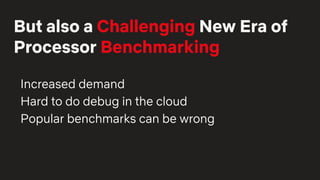


The document discusses challenges with processor benchmarking and provides recommendations. It summarizes a case study where a popular CPU benchmark claimed a new processor was 2.6x faster than Intel, but detailed analysis found the benchmark was testing division speed, which accounted for only 0.1% of cycles on Netflix servers. The document advocates for low-level, active benchmarking and profiling over statistical analysis. It also provides a checklist for evaluating benchmarks and cautions that increased processor complexity and cloud environments make accurate benchmarking more difficult.


![[IGC2018] AMD Don Woligroski - WHY Ryzen](https://cdn.slidesharecdn.com/ss_thumbnails/igc2018amddonwoligroski-whyryzen-181023014303-thumbnail.jpg?width=640&height=640&fit=bounds)


![Getting Started with Apache Spark: Big Data Made Simple [Free Meetup]](https://cdn.slidesharecdn.com/ss_thumbnails/apachesparkgettingstarted-260203175547-8361bcc3-thumbnail.jpg?width=640&height=640&fit=bounds)


