Linux Performance Profiling
and Monitoring
Werner Fischer & Georg Schönberger
@wefinet
2
Thomas-Krenn.AG
_ A server manufacturer
in Bavaria, Germany
_ Well visited knowledge base,
Thomas-Krenn Wiki (parts in English)
3
Agenda
_ Collect Statistics
_ Sysstat Package
_ mpstat, vmstat,
pidstat, iostat
_ dstat, nicstat
_ sar, atop
_ Percona Cacti Template
_ Monitoring Plugins
_ Watch online
_ top
_ iotop
_ iftop
_ Tracing
_ perf_events
_ ftrace
_ perf-tools
_ Flame graphs
# find / -type f -name statistics
4
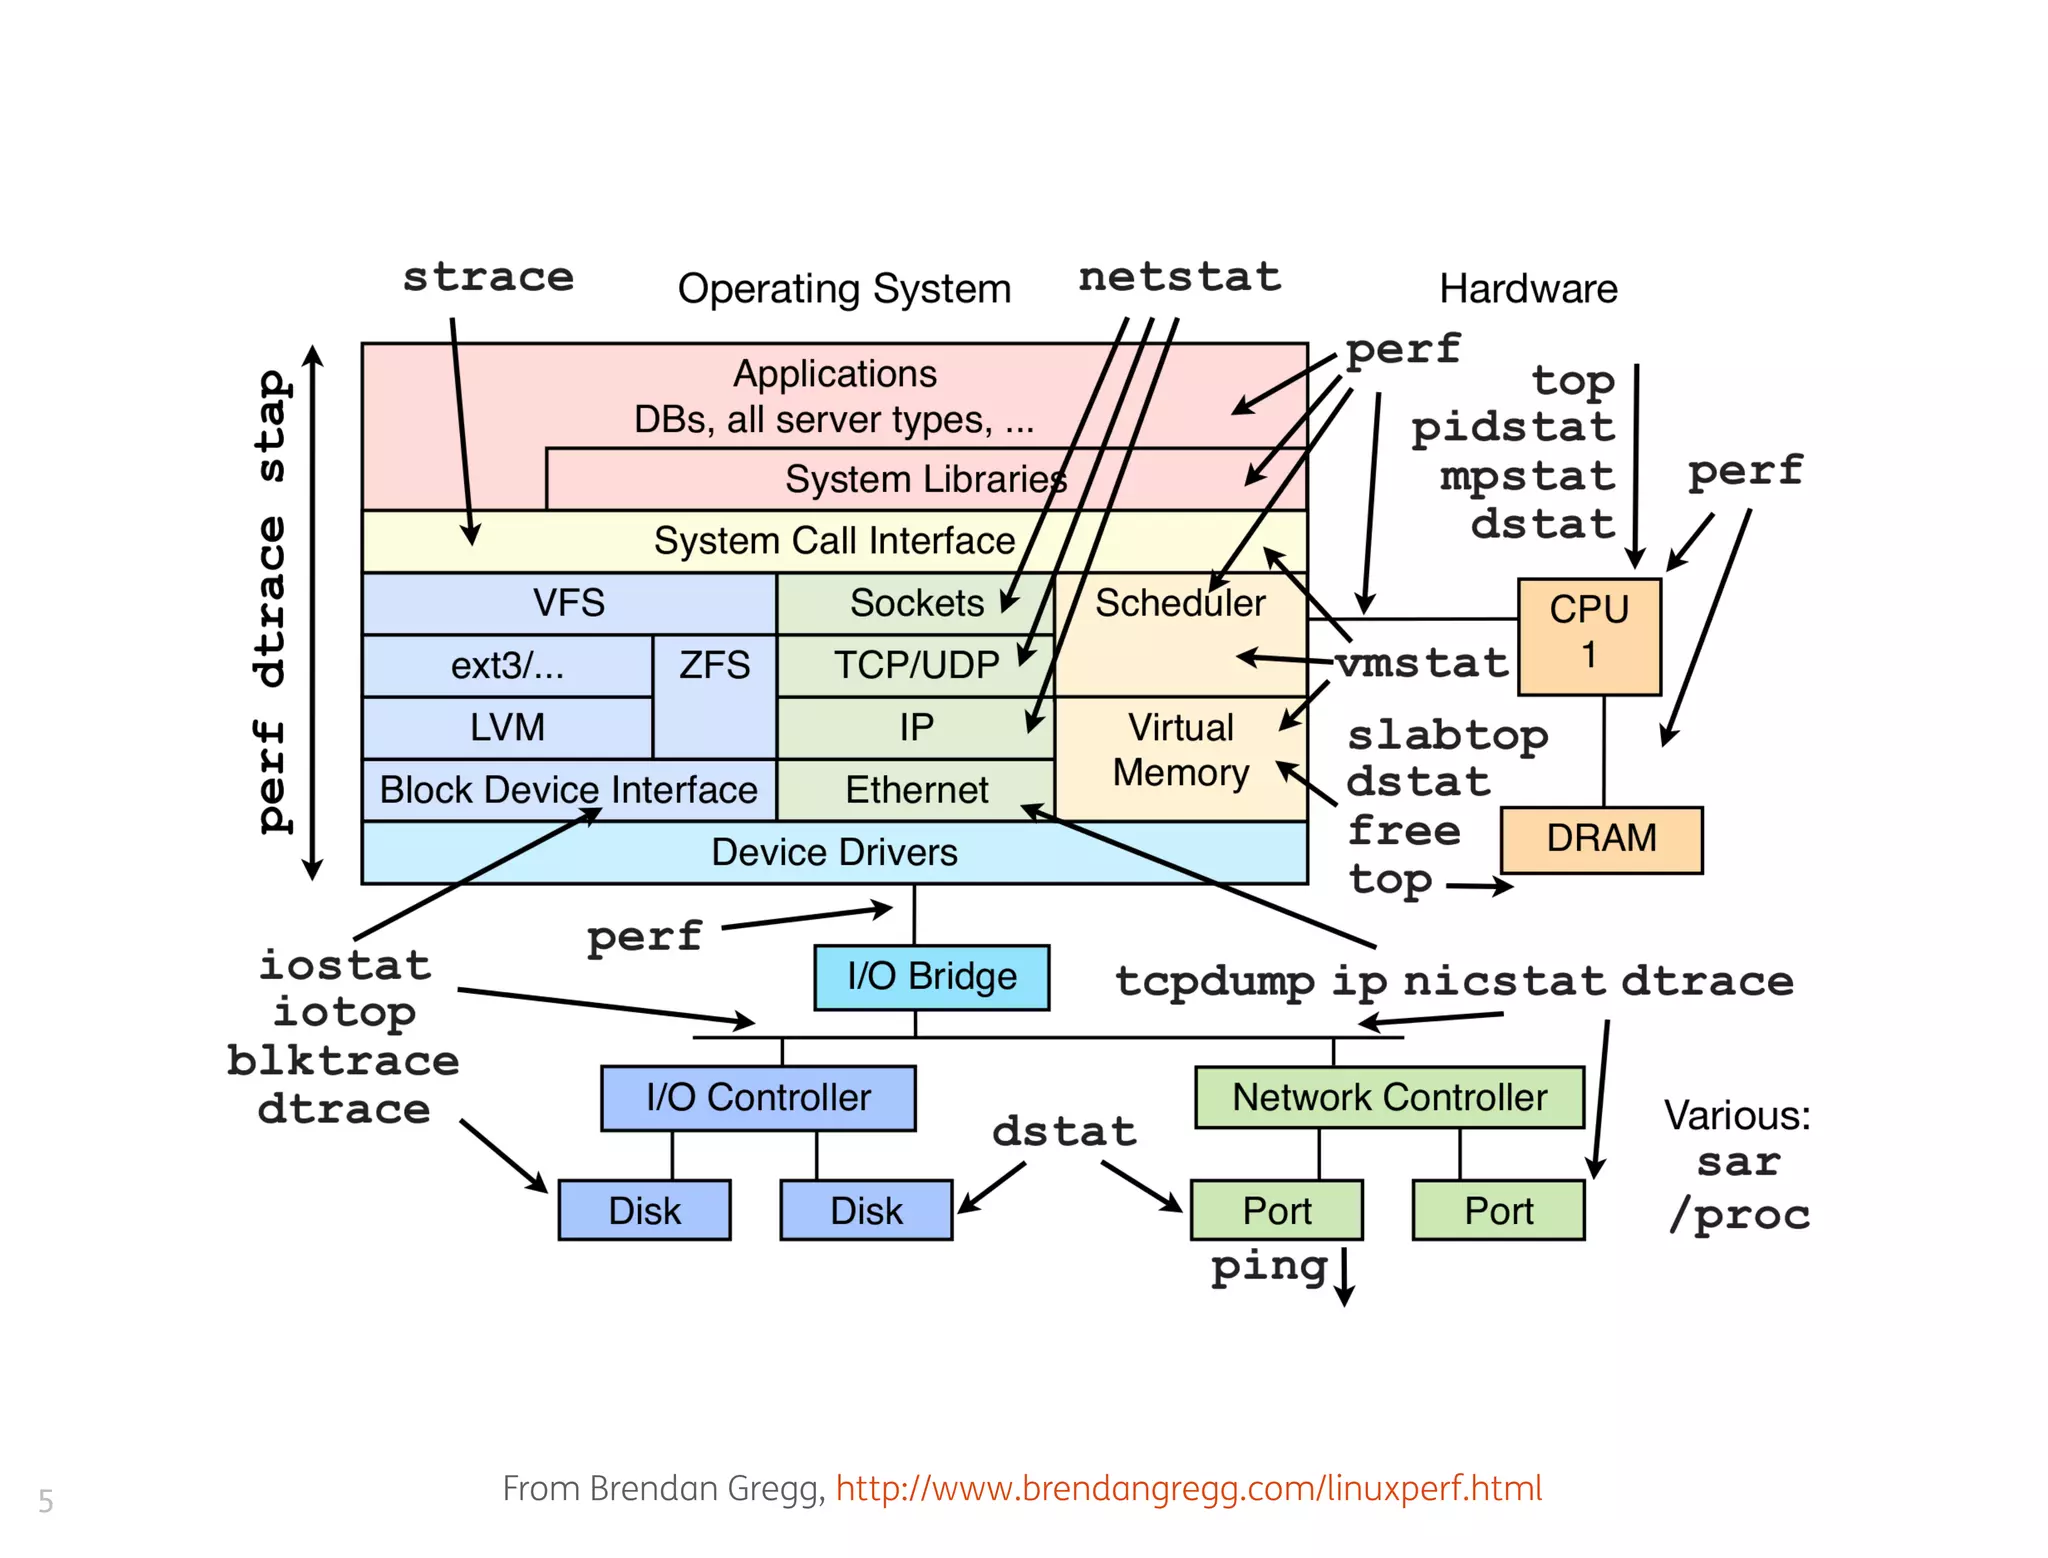
From Brendan Gregg, http://www.brendangregg.com/linuxperf.html5
From Brendan Gregg, http://www.brendangregg.com/linuxperf.html6
0
20
7
8
mpstat
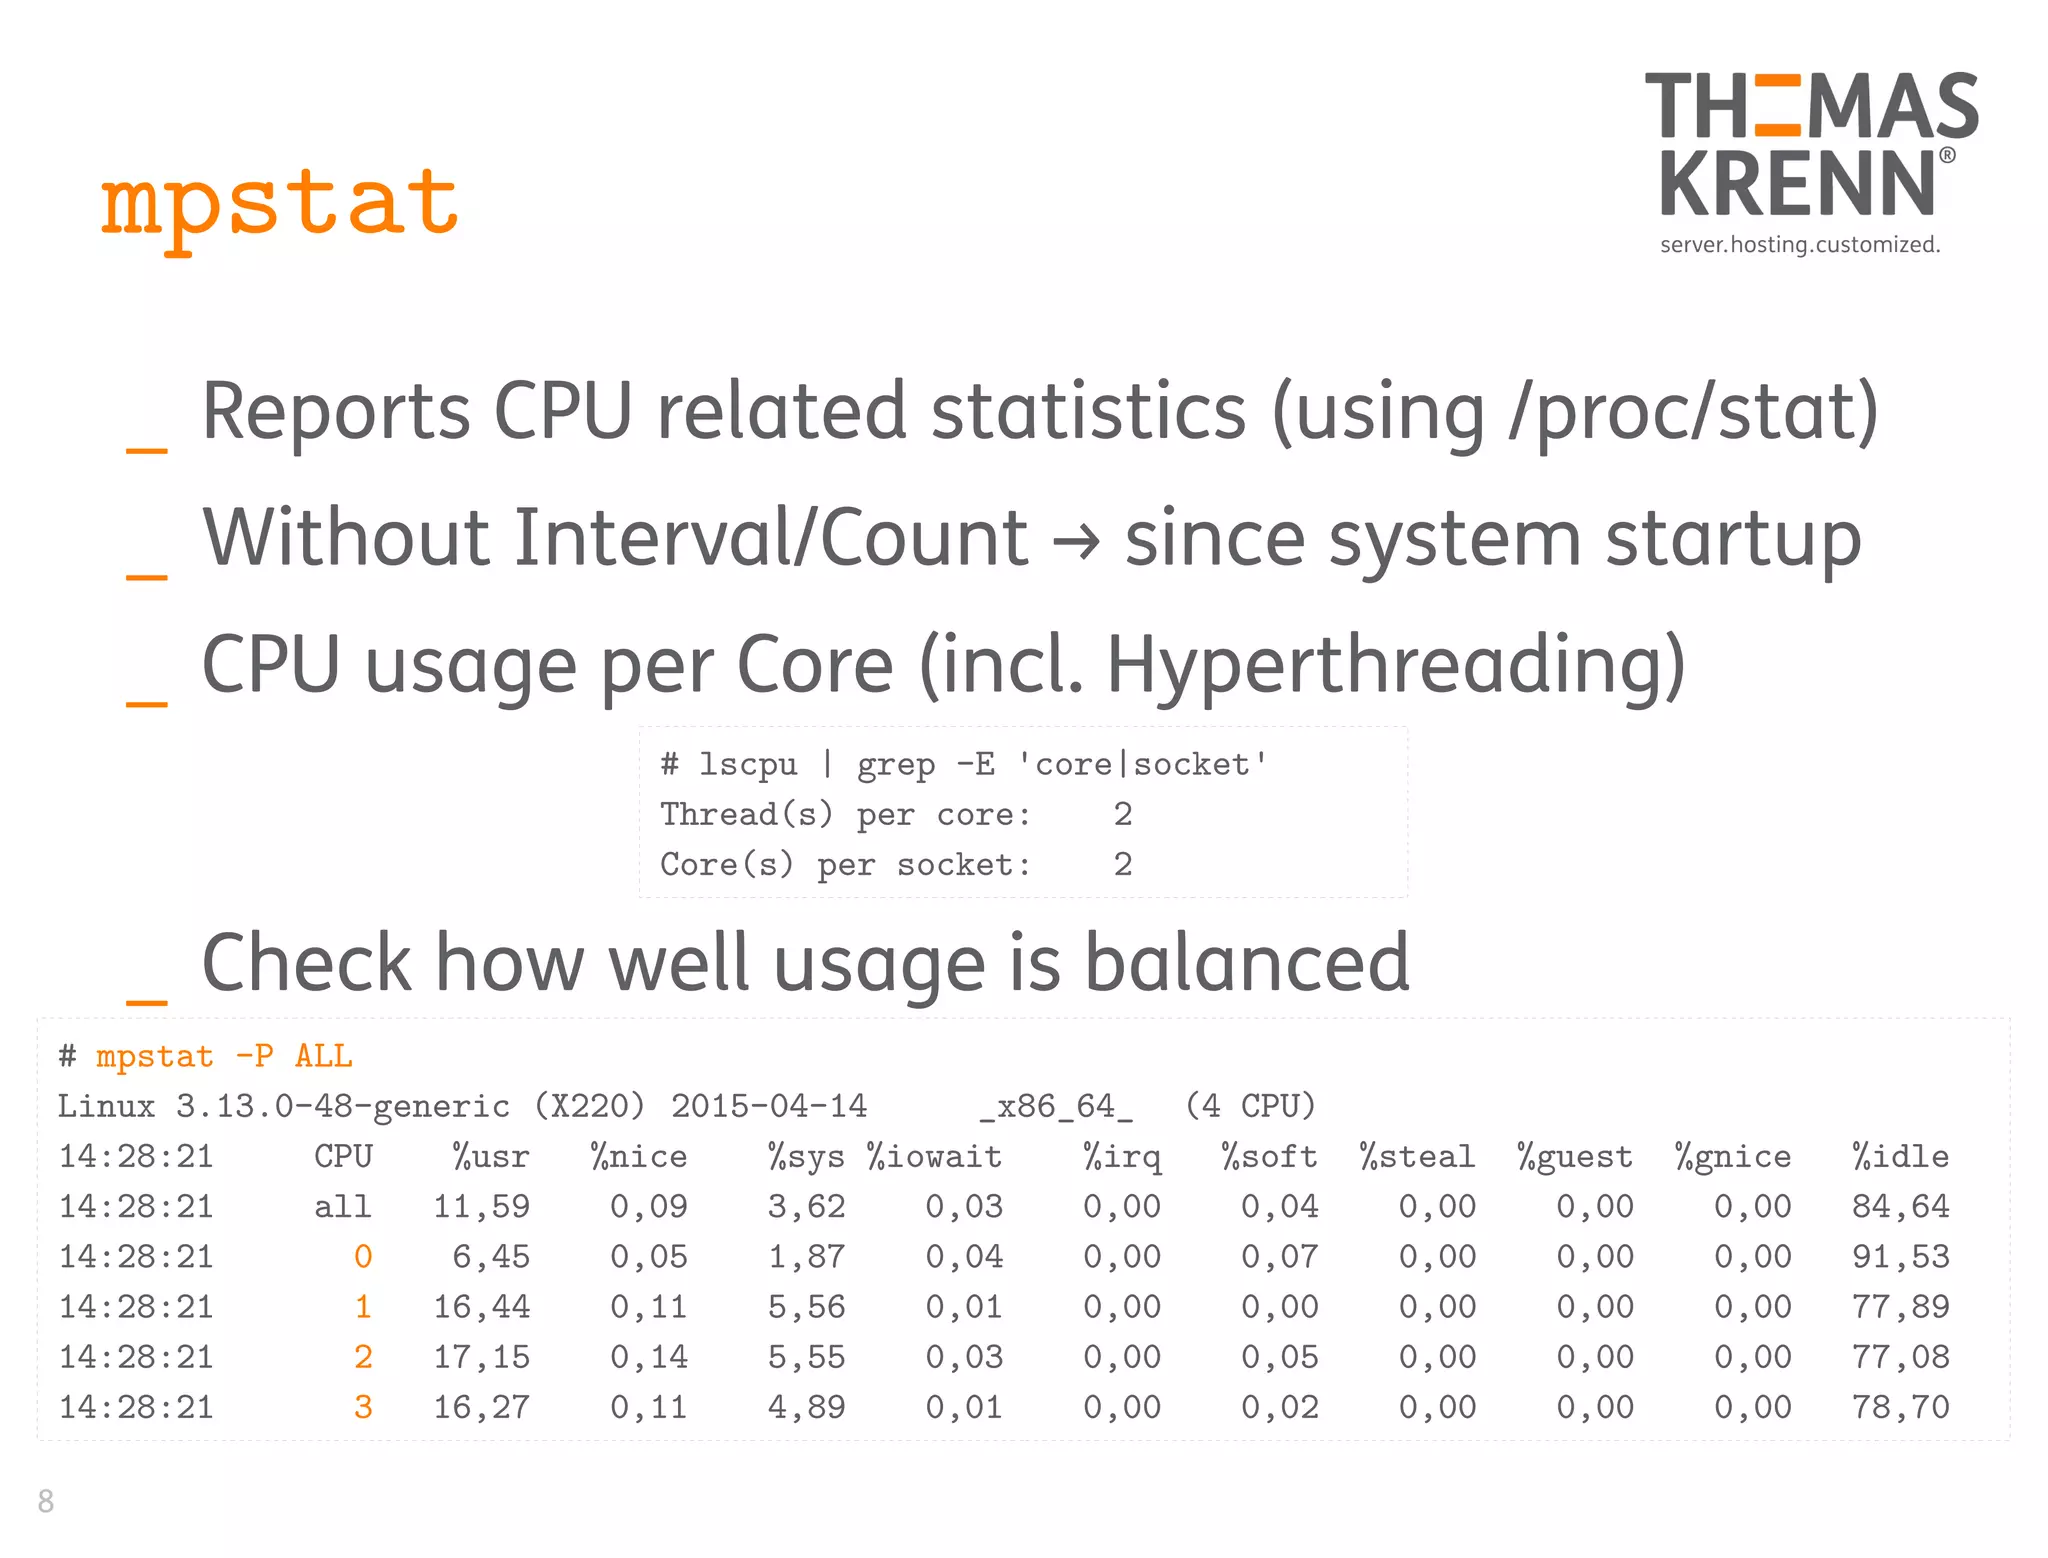
_ Reports CPU related statistics (using /proc/stat)
_ Without Interval/Count → since system startup
_ CPU usage per Core (incl. Hyperthreading)
_ Check how well usage is balanced
# mpstat -P ALL
Linux 3.13.0-48-generic (X220) 2015-04-14 _x86_64_ (4 CPU)
14:28:21 CPU %usr %nice %sys %iowait %irq %soft %steal %guest %gnice %idle
14:28:21 all 11,59 0,09 3,62 0,03 0,00 0,04 0,00 0,00 0,00 84,64
14:28:21 0 6,45 0,05 1,87 0,04 0,00 0,07 0,00 0,00 0,00 91,53
14:28:21 1 16,44 0,11 5,56 0,01 0,00 0,00 0,00 0,00 0,00 77,89
14:28:21 2 17,15 0,14 5,55 0,03 0,00 0,05 0,00 0,00 0,00 77,08
14:28:21 3 16,27 0,11 4,89 0,01 0,00 0,02 0,00 0,00 0,00 78,70
# lscpu | grep -E 'core|socket'
Thread(s) per core: 2
Core(s) per socket: 2
9
mpstat
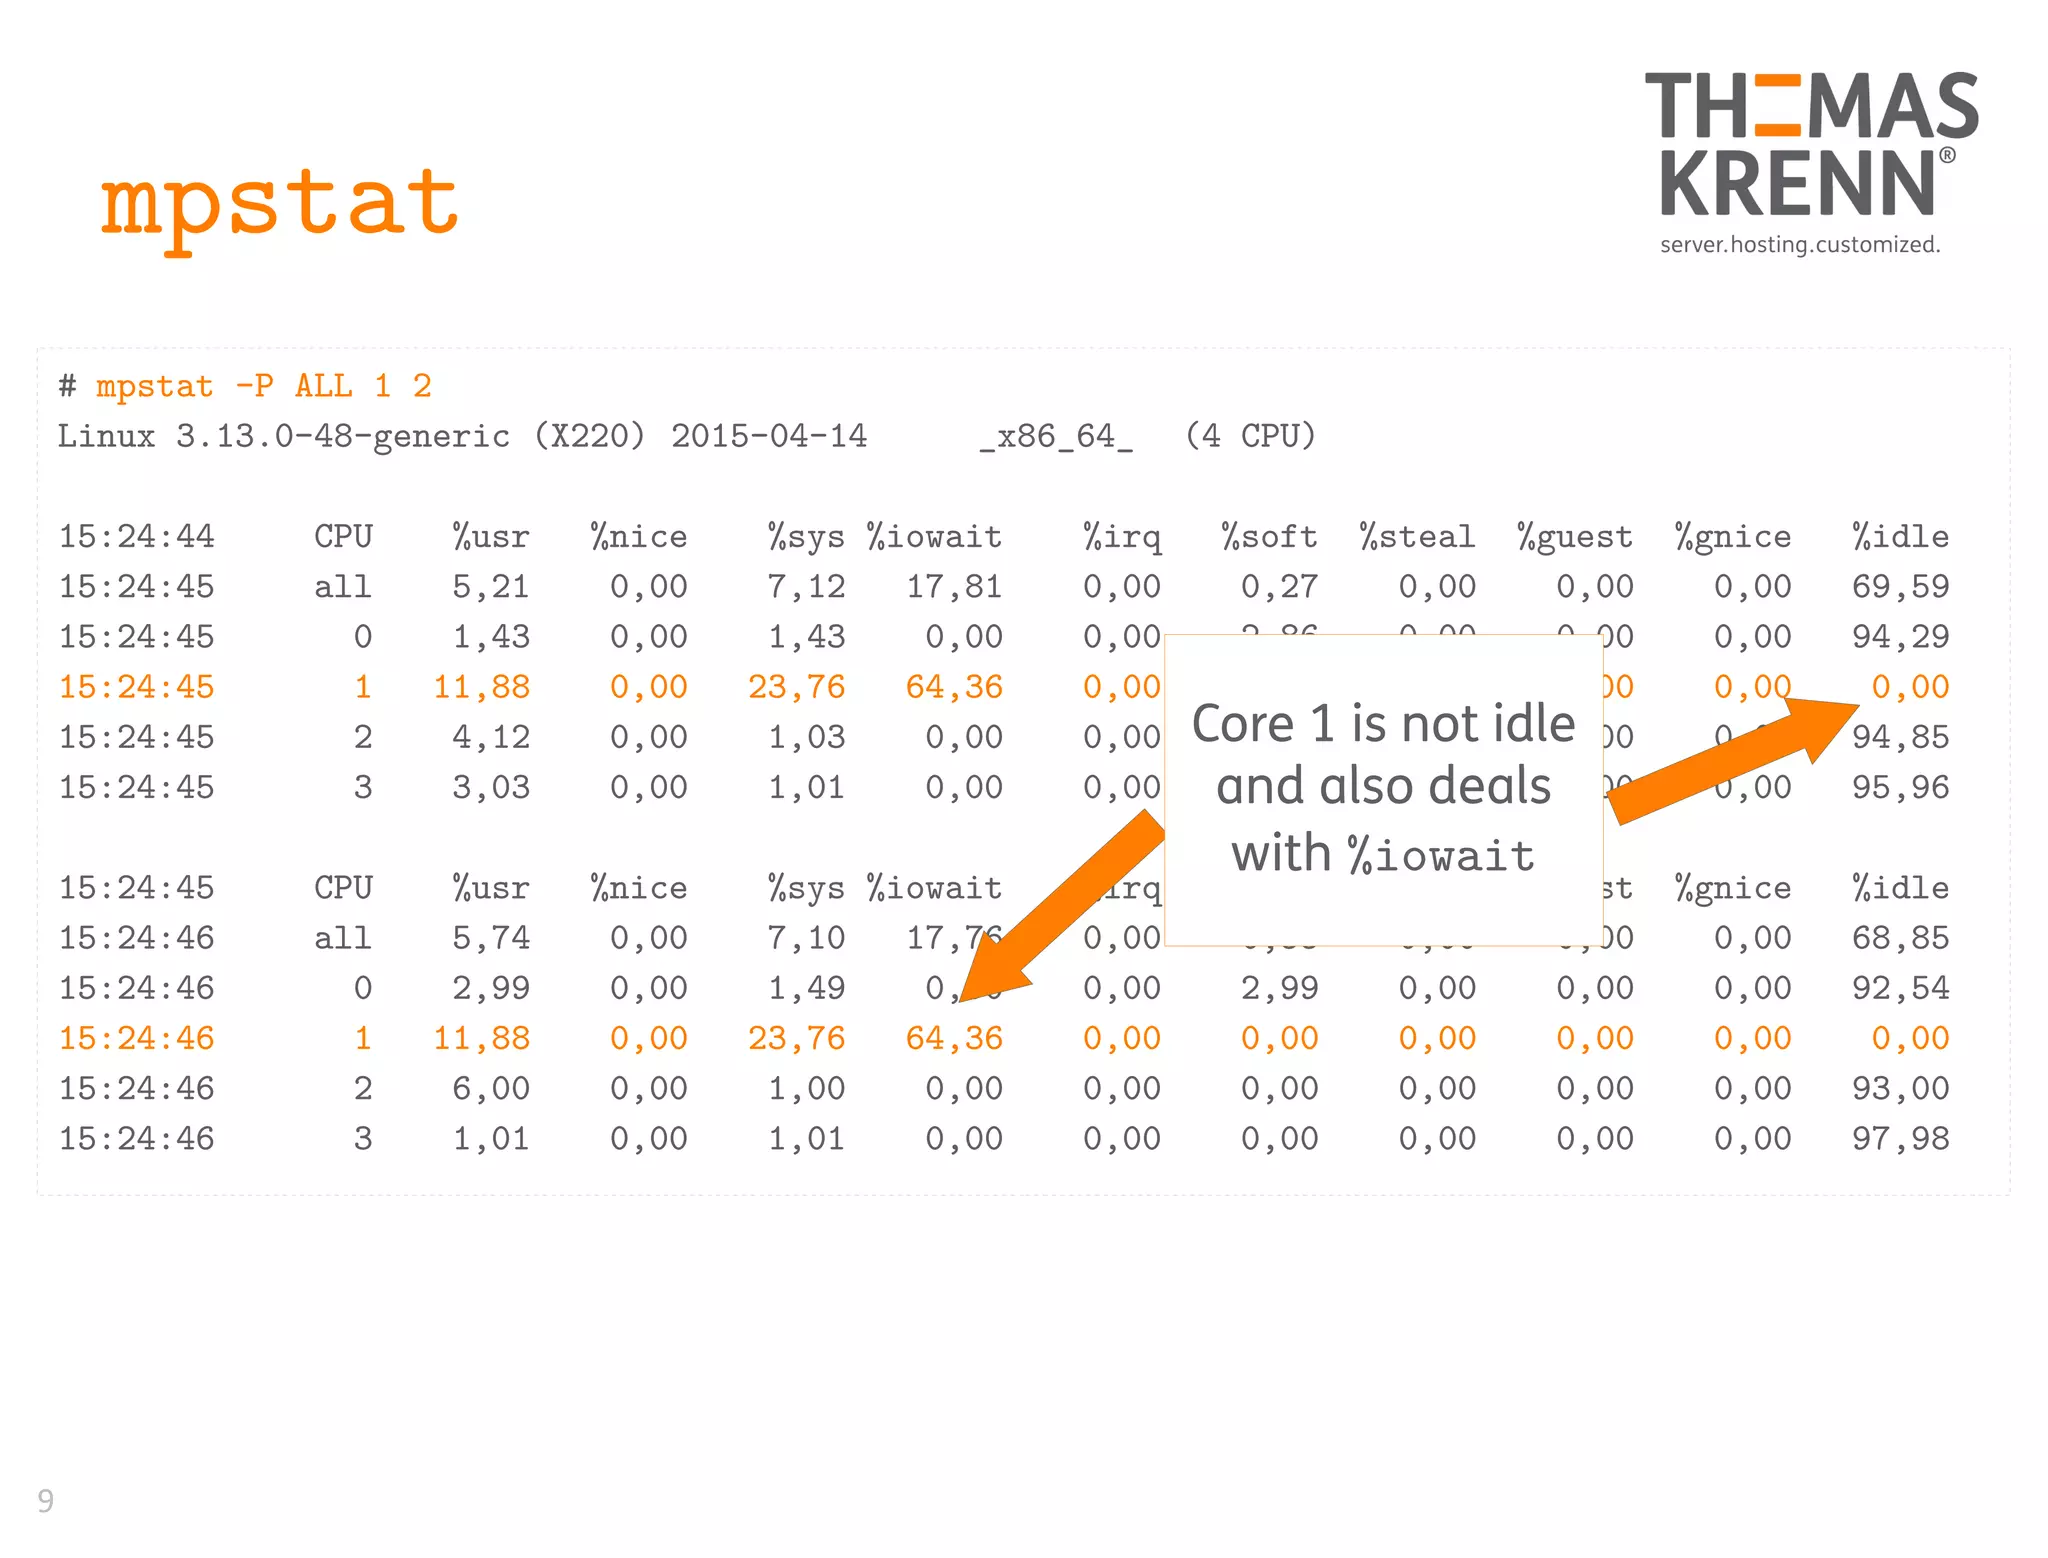
# mpstat -P ALL 1 2
Linux 3.13.0-48-generic (X220) 2015-04-14 _x86_64_ (4 CPU)
15:24:44 CPU %usr %nice %sys %iowait %irq %soft %steal %guest %gnice %idle
15:24:45 all 5,21 0,00 7,12 17,81 0,00 0,27 0,00 0,00 0,00 69,59
15:24:45 0 1,43 0,00 1,43 0,00 0,00 2,86 0,00 0,00 0,00 94,29
15:24:45 1 11,88 0,00 23,76 64,36 0,00 0,00 0,00 0,00 0,00 0,00
15:24:45 2 4,12 0,00 1,03 0,00 0,00 0,00 0,00 0,00 0,00 94,85
15:24:45 3 3,03 0,00 1,01 0,00 0,00 0,00 0,00 0,00 0,00 95,96
15:24:45 CPU %usr %nice %sys %iowait %irq %soft %steal %guest %gnice %idle
15:24:46 all 5,74 0,00 7,10 17,76 0,00 0,55 0,00 0,00 0,00 68,85
15:24:46 0 2,99 0,00 1,49 0,00 0,00 2,99 0,00 0,00 0,00 92,54
15:24:46 1 11,88 0,00 23,76 64,36 0,00 0,00 0,00 0,00 0,00 0,00
15:24:46 2 6,00 0,00 1,00 0,00 0,00 0,00 0,00 0,00 0,00 93,00
15:24:46 3 1,01 0,00 1,01 0,00 0,00 0,00 0,00 0,00 0,00 97,98
Core 1 is not idle
and also deals
with %iowait
10
vmstat
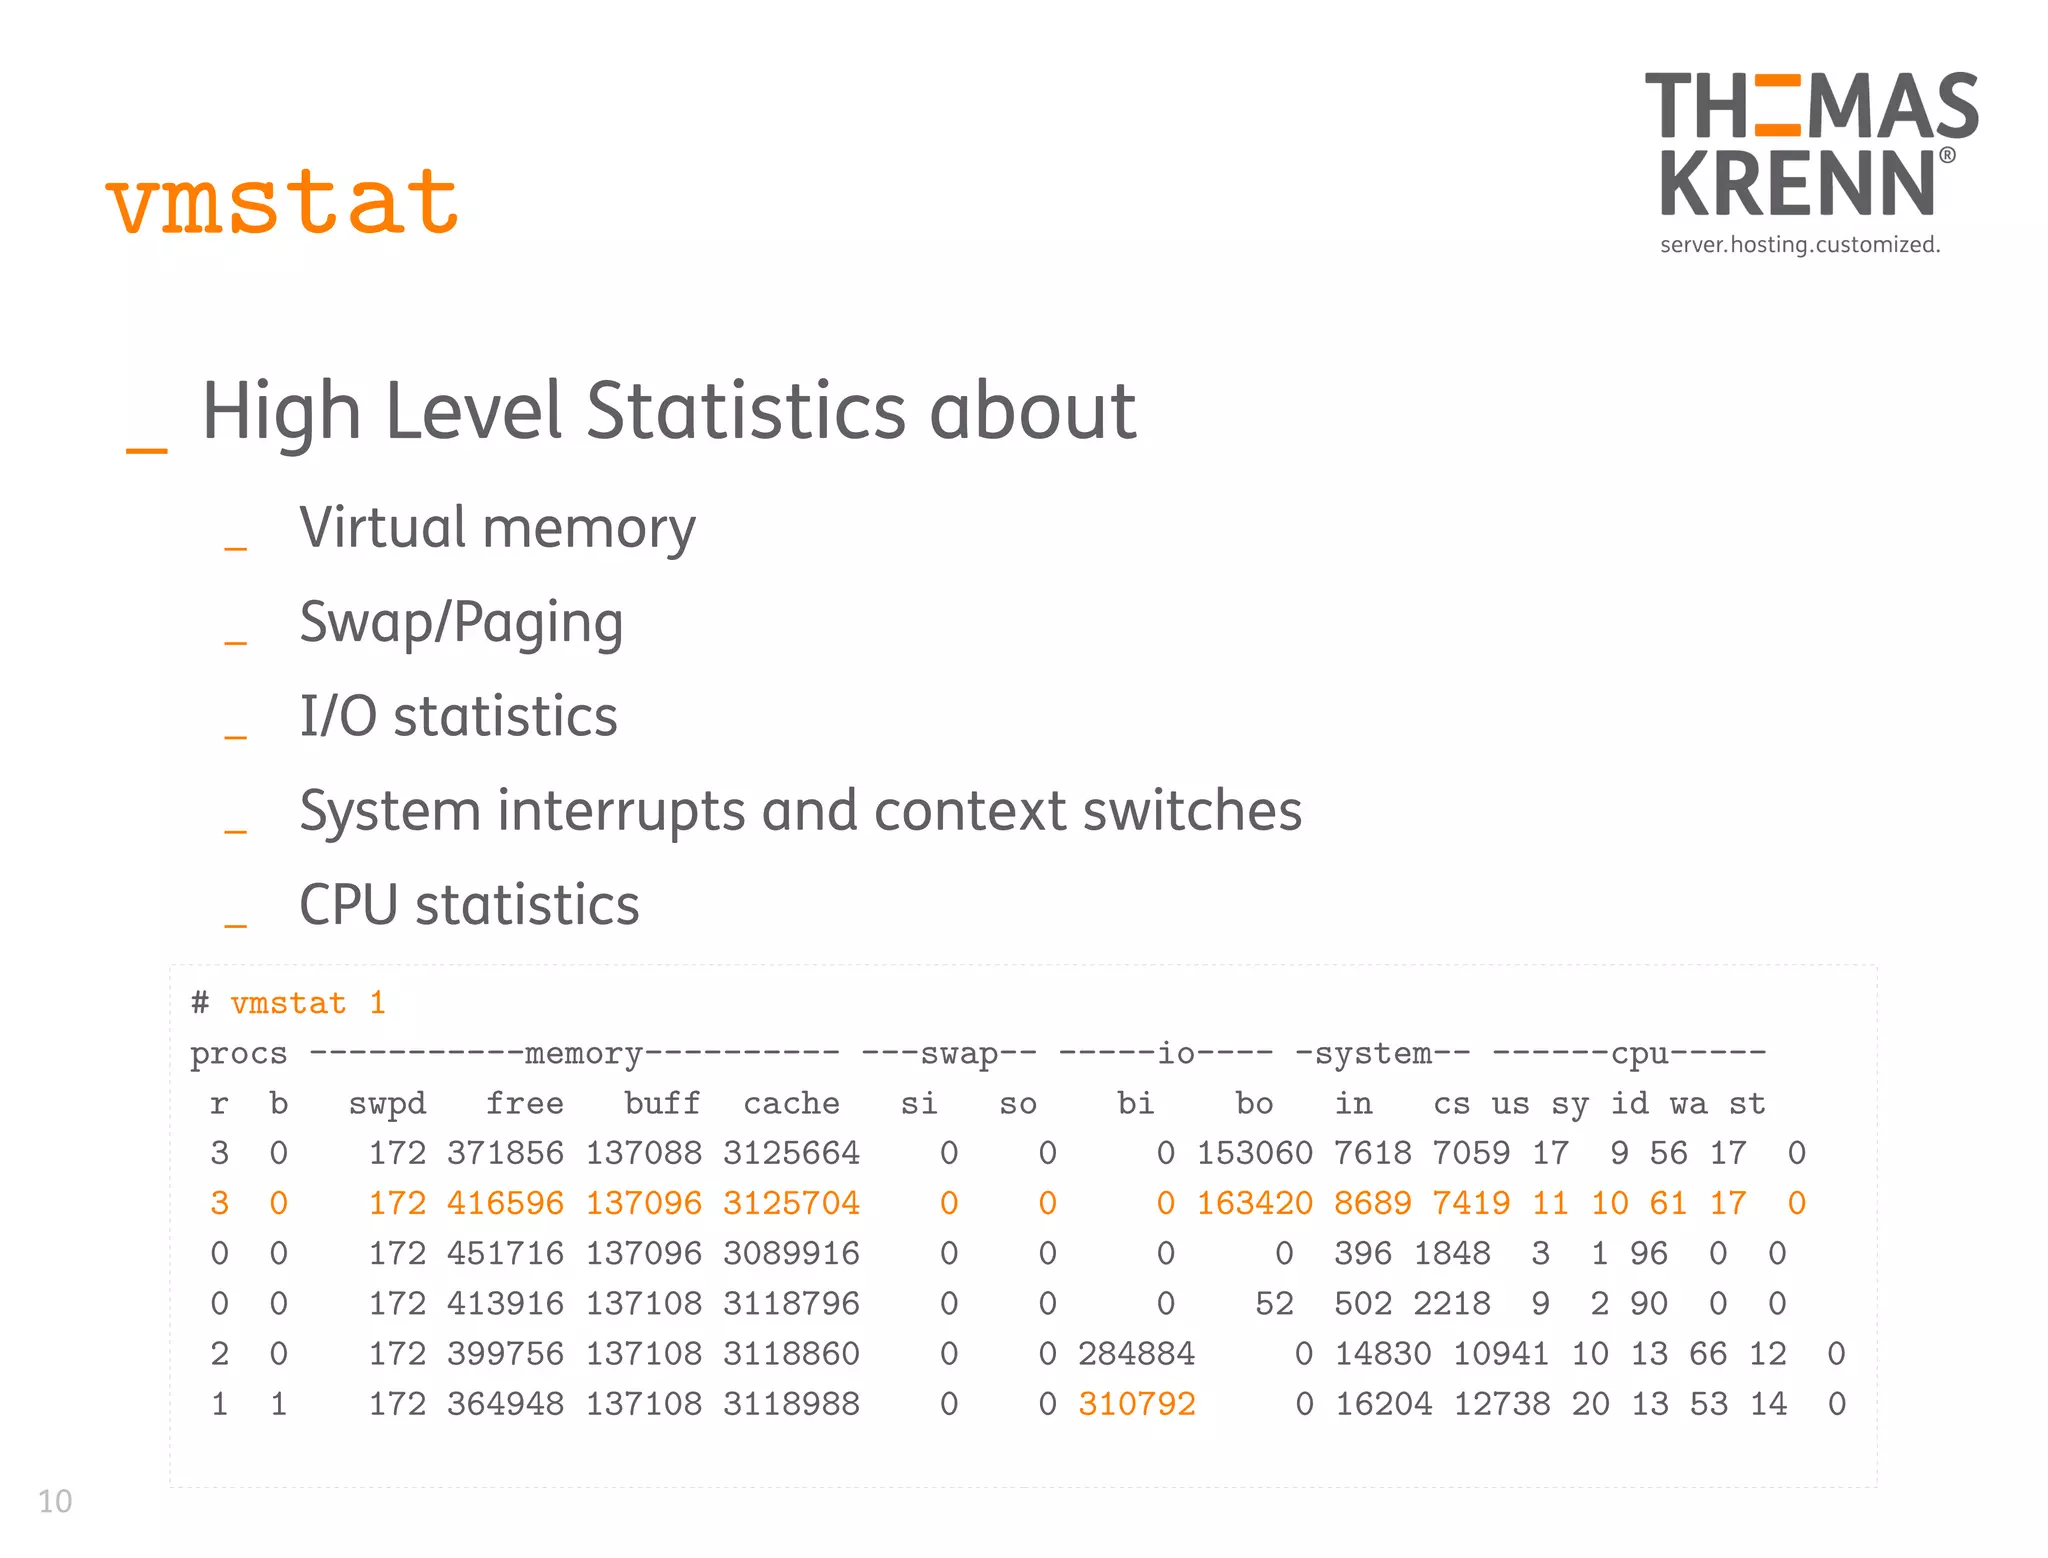
_ High Level Statistics about
_ Virtual memory
_ Swap/Paging
_ I/O statistics
_ System interrupts and context switches
_ CPU statistics
# vmstat 1
procs -----------memory---------- ---swap-- -----io---- -system-- ------cpu-----
r b swpd free buff cache si so bi bo in cs us sy id wa st
3 0 172 371856 137088 3125664 0 0 0 153060 7618 7059 17 9 56 17 0
3 0 172 416596 137096 3125704 0 0 0 163420 8689 7419 11 10 61 17 0
0 0 172 451716 137096 3089916 0 0 0 0 396 1848 3 1 96 0 0
0 0 172 413916 137108 3118796 0 0 0 52 502 2218 9 2 90 0 0
2 0 172 399756 137108 3118860 0 0 284884 0 14830 10941 10 13 66 12 0
1 1 172 364948 137108 3118988 0 0 310792 0 16204 12738 20 13 53 14 0
11
vmstat
_ Memory statistics
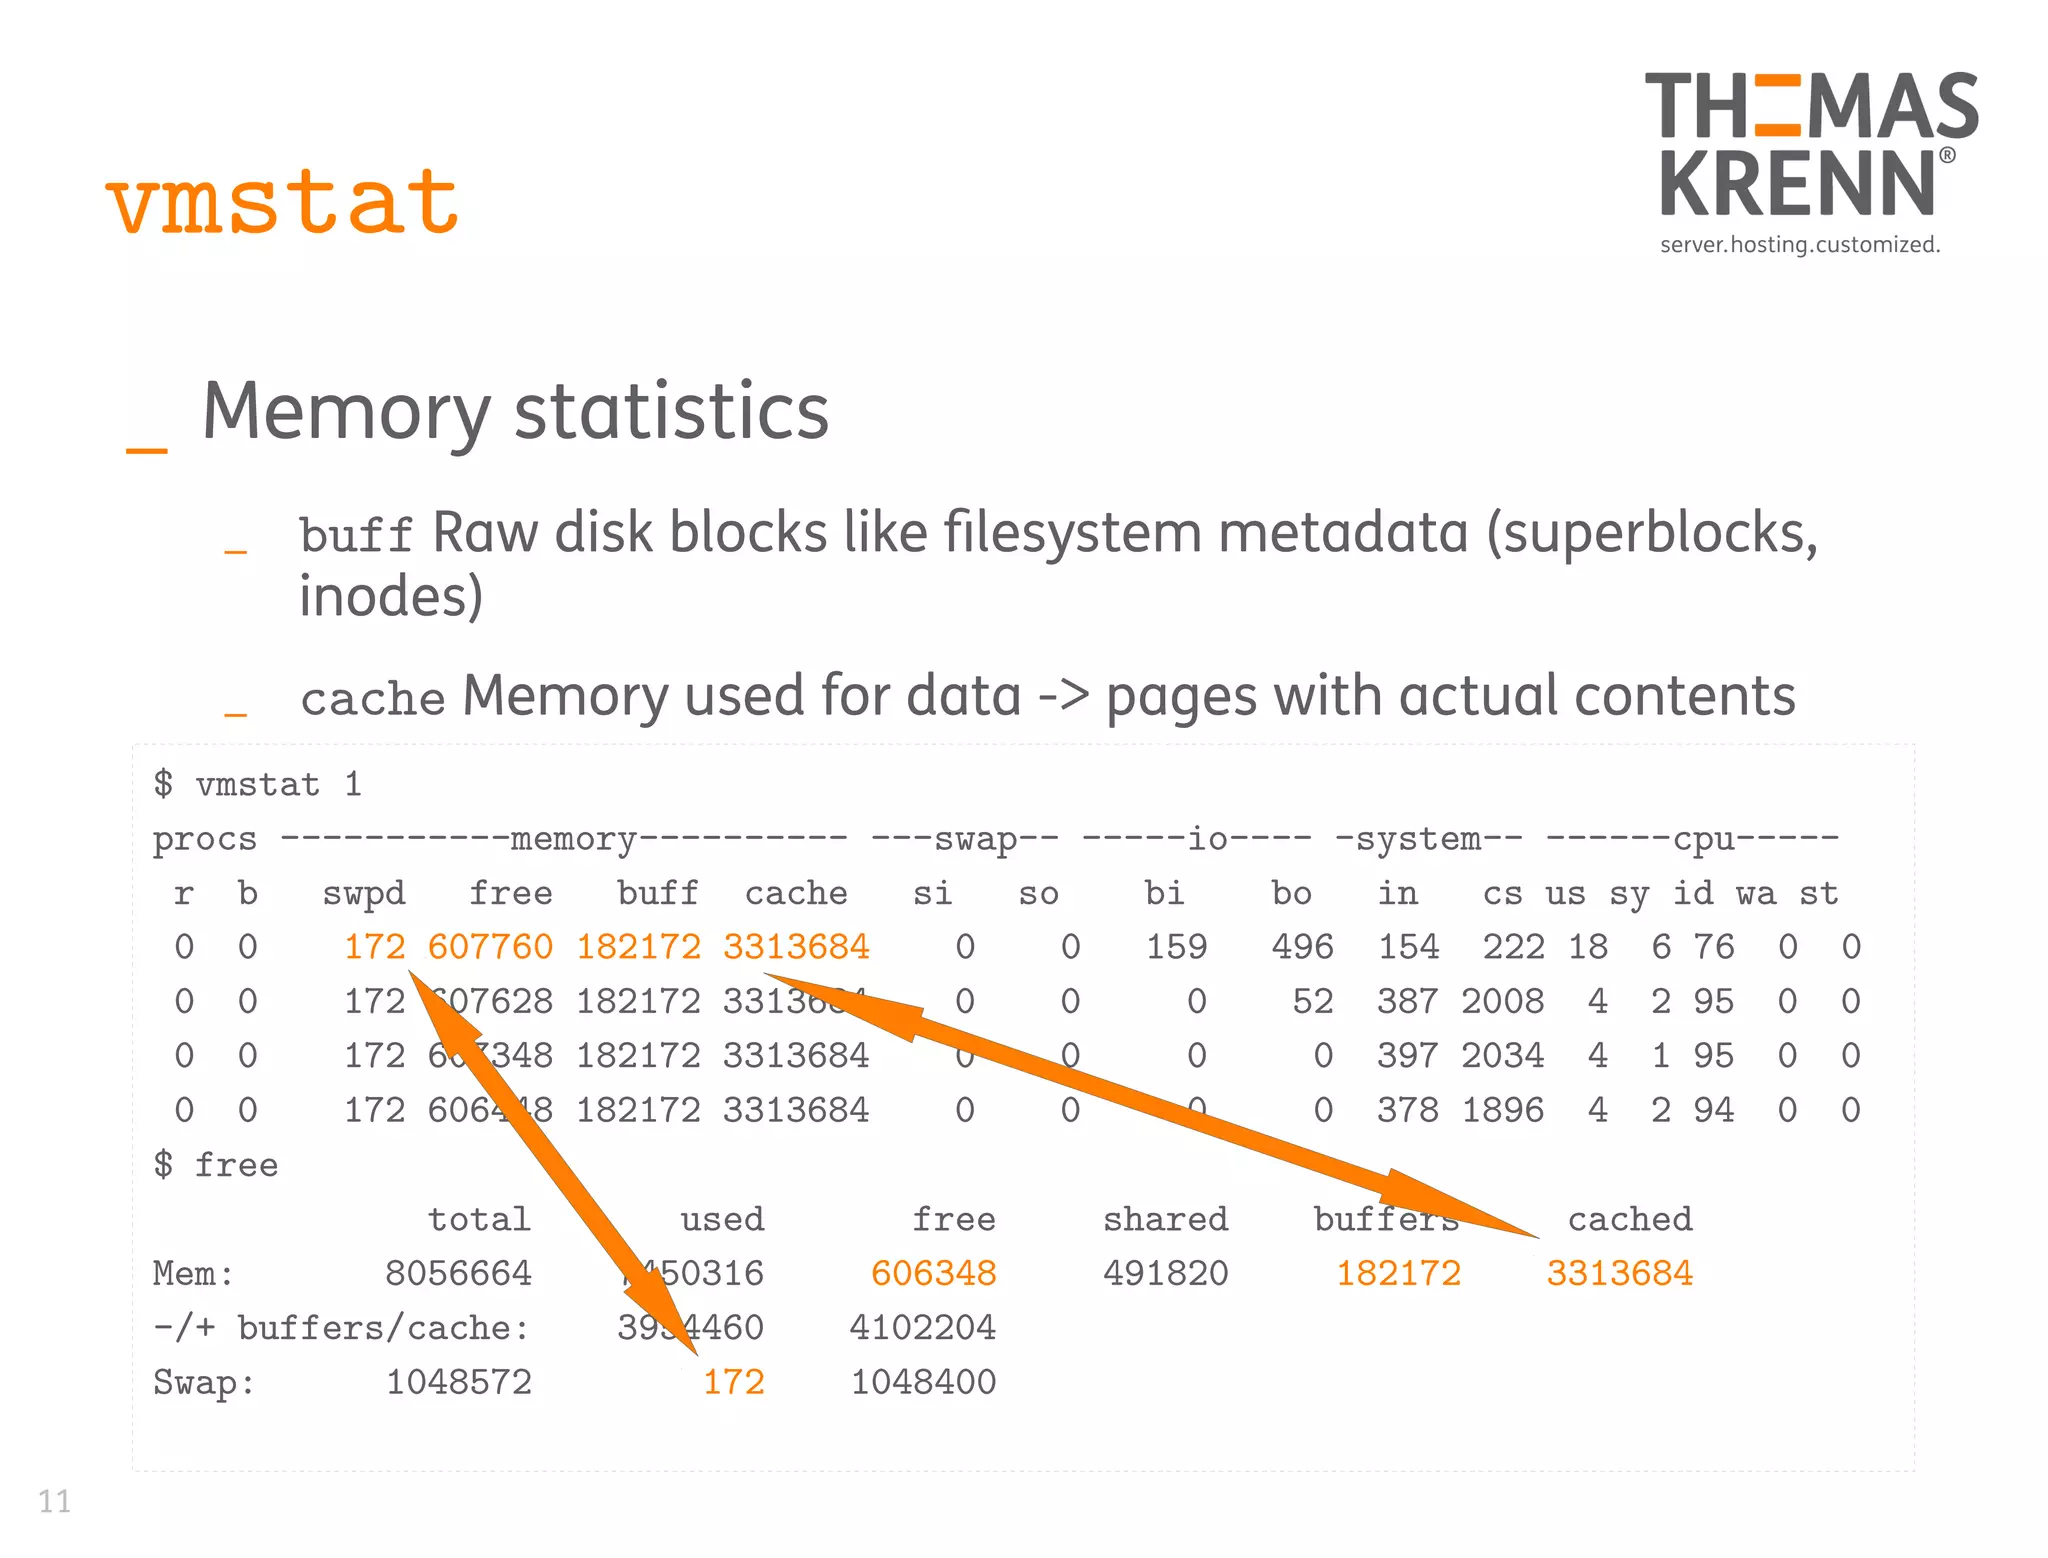
_ buff Raw disk blocks like filesystem metadata (superblocks,
inodes)
_ cache Memory used for data -> pages with actual contents
$ vmstat 1
procs -----------memory---------- ---swap-- -----io---- -system-- ------cpu-----
r b swpd free buff cache si so bi bo in cs us sy id wa st
0 0 172 607760 182172 3313684 0 0 159 496 154 222 18 6 76 0 0
0 0 172 607628 182172 3313684 0 0 0 52 387 2008 4 2 95 0 0
0 0 172 607348 182172 3313684 0 0 0 0 397 2034 4 1 95 0 0
0 0 172 606448 182172 3313684 0 0 0 0 378 1896 4 2 94 0 0
$ free
total used free shared buffers cached
Mem: 8056664 7450316 606348 491820 182172 3313684
-/+ buffers/cache: 3954460 4102204
Swap: 1048572 172 1048400
12
vmstat
_ Process related fields
_ r The number of runnable processes (running or waiting for
run time)
_ If high → indicator for saturation
_ b The number of processes in uninterruptible sleep
_ Mostly waiting for I/O
# vmstat 1
procs -----------memory---------- ---swap-- -----io---- -system-- ------cpu-----
r b swpd free buff cache si so bi bo in cs us sy id wa st
[...]
0 1 172 404768 137088 3125664 0 0 0 167524 9029 6955 6 6 70 18 0
0 1 172 399956 137088 3125664 0 0 0 138340 8133 6165 7 7 68 19 0
$ ps -eo ppid,pid,user,stat,pcpu,comm,wchan:32 | grep ext4
[...]
7159 7161 root Ds 3.2 fio ext4_file_write
7159 7162 root Ds 3.2 fio ext4_file_write
7159 7164 root Ds 3.2 fio ext4_file_write
Kernel function process
is sleeping on
Processes doing I/O
can be in waiting state
13
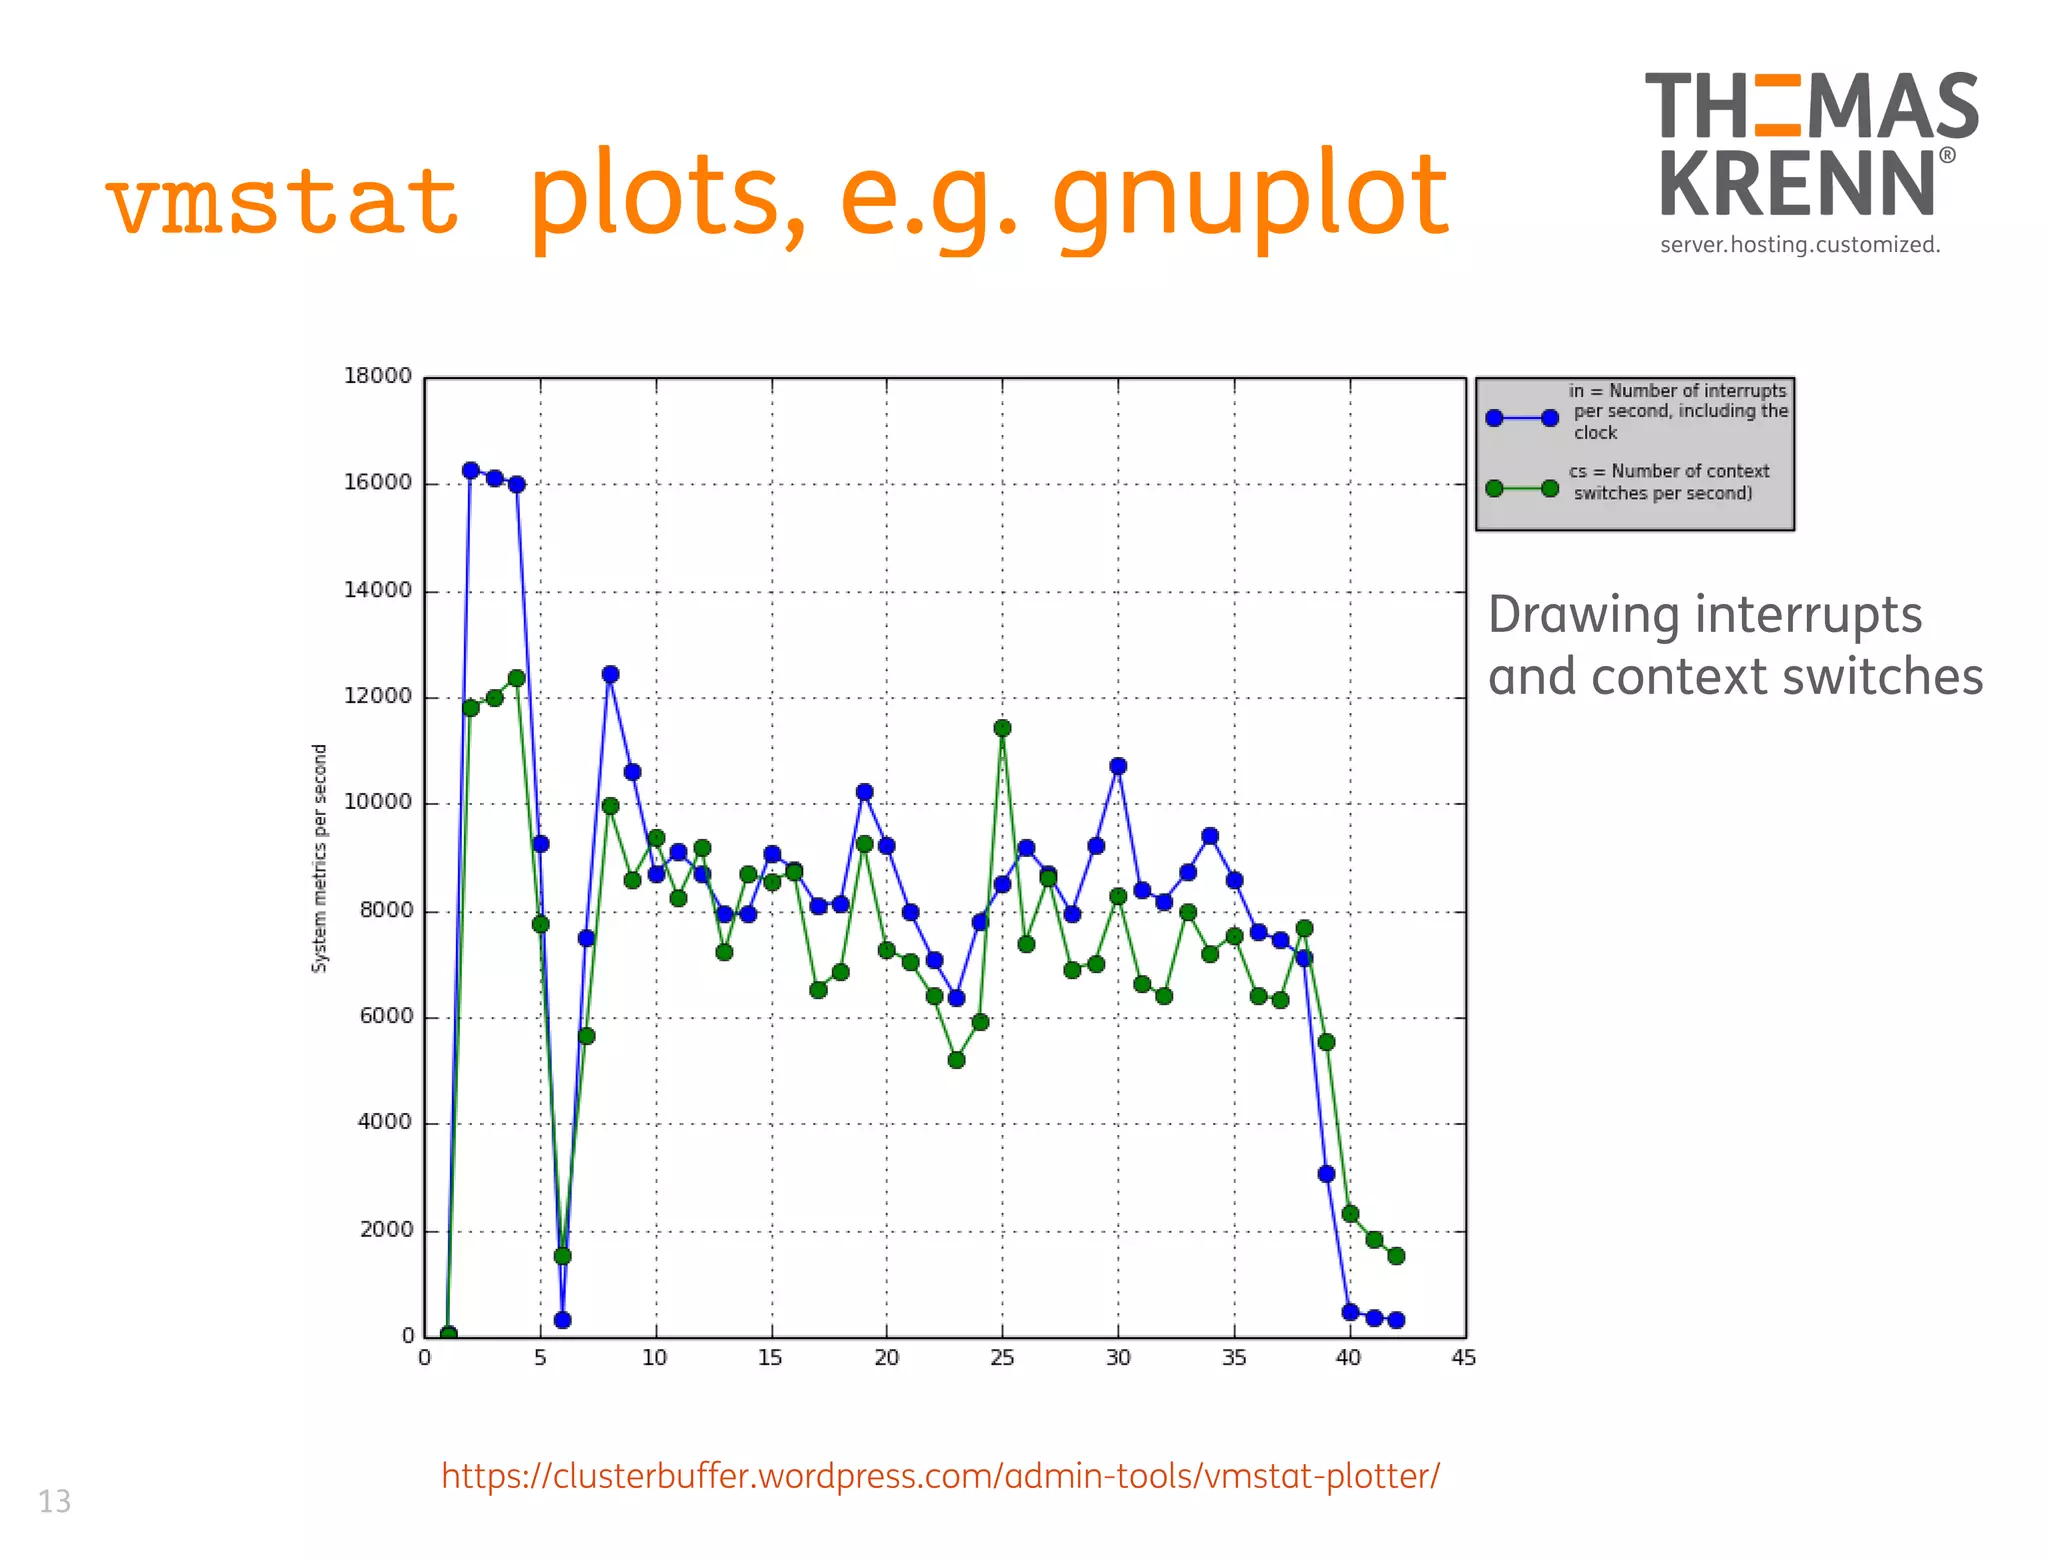
vmstat plots, e.g. gnuplot
https://clusterbuffer.wordpress.com/admin-tools/vmstat-plotter/
Drawing interrupts
and context switches
But we are not satisfied
with summaries and overviews...
14
What is PID 9059 doing?
15
16
pidstat
_ Report statistics for tasks being managed by
kernel
_ CPU bound → identify peak activity
$ top -b -n 1 -d 2 -o %CPU | head
[...]
PID USER PR NI VIRT RES SHR S %CPU %MEM TIME+ COMMAND
9059 gschoenb 20 0 47532 21132 2444 R 96,9 0,3 0:02.14 python
1 root 20 0 33880 3256 1500 S 0,0 0,0 0:02.35 init
$ pidstat -p 9059 -u 1 -l
Linux 3.13.0-48-generic (X220) 2015-04-15 _x86_64_ (4 CPU)
10:11:04 UID PID %usr %system %guest %CPU CPU Command
10:11:05 1000 9059 100,00 0,00 0,00 100,00 0 python ijk-matrix.py
-i matrix.in
10:11:06 1000 9059 100,00 0,00 0,00 100,00 0 python ijk-matrix.py
-i matrix.in
10:11:07 1000 9059 100,00 0,00 0,00 100,00 0 python ijk-matrix.py
-i matrix.in
Even check command
line arguments (“-l”) !
17
pidstat
_ I/O bound → device report
# mpstat -P ALL 1
10:25:31 CPU %usr %nice %sys %iowait %irq %soft %steal %guest %gnice %idle
10:25:32 all 14,88 0,00 9,40 13,84 0,00 1,04 0,00 0,00 0,00 60,84
10:25:32 0 22,45 0,00 1,02 0,00 0,00 0,00 0,00 0,00 0,00 76,53
10:25:32 1 13,73 0,00 34,31 51,96 0,00 0,00 0,00 0,00 0,00 0,00
10:25:32 2 17,86 0,00 0,00 0,00 0,00 3,57 0,00 0,00 0,00 78,57
10:25:32 3 6,12 0,00 0,00 0,00 0,00 0,00 0,00 0,00 0,00 93,88
# pidstat -d 1
Linux 3.13.0-48-generic (X220) 2015-04-15 _x86_64_ (4 CPU)
10:26:35 UID PID kB_rd/s kB_wr/s kB_ccwr/s Command
10:26:36 0 9208 0,00 2303,85 0,00 fio
10:26:36 0 9209 0,00 2996,15 0,00 fio
10:26:36 0 9210 0,00 2023,08 0,00 fio
10:26:36 0 9211 0,00 1284,62 0,00 fio
Which process
is causing %iowait?
Device report reveals
command and I/O
18
pidstat
_ How much memory is PID 8461 using?
_ Major page faults require loading memory page from disk
→ more RAM needed!
# pidstat -r -p 8461 1 3
Linux 3.13.0-49-generic (X220) 2015-04-21 _x86_64_ (4 CPU)
10:09:06 UID PID minflt/s majflt/s VSZ RSS %MEM Command
10:09:07 1000 8461 8,00 0,00 2018384 786688 9,76 firefox
10:09:08 1000 8461 11,00 0,00 2018384 786688 9,76 firefox
10:09:09 1000 8461 23,00 0,00 2018448 786892 9,77 firefox
Average: 1000 8461 14,00 0,00 2018405 786756 9,77 firefox
Current used share
of physical memory
Minor and major
page faults
19
iostat
_ I/O subsystem statistics
_ CPU (-c) or device utilization (-d) report
_ Without argument → summary since boot
_ Skip that with -y option
# iostat
Linux 3.13.0-48-generic (X220) 2015-04-15 _x86_64_ (4 CPU)
avg-cpu: %user %nice %system %iowait %steal %idle
16,16 0,09 4,79 0,46 0,00 78,50
Device: tps kB_read/s kB_wrtn/s kB_read kB_wrtn
sda 83,80 41,64 531,43 22375057 285581196
20
iostat
Let's start the
live demo #1
21
iostat
_ CPU util report → %iowait
_ Not really reliable → %iowait is some kind of
%idle time
# taskset 1 fio –rw=randwrite [...] &
# iostat -y -c 1 3
[…]
avg-cpu: %user %nice %system %iowait %steal %idle
17,32 0,00 6,56 13,65 0,00 62,47
# taskset 1 sh -c "while true; do true; done" &
# iostat -y -c 1 3
avg-cpu: %user %nice %system %iowait %steal %idle
35,59 0,00 7,02 0,00 0,00 57,39
http://www.percona.com/blog/2014/06/03/trust-vmstat-iowait-numbers/
22
iostat
_ Extended device util report (“-x”) → %util
_ man iostat → … for devices serving request serially, for parallel
processing (RAID arrays and SSDs), this number does not reflect their
performance limits.
_ In theory
_ 94,4% util
→ 23032 IOPS
_ 99,6% util
→ 24300 IOPS
23
iostat
# iostat -y -d -x 1 3
Linux 3.13.0-48-generic (X220) 2015-04-15 _x86_64_ (4 CPU)
Device: rrqm/s wrqm/s r/s w/s rkB/s wkB/s avgrq-sz avgqu-sz await
r_await w_await svctm %util
sda 0,00 2,00 0,00 23032,00 0,00 92136,00 8,00 2,90 0,13
0,00 0,13 0,04 94,40
# iostat -y -d -x 1 3
Linux 3.13.0-48-generic (X220) 2015-04-15 _x86_64_ (4 CPU)
Device: rrqm/s wrqm/s r/s w/s rkB/s wkB/s avgrq-sz avgqu-sz await
r_await w_await svctm %util
sda 0,00 2917,00 0,00 43175,00 0,00 184500,00 8,55 135,75 3,15
0,00 3,15 0,02 99,60
Only 5% util increase,
but IOPS nearly doubled!
24
https://www.thomas-krenn.com/de/wiki/Linux_Storage_Stack_Diagramm
25
iostat -cx / -dx
_ avgqu-sz Avg. queue length of requests issued
_ (delta[time_in_queue] / interval) / 1000.0
_ time_in_queue Requets waiting for device, effected by in_flight
_ await Avg. time requests being served
_ delta[read_ticks + write_ticks] / delta[read_IOs +
write_Ios]
_ ticks also effected by in_flight
_ Therefore serving more requests while await is
not increasing, is a good performance indicator
- Monitoring IO Performance using iostat and pt-diskstats
- Block layer statistics
4
20
26
27
dstat
_ Combines several classical tools
_ Replacement for vmstat, iostat, ifstat
_ Prints metrics and uses colors
_ Has a plugin concept
28
nicstat
_ Print network device statistics
_ %Util depends on speed and duplex mode
_ Sat also takes errors into account
# nicstat -l
Int Loopback Mbit/s Duplex State
vboxnet0 No 0 unkn up
eth0 No 1000 full up
lo Yes - unkn up
wlan0 No 0 unkn up
# nicstat -i eth0 1 5
Time Int rKB/s wKB/s rPk/s wPk/s rAvs wAvs %Util Sat
14:52:21 eth0 3.08 0.36 3.13 2.48 1007.6 149.4 0.00 0.05
14:52:22 eth0 19.89 1.23 16.98 17.97 1199.6 70.00 0.02 0.00
14:52:23 eth0 21.42 1.09 21.99 16.00 997.1 70.00 0.02 0.00
# nicstat -i eth0 -t 1 2
14:57:36 InKB OutKB InSeg OutSeg Reset AttF %ReTX InConn OutCon Drops
TCP 0.00 0.00 2.88 2.51 0.02 0.00 0.000 0.00 0.04 0.00
14:57:37 InKB OutKB InSeg OutSeg Reset AttF %ReTX InConn OutCon Drops
TCP 0.00 0.00 0.00 0.00 0.00 0.00 0.000 0.00 0.00 0.00
Check if your network is
saturated, Drops can be
an indicator!
Do you have a history of your
system's performance data?
yes no
29
30
sar (part of sysstat)
_ It's easy with system activity reporter
_ sar, sadc, sa1 and sa2, sadf
http://www.brendangregg.com/Perf/linux_observability_sar.png
31
ksar
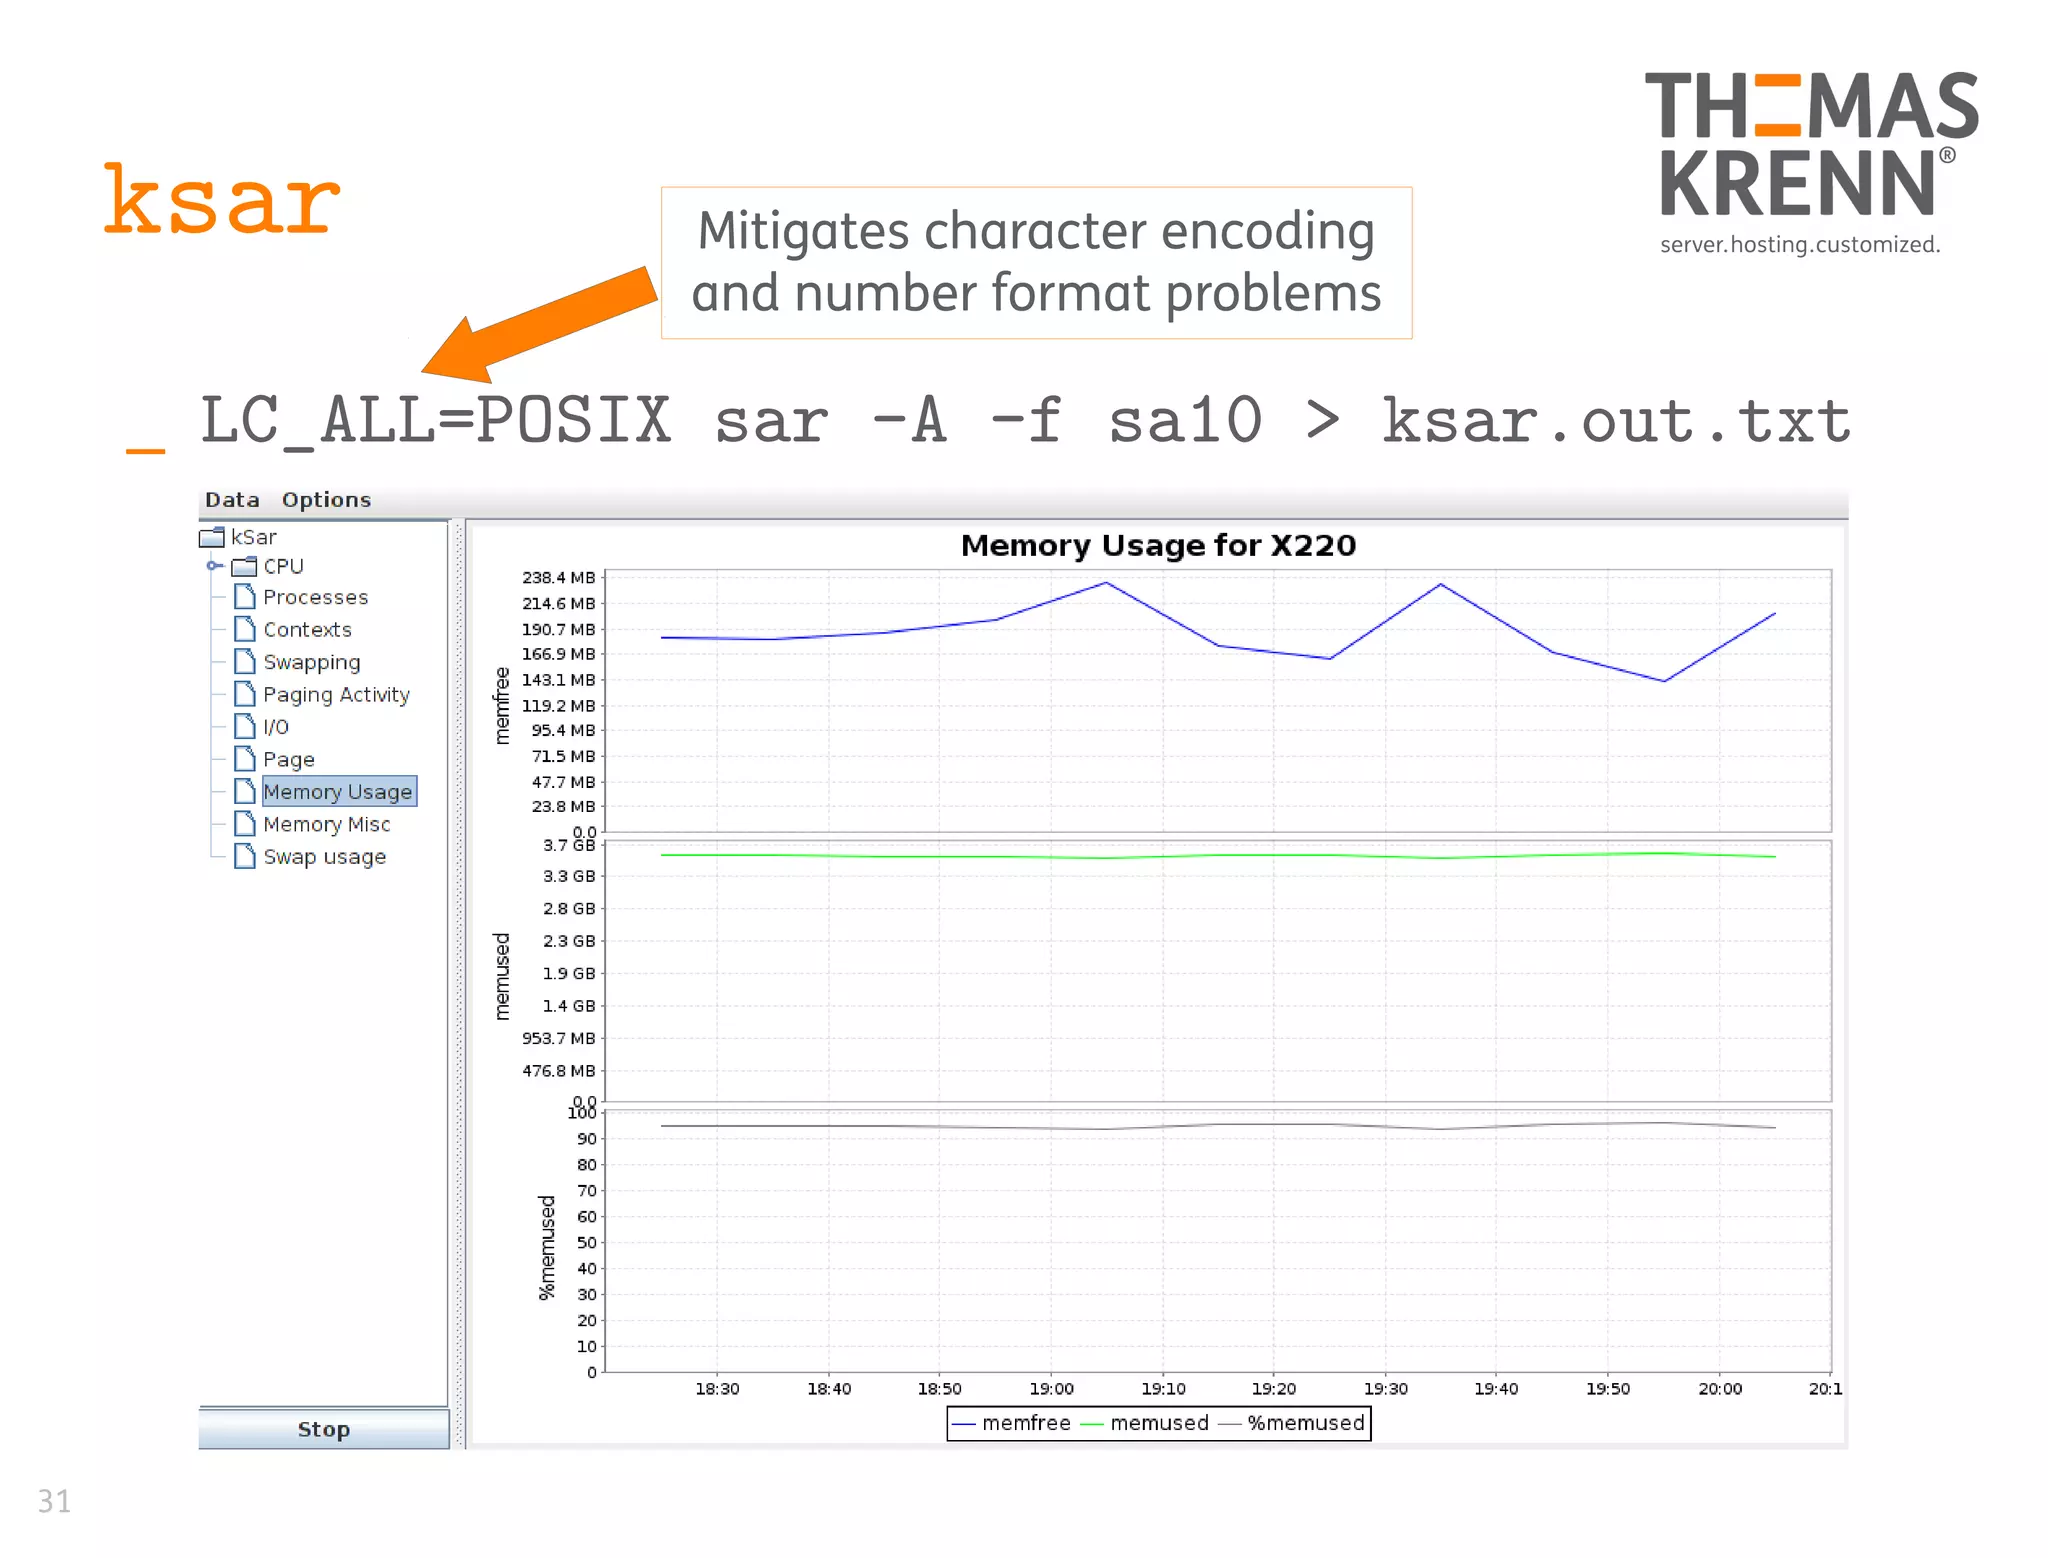
_ LC_ALL=POSIX sar -A -f sa10 > ksar.out.txt
Mitigates character encoding
and number format problems
32
Percona Cacti Template
_ Percona Linux Monitoring Template for Cacti
_ generate many graphs easily
https://www.percona.com/doc/percona-monitoring-
plugins/1.1/cacti/linux-templates.html
33
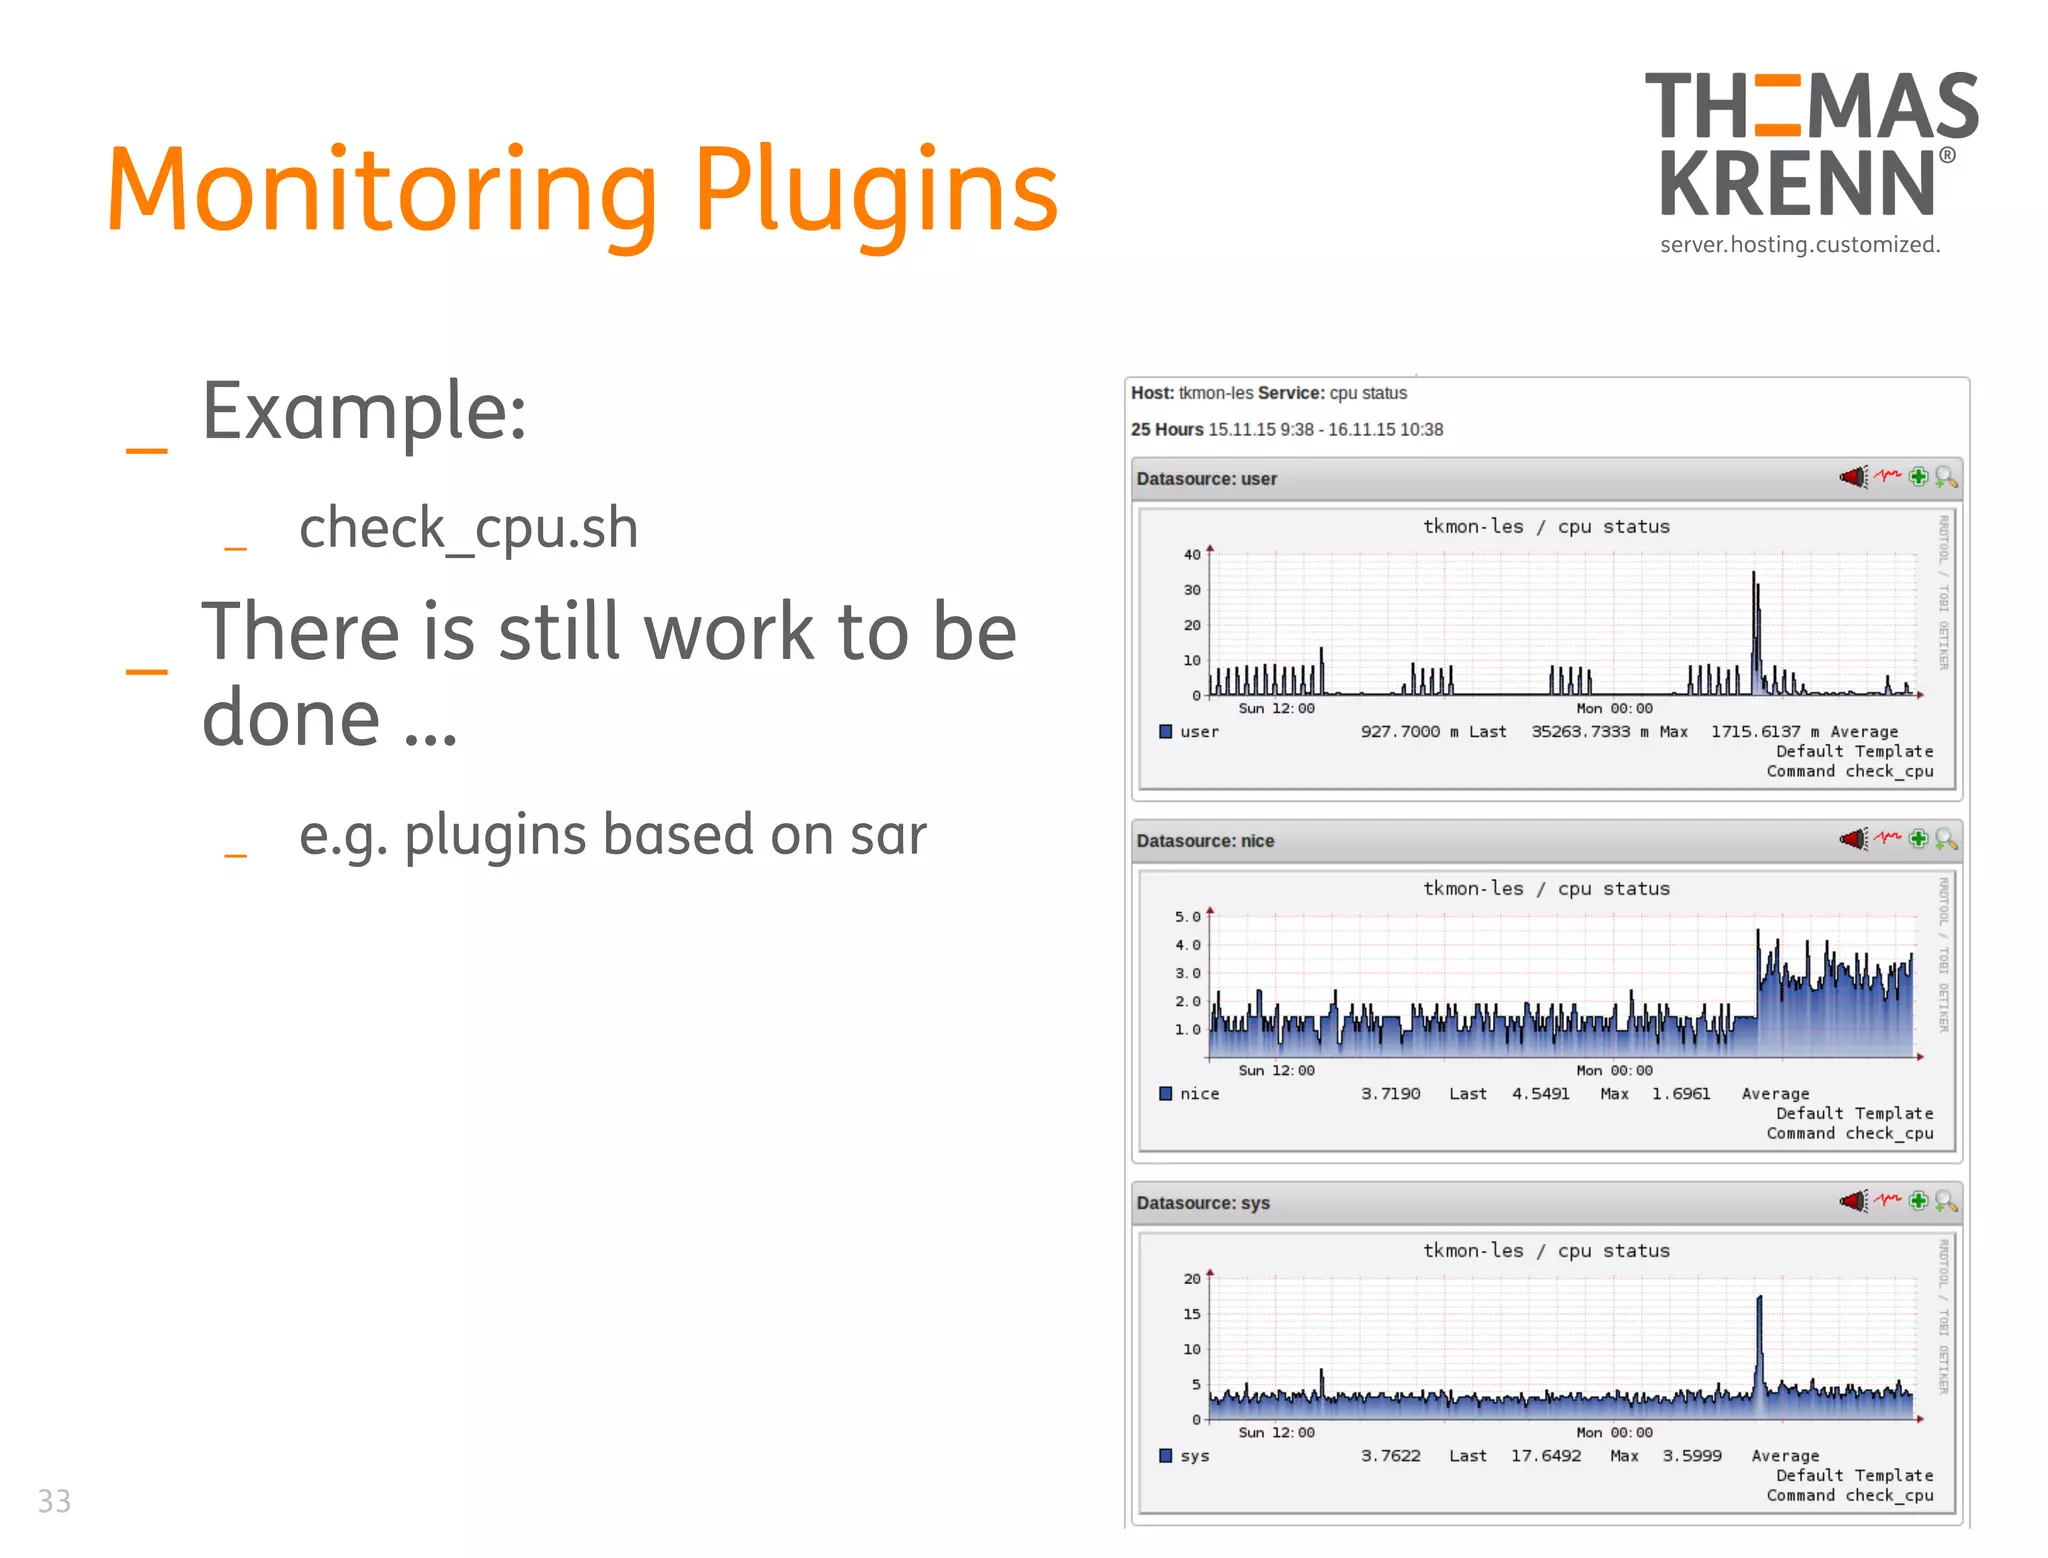
Monitoring Plugins
_ Example:
_ check_cpu.sh
_ There is still work to be
done …
_ e.g. plugins based on sar
34
Agenda
_ Collect Statistics
_ Sysstat Package
_ mpstat, vmstat,
pidstat, iostat
_ dstat, nicstat
_ sar, atop
_ Percona Cacti Template
_ Monitoring Plugins
_ Watch online
_ top
_ iotop
_ iftop
_ Tracing
_ perf_events
_ ftrace
_ perf-tools
_ Flame graphs
35
top
_ System summary at beginning
_ Per process metrics afterwards
_ Default sorted by CPU usage
$ top -b -n 1| head -15
top - 15:33:50 up 3 days, 19:02, 3 users, load average: 0.13, 0.51, 0.59
Tasks: 668 total, 1 running, 667 sleeping, 0 stopped, 0 zombie
Cpu(s): 1.5%us, 0.3%sy, 0.1%ni, 98.1%id, 0.0%wa, 0.0%hi, 0.0%si, 0.0%st
Mem: 132009356k total, 23457172k used, 108552184k free, 1600120k buffers
Swap: 3904444k total, 0k used, 3904444k free, 12682188k cached
PID USER PR NI VIRT RES SHR S %CPU %MEM TIME+ COMMAND
29276 root 20 0 6928 3488 668 S 19 0.0 22:55.72 ossec-syscheckd
1193 gschoenb 20 0 17728 1740 936 R 4 0.0 0:00.02 top
11257 root 20 0 22640 2636 1840 S 4 0.0 70:38.88 openvpn
19907 www-data 20 0 197m 61m 52m S 4 0.0 0:06.18 apache2
775 root 20 0 0 0 0 S 2 0.0 8:03.13 md3_raid10
3712 root 39 19 0 0 0 S 2 0.0 22:45.85 kipmi0
12807 root -3 0 0 0 0 S 2 0.0 6:20.30 drbd2_asender
18653 root 20 0 0 0 0 S 2 0.0 12:40.19 drbd1_receiver
1, 5 and 15 min
load average
36
top
_ Memory usage
_ VIRT The total size of virtual memory for the process
_ Also including e.g. shared libraries, not already mapped heap or
swap
_ how much memory the program is able to access at the moment
_ RES How many blocks are really allocated and mapped to
address space → resident
_ how much actual physical memory a process is consuming
_ SHR
_ how much of the VIRT size is actually sharable
- https://www.linux.com/learn/tutorials/42048-uncover-the-meaning-of-tops-statistics
- http://www.linuxdevcenter.com/pub/a/linux/2006/11/30/linux-out-of-memory.html
37
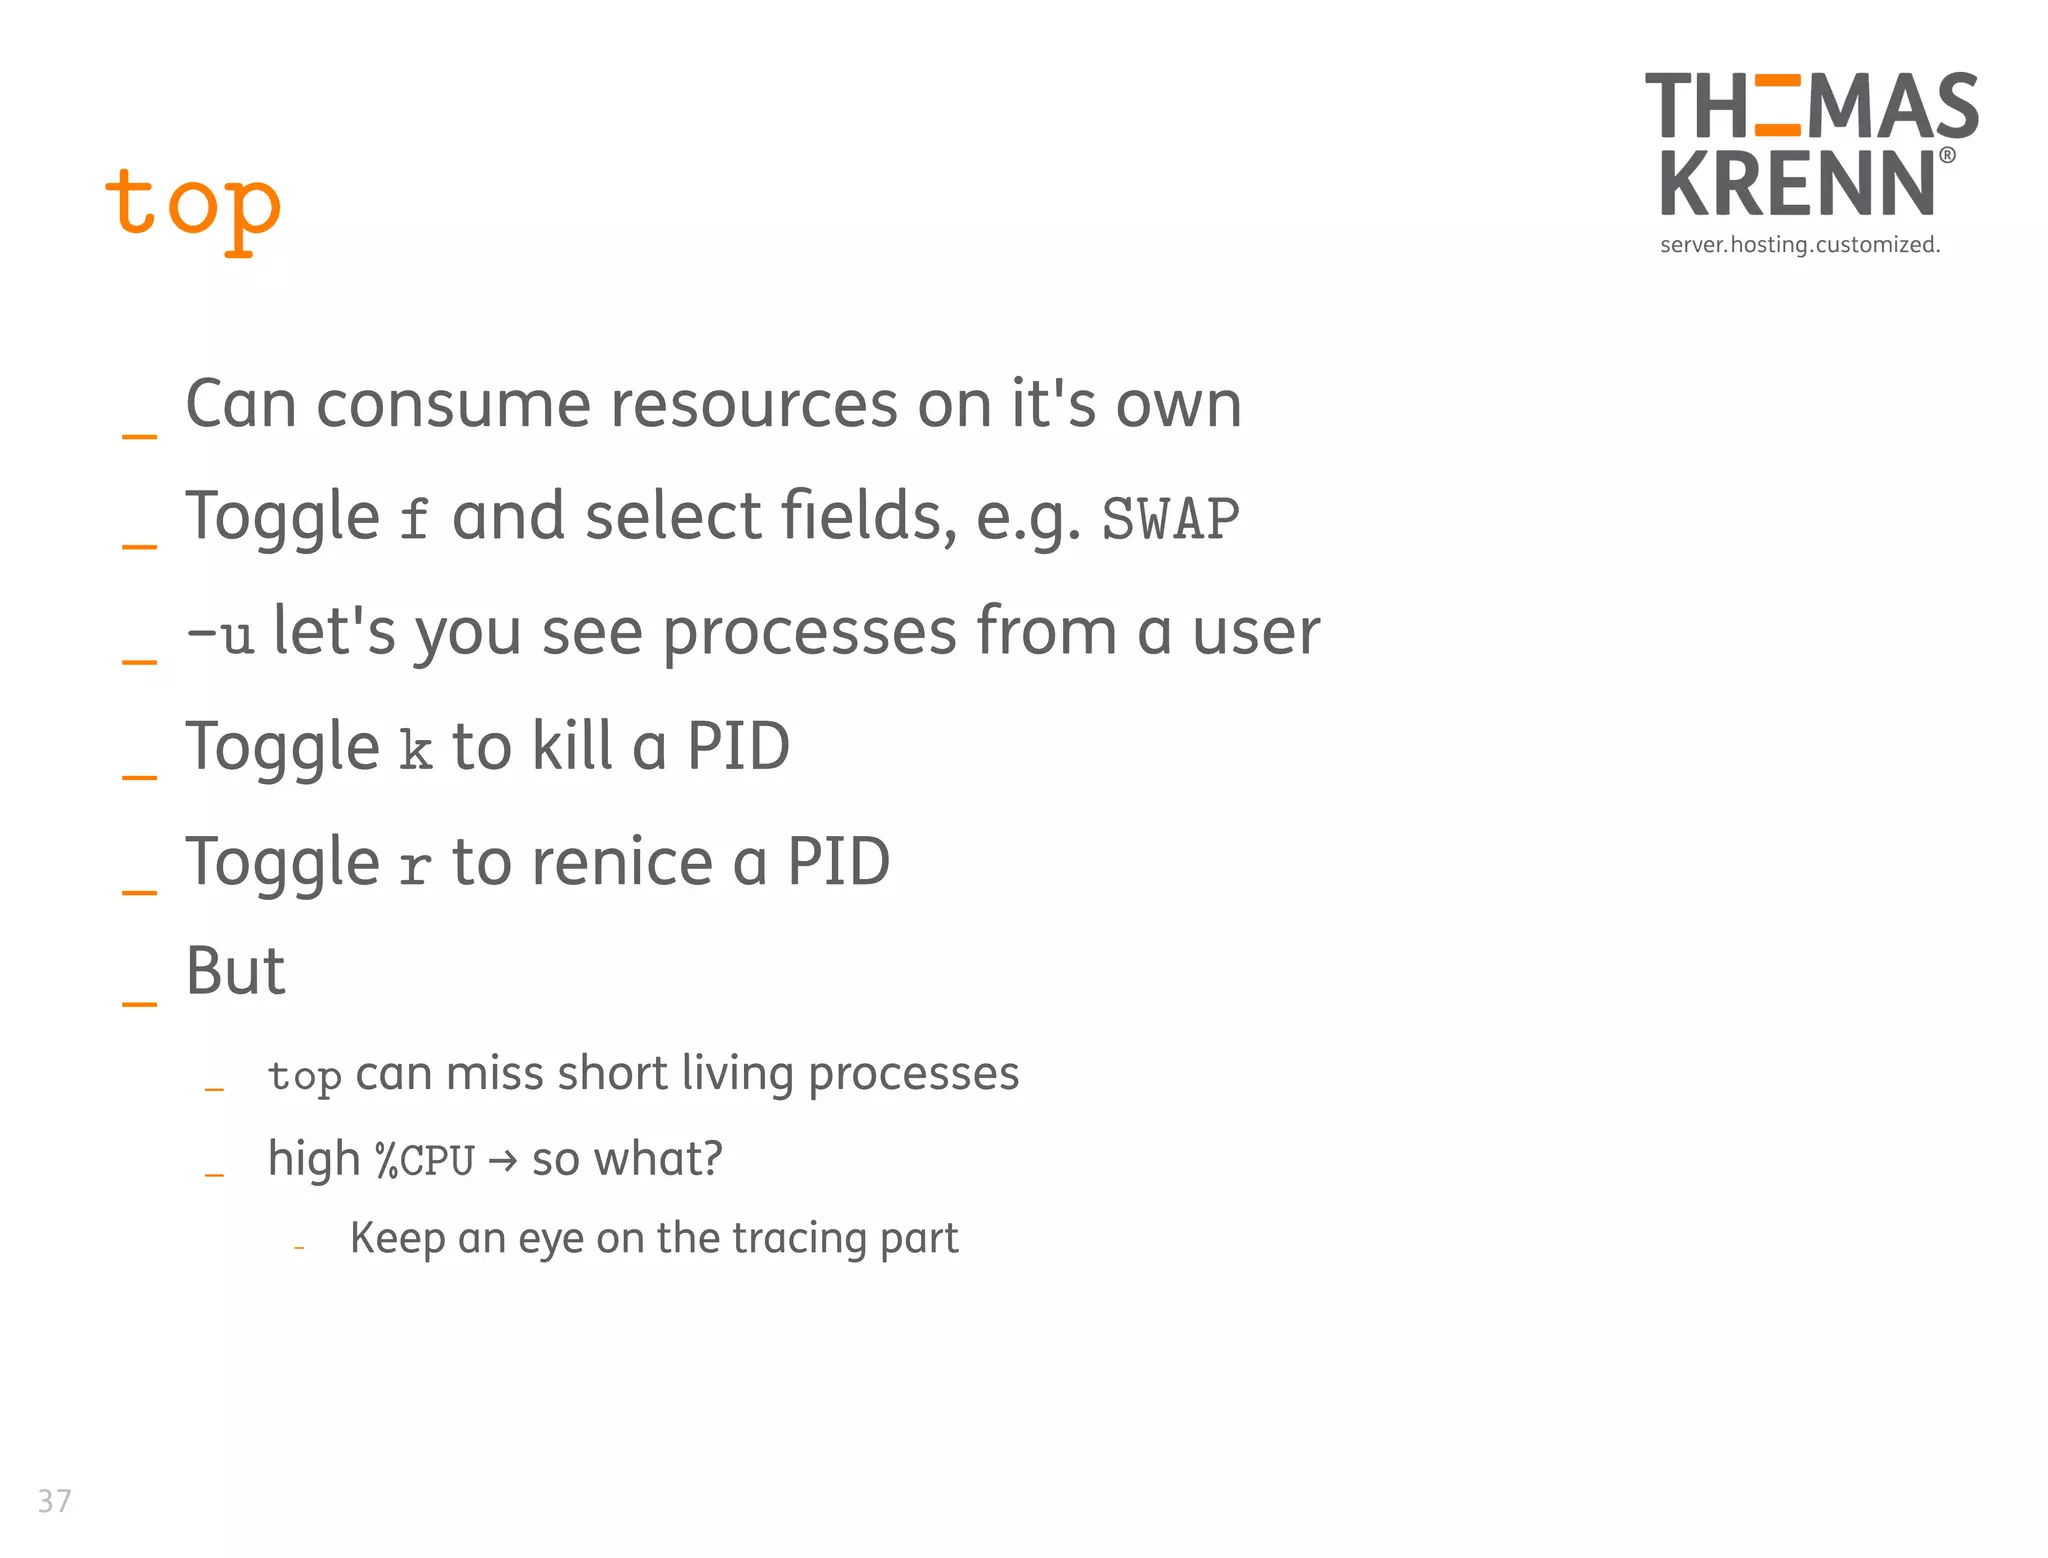
top
_ Can consume resources on it's own
_ Toggle f and select fields, e.g. SWAP
_ -u let's you see processes from a user
_ Toggle k to kill a PID
_ Toggle r to renice a PID
_ But
_ top can miss short living processes
_ high %CPU → so what?
_ Keep an eye on the tracing part
38
htop
_ „Super advanced“ top
_ Uses colors, views can be customized
39
iotop
_ Simple top like I/O monitor
_ Which process is causing I/O
_ Filtering specific PID is possible
# iotop -o -b
Total DISK READ : 0.00 B/s | Total DISK WRITE : 63.94 M/s
Actual DISK READ: 0.00 B/s | Actual DISK WRITE: 63.90 M/s
TID PRIO USER DISK READ DISK WRITE SWAPIN IO COMMAND
19153 be/4 root 0.00 B/s 63.89 M/s 0.00 % 75.44 % fio --rw=randwrite --name=test
--filename=test.fio --size=300M --direct=1 --bs=4k
17715 be/4 gschoenb 0.00 B/s 46.18 K/s 0.00 % 0.00 % firefox [mozStorage #1]
# iotop -o -b
Total DISK READ : 69.02 M/s | Total DISK WRITE : 65.92 K/s
Actual DISK READ: 69.02 M/s | Actual DISK WRITE: 345.12 K/s
TID PRIO USER DISK READ DISK WRITE SWAPIN IO COMMAND
19176 be/4 root 69.02 M/s 0.00 B/s 0.00 % 88.28 % fio --rw=read --name=test
--filename=test.fio --size=300M --direct=1 --bs=8k
Show writes, reads
and command in
realtime
40
Bandwidth live usage
_ iftop
_ Per interface usage
_ nethogs
_ Per process
NetHogs version 0.8.0
PID USER PROGRAM DEV SENT RECEIVED
17692 gschoenb /usr/lib/firefox/firefox eth0 0.162 0.194 KB/sec
16585 root /usr/bin/ssh eth0 0.000 0.000 KB/sec
16611 gschoenb evolution eth0 0.000 0.000 KB/sec
? root unknown TCP 0.000 0.000 KB/sec
TOTAL 0.162 0.194 KB/sec
13
20
41
42
Agenda
_ Collect Statistics
_ Sysstat Package
_ mpstat, vmstat,
pidstat, iostat
_ dstat, nicstat
_ sar, atop
_ Percona Cacti Template
_ Monitoring Plugins
_ Watch online
_ top
_ iotop
_ iftop
_ Tracing
_ perf_events
_ ftrace
_ perf-tools
_ Flame graphs
# whereis tracing
43
44
Profiling
_ Create profile about usage characteristics
_ Count specific samples/events
_ Count objects
_ Collecting statistics about tracepoints
_ Lines of kernel code with defined event
_ Next slides focus on system profiling
_ ftrace
_ perf_events and perf
45
ftrace
_ Part of the Linux kernel since 2.6.27 (2008)
_ What is going on inside the kernel
_ Common task is to trace events
_ With ftrace configured, only debugfs is
required
# cat /proc/sys/kernel/ftrace_enabled
1
# mount | grep debug
none on /sys/kernel/debug type debugfs (rw)
/sys/kernel/debug/tracing# cat available_tracers
blk mmiotrace function_graph wakeup_rt wakeup function nop
Most widely applicable,
traces kernel function
calls
46
iostat
Let's start the
live demo #2
47
ftrace
_ Interact with files in sys
_ Easier with trace-cmd → interface for sys files
# less /sys/kernel/debug/tracing/trace
#!/bin/bash
DEBUGFS=`grep debugfs /proc/mounts | awk '{ print $2; }'`
echo $$ > $DEBUGFS/tracing/set_ftrace_pid
echo function > $DEBUGFS/tracing/current_tracer
echo 1 > $DEBUGFS/tracing/tracing_on
$*
echo 0 > $DEBUGFS/tracing/tracing_on View the
recorded trace
48
perf_events and perf
_ Used to be called performance counters for
Linux
_ A lot of updates for kernel 4.1
_ https://lkml.org/lkml/2015/4/14/264
_ CPU performance counters, tracepoints,
kprobes and uprobes
_ Per package with linux-tools-common
# which perf
/usr/bin/perf
# dpkg -S /usr/bin/perf
linux-tools-common: /usr/bin/perf
49
perf list
_ perf list
_ Shows supported events
# perf list | wc -l
1779
# perf list | grep Hardware
cpu-cycles OR cycles [Hardware event]
instructions [Hardware event]
cache-references [Hardware event]
cache-misses [Hardware event]
branch-instructions OR branches [Hardware event]
branch-misses [Hardware event]
bus-cycles [Hardware event]
stalled-cycles-frontend OR idle-cycles-frontend [Hardware event]
stalled-cycles-backend OR idle-cycles-backend [Hardware event]
ref-cycles [Hardware event]
L1-dcache-loads [Hardware cache event]
L1-dcache-load-misses [Hardware cache event]
L1-dcache-stores [Hardware cache event]
L1-dcache-store-misses [Hardware cache event]
This also includes
static tracepoints
50
Raw CPU counters
_ Each CPU has it's own raw counters
_ They should be documented by the hardware manufacturer
_ https://download.01.org/perfmon/
_ libpfm4 is a nice way to find raw masks
# perf list | grep rNNN
rNNN [Raw hardware event descriptor]
# git clone git://perfmon2.git.sourceforge.net/gitroot/perfmon2/libpfm4
# cd libpfm4
# make
# cd examples/
# ./showevtinfo | grep LLC | grep MISSES
Name : LLC_MISSES
[...]
# ./check_events LLC_MISSES | grep Codes
Codes : 0x53412e
# perf stat -e r53412e sleep 5
Now we collect last
level cache misses
with the raw mask
51
Tracepoints
_ perf also has trace functionalities
_ Filesystem
_ Block layer
_ Syscalls
# perf list | grep -i trace | wc -l
1716
# perf stat -e 'syscalls:sys_enter_mmap' ./helloWorld.out
Hello world!
Performance counter stats for './helloWorld.out':
8 syscalls:sys_enter_mmap
0,000556961 seconds time elapsed
52
perf stat
_ Get a counter summary
# perf stat python numpy-matrix.py -i matrix.in
Performance counter stats for 'python numpy-matrix.py -i matrix.in':
576,104221 task-clock (msec) # 0,930 CPUs utilized
319 context-switches # 0,554 K/sec
4 cpu-migrations # 0,007 K/sec
9.738 page-faults # 0,017 M/sec
1.743.664.199 cycles # 3,027 GHz [82,63%]
831.364.029 stalled-cycles-frontend # 47,68% frontend cycles idle [83,75%]
458.760.523 stalled-cycles-backend # 26,31% backend cycles idle [67,26%]
2.793.953.303 instructions # 1,60 insns per cycle
# 0,30 stalled cycles per insn [84,28%]
573.342.473 branches # 995,206 M/sec [83,78%]
3.586.249 branch-misses # 0,63% of all branches [82,70%]
0,619482128 seconds time elapsed
A way to compare
performance of
different algorithms
53
perf record
_ Record samples to a file
_ Can be post-processed with perf report
_ -a records on all CPUs
_ -g records call graphs
_ Install debug symbols
# perf record -a -g sleep 5
[ perf record: Woken up 4 times to write data ]
[ perf record: Captured and wrote 2.157 MB perf.data (~94254 samples) ]
-a nice way to record
what's currently
running on all CPUs
-g enables call-graph
54
perf report
_ Displays profile of a record
_ Can be sorted and or filtered
_ Shows all samples
55
# perf report -i perf.data.dd --stdio --showcpuutilization --sort comm,dso
[...]
# Overhead sys usr Command Shared Object
# ........ ........ ........ ....... .................
95.00% 95.00% 0.00% dd [kernel.kallsyms]
|
|--33.22%-- _aesni_enc1
| __ablk_encrypt
| ablk_encrypt
| crypt_scatterlist
| crypt_extent
| ecryptfs_encrypt_page
| ecryptfs_write_end
| generic_file_buffered_write
| __generic_file_aio_write
| generic_file_aio_write
| do_sync_write
| vfs_write
| sys_write
| system_call_fastpath
| __GI___libc_write
| 0x415f65643d524550
|--9.11%-- _cond_resched
| |
| |--57.94%-- ext4_dirty_inode
| | __mark_inode_dirty
| | generic_write_end
| | ext4_da_write_end
| | generic_file_buffered_write
Command and shared object
Traced method
dd writes data
56
perf-tools
_ By Brendan Gregg
_ https://github.com/brendangregg/perf-tools
_ Mostly quick hacks, read Warnings!
_ Using perf_events and ftrace
_ Good examples what can be done with perf and
ftrace
_ iosnoop Shows I/O access for commands, including latency
_ cachestat Linux page cache hit/miss statistics
_ functrace Count kernel functions matching wildcards
Nice, this are simple
bash scripts!
57
perf-tools
Let's start the
live demo #3
19
20
58
# view flamegraph
59
60
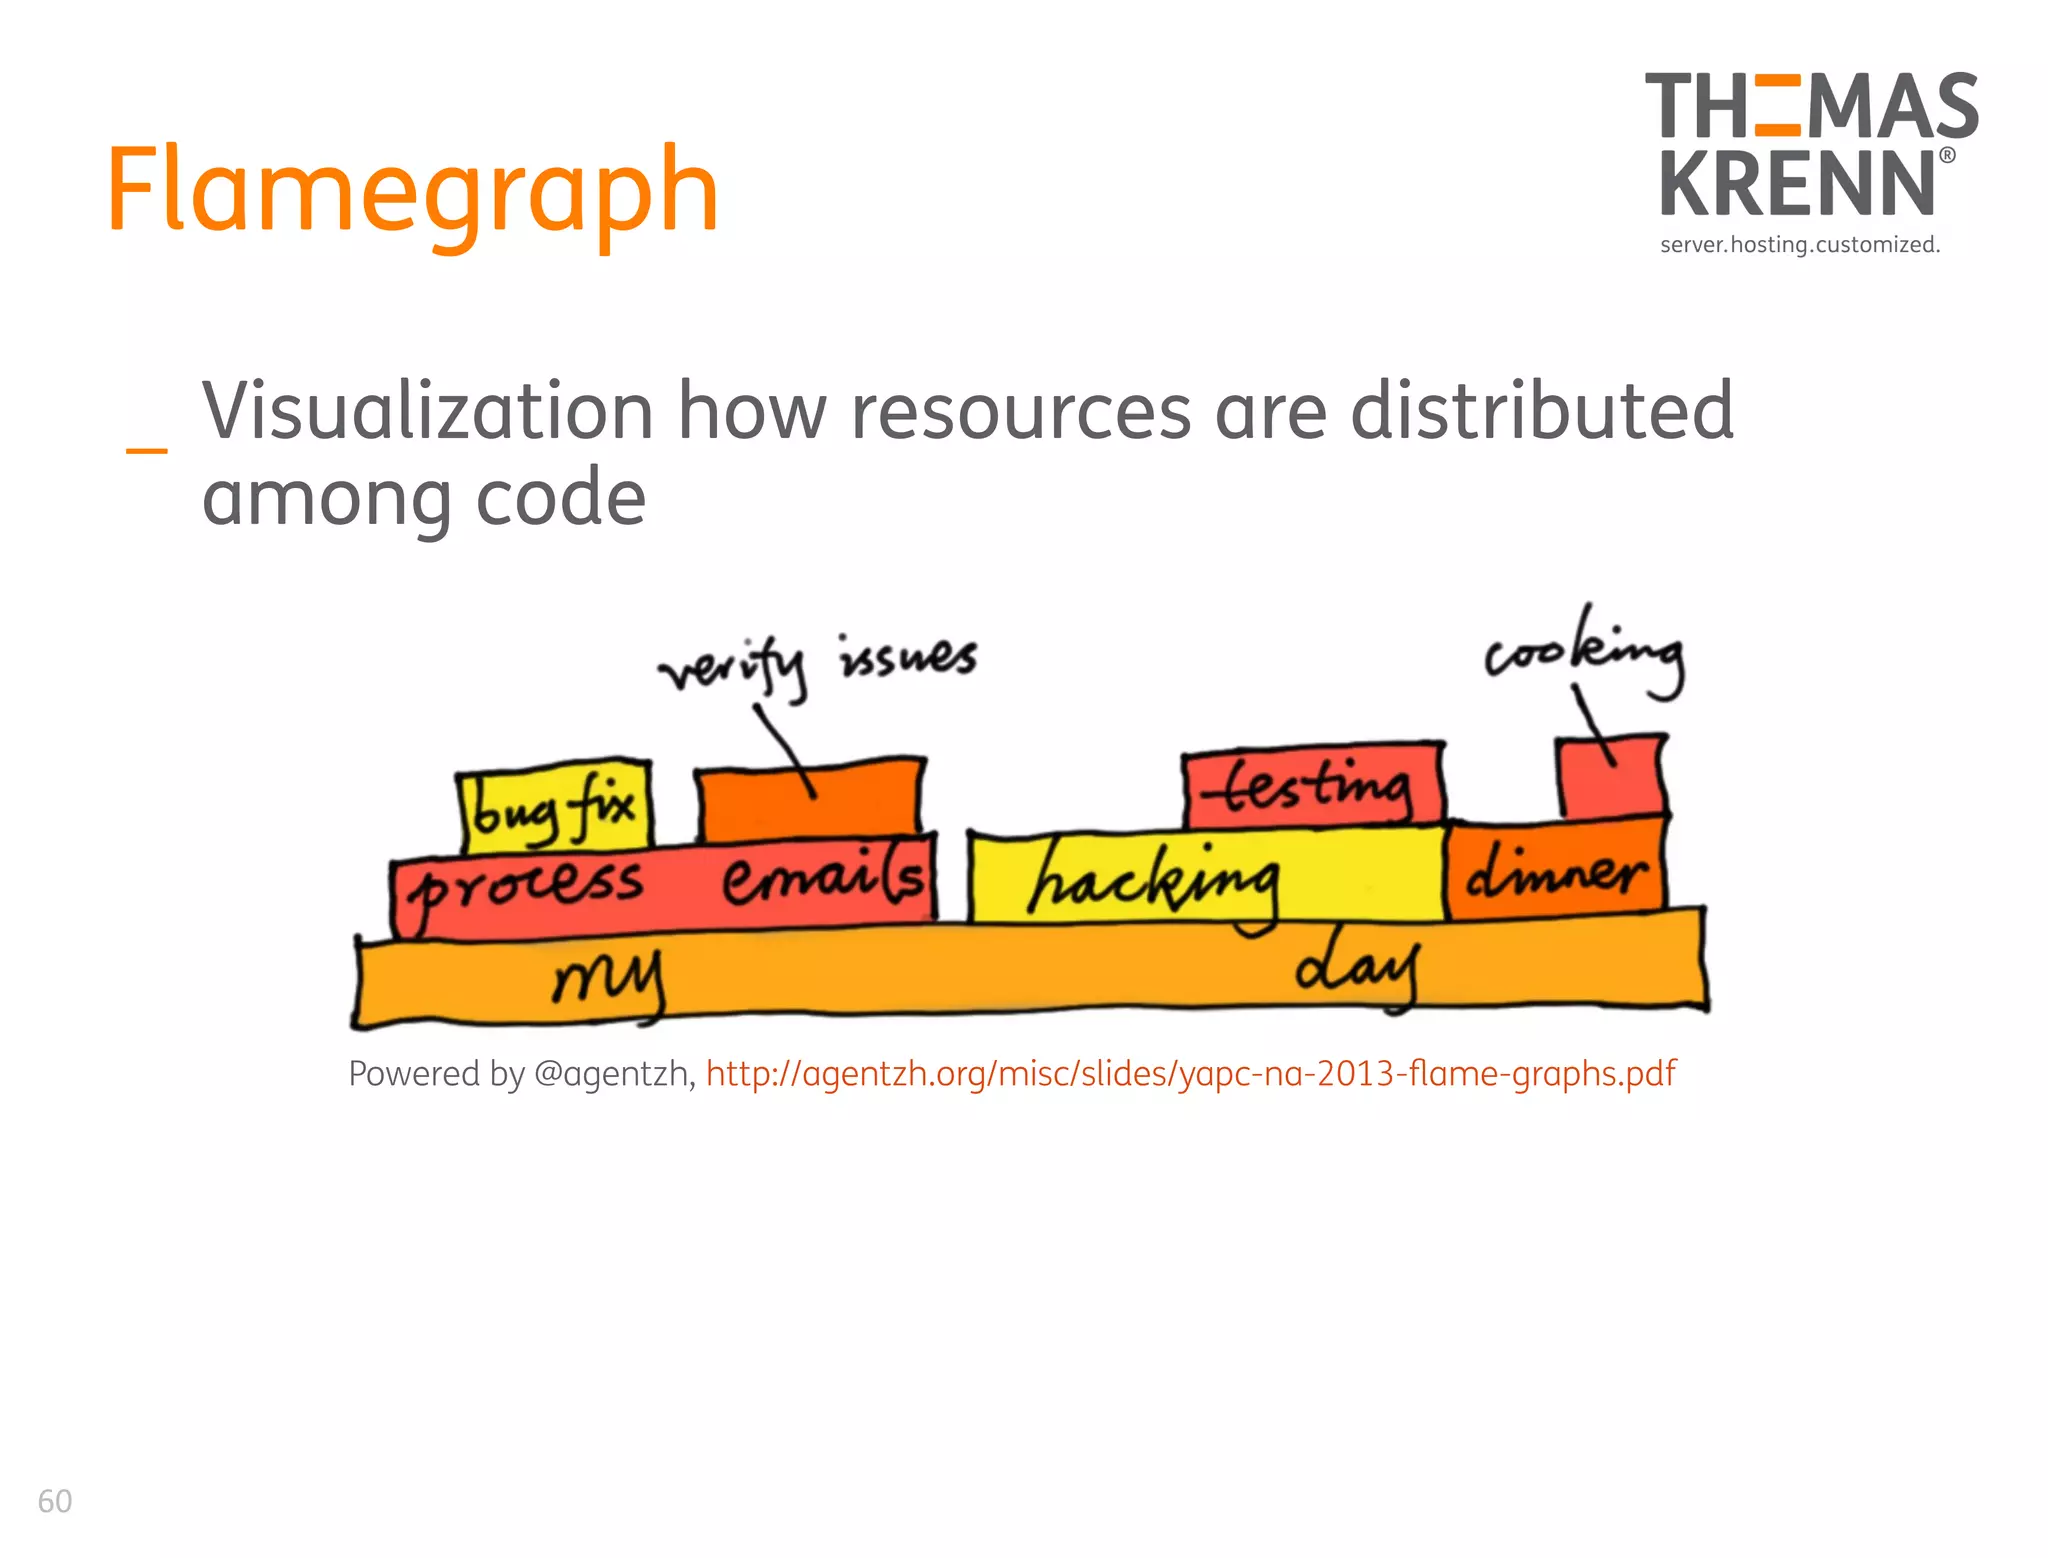
Flamegraph
_ Visualization how resources are distributed
among code
Powered by @agentzh, http://agentzh.org/misc/slides/yapc-na-2013-flame-graphs.pdf
61
Let's start the
live demo #4
Flamegraph
62
Flamegraph
# perf record -g dd if=/dev/zero of=test.data count=1 bs=1M
# mv perf.data perf.data.dd
# perf script -i perf.data.dd | ./FlameGraph/stackcollapse-perf.pl > out.dd.folded
# ./FlameGraph/flamegraph.pl out.dd.folded > out.perf.dd.svg
63
Questions?
Thanks for your attention!
_ wfischer AT thomas-krenn.com
_ @wefinet

OSMC 2015: Linux Performance Profiling and Monitoring by Werner Fischer

  • 1.
    Linux Performance Profiling andMonitoring Werner Fischer & Georg Schönberger @wefinet
  • 2.
    2 Thomas-Krenn.AG _ A servermanufacturer in Bavaria, Germany _ Well visited knowledge base, Thomas-Krenn Wiki (parts in English)
  • 3.
    3 Agenda _ Collect Statistics _Sysstat Package _ mpstat, vmstat, pidstat, iostat _ dstat, nicstat _ sar, atop _ Percona Cacti Template _ Monitoring Plugins _ Watch online _ top _ iotop _ iftop _ Tracing _ perf_events _ ftrace _ perf-tools _ Flame graphs
  • 4.
    # find /-type f -name statistics 4
  • 5.
    From Brendan Gregg,http://www.brendangregg.com/linuxperf.html5
  • 6.
    From Brendan Gregg,http://www.brendangregg.com/linuxperf.html6
  • 7.
  • 8.
    8 mpstat _ Reports CPUrelated statistics (using /proc/stat) _ Without Interval/Count → since system startup _ CPU usage per Core (incl. Hyperthreading) _ Check how well usage is balanced # mpstat -P ALL Linux 3.13.0-48-generic (X220) 2015-04-14 _x86_64_ (4 CPU) 14:28:21 CPU %usr %nice %sys %iowait %irq %soft %steal %guest %gnice %idle 14:28:21 all 11,59 0,09 3,62 0,03 0,00 0,04 0,00 0,00 0,00 84,64 14:28:21 0 6,45 0,05 1,87 0,04 0,00 0,07 0,00 0,00 0,00 91,53 14:28:21 1 16,44 0,11 5,56 0,01 0,00 0,00 0,00 0,00 0,00 77,89 14:28:21 2 17,15 0,14 5,55 0,03 0,00 0,05 0,00 0,00 0,00 77,08 14:28:21 3 16,27 0,11 4,89 0,01 0,00 0,02 0,00 0,00 0,00 78,70 # lscpu | grep -E 'core|socket' Thread(s) per core: 2 Core(s) per socket: 2
  • 9.
    9 mpstat # mpstat -PALL 1 2 Linux 3.13.0-48-generic (X220) 2015-04-14 _x86_64_ (4 CPU) 15:24:44 CPU %usr %nice %sys %iowait %irq %soft %steal %guest %gnice %idle 15:24:45 all 5,21 0,00 7,12 17,81 0,00 0,27 0,00 0,00 0,00 69,59 15:24:45 0 1,43 0,00 1,43 0,00 0,00 2,86 0,00 0,00 0,00 94,29 15:24:45 1 11,88 0,00 23,76 64,36 0,00 0,00 0,00 0,00 0,00 0,00 15:24:45 2 4,12 0,00 1,03 0,00 0,00 0,00 0,00 0,00 0,00 94,85 15:24:45 3 3,03 0,00 1,01 0,00 0,00 0,00 0,00 0,00 0,00 95,96 15:24:45 CPU %usr %nice %sys %iowait %irq %soft %steal %guest %gnice %idle 15:24:46 all 5,74 0,00 7,10 17,76 0,00 0,55 0,00 0,00 0,00 68,85 15:24:46 0 2,99 0,00 1,49 0,00 0,00 2,99 0,00 0,00 0,00 92,54 15:24:46 1 11,88 0,00 23,76 64,36 0,00 0,00 0,00 0,00 0,00 0,00 15:24:46 2 6,00 0,00 1,00 0,00 0,00 0,00 0,00 0,00 0,00 93,00 15:24:46 3 1,01 0,00 1,01 0,00 0,00 0,00 0,00 0,00 0,00 97,98 Core 1 is not idle and also deals with %iowait
  • 10.
    10 vmstat _ High LevelStatistics about _ Virtual memory _ Swap/Paging _ I/O statistics _ System interrupts and context switches _ CPU statistics # vmstat 1 procs -----------memory---------- ---swap-- -----io---- -system-- ------cpu----- r b swpd free buff cache si so bi bo in cs us sy id wa st 3 0 172 371856 137088 3125664 0 0 0 153060 7618 7059 17 9 56 17 0 3 0 172 416596 137096 3125704 0 0 0 163420 8689 7419 11 10 61 17 0 0 0 172 451716 137096 3089916 0 0 0 0 396 1848 3 1 96 0 0 0 0 172 413916 137108 3118796 0 0 0 52 502 2218 9 2 90 0 0 2 0 172 399756 137108 3118860 0 0 284884 0 14830 10941 10 13 66 12 0 1 1 172 364948 137108 3118988 0 0 310792 0 16204 12738 20 13 53 14 0
  • 11.
    11 vmstat _ Memory statistics _buff Raw disk blocks like filesystem metadata (superblocks, inodes) _ cache Memory used for data -> pages with actual contents $ vmstat 1 procs -----------memory---------- ---swap-- -----io---- -system-- ------cpu----- r b swpd free buff cache si so bi bo in cs us sy id wa st 0 0 172 607760 182172 3313684 0 0 159 496 154 222 18 6 76 0 0 0 0 172 607628 182172 3313684 0 0 0 52 387 2008 4 2 95 0 0 0 0 172 607348 182172 3313684 0 0 0 0 397 2034 4 1 95 0 0 0 0 172 606448 182172 3313684 0 0 0 0 378 1896 4 2 94 0 0 $ free total used free shared buffers cached Mem: 8056664 7450316 606348 491820 182172 3313684 -/+ buffers/cache: 3954460 4102204 Swap: 1048572 172 1048400
  • 12.
    12 vmstat _ Process relatedfields _ r The number of runnable processes (running or waiting for run time) _ If high → indicator for saturation _ b The number of processes in uninterruptible sleep _ Mostly waiting for I/O # vmstat 1 procs -----------memory---------- ---swap-- -----io---- -system-- ------cpu----- r b swpd free buff cache si so bi bo in cs us sy id wa st [...] 0 1 172 404768 137088 3125664 0 0 0 167524 9029 6955 6 6 70 18 0 0 1 172 399956 137088 3125664 0 0 0 138340 8133 6165 7 7 68 19 0 $ ps -eo ppid,pid,user,stat,pcpu,comm,wchan:32 | grep ext4 [...] 7159 7161 root Ds 3.2 fio ext4_file_write 7159 7162 root Ds 3.2 fio ext4_file_write 7159 7164 root Ds 3.2 fio ext4_file_write Kernel function process is sleeping on Processes doing I/O can be in waiting state
  • 13.
    13 vmstat plots, e.g.gnuplot https://clusterbuffer.wordpress.com/admin-tools/vmstat-plotter/ Drawing interrupts and context switches
  • 14.
    But we arenot satisfied with summaries and overviews... 14
  • 15.
    What is PID9059 doing? 15
  • 16.
    16 pidstat _ Report statisticsfor tasks being managed by kernel _ CPU bound → identify peak activity $ top -b -n 1 -d 2 -o %CPU | head [...] PID USER PR NI VIRT RES SHR S %CPU %MEM TIME+ COMMAND 9059 gschoenb 20 0 47532 21132 2444 R 96,9 0,3 0:02.14 python 1 root 20 0 33880 3256 1500 S 0,0 0,0 0:02.35 init $ pidstat -p 9059 -u 1 -l Linux 3.13.0-48-generic (X220) 2015-04-15 _x86_64_ (4 CPU) 10:11:04 UID PID %usr %system %guest %CPU CPU Command 10:11:05 1000 9059 100,00 0,00 0,00 100,00 0 python ijk-matrix.py -i matrix.in 10:11:06 1000 9059 100,00 0,00 0,00 100,00 0 python ijk-matrix.py -i matrix.in 10:11:07 1000 9059 100,00 0,00 0,00 100,00 0 python ijk-matrix.py -i matrix.in Even check command line arguments (“-l”) !
  • 17.
    17 pidstat _ I/O bound→ device report # mpstat -P ALL 1 10:25:31 CPU %usr %nice %sys %iowait %irq %soft %steal %guest %gnice %idle 10:25:32 all 14,88 0,00 9,40 13,84 0,00 1,04 0,00 0,00 0,00 60,84 10:25:32 0 22,45 0,00 1,02 0,00 0,00 0,00 0,00 0,00 0,00 76,53 10:25:32 1 13,73 0,00 34,31 51,96 0,00 0,00 0,00 0,00 0,00 0,00 10:25:32 2 17,86 0,00 0,00 0,00 0,00 3,57 0,00 0,00 0,00 78,57 10:25:32 3 6,12 0,00 0,00 0,00 0,00 0,00 0,00 0,00 0,00 93,88 # pidstat -d 1 Linux 3.13.0-48-generic (X220) 2015-04-15 _x86_64_ (4 CPU) 10:26:35 UID PID kB_rd/s kB_wr/s kB_ccwr/s Command 10:26:36 0 9208 0,00 2303,85 0,00 fio 10:26:36 0 9209 0,00 2996,15 0,00 fio 10:26:36 0 9210 0,00 2023,08 0,00 fio 10:26:36 0 9211 0,00 1284,62 0,00 fio Which process is causing %iowait? Device report reveals command and I/O
  • 18.
    18 pidstat _ How muchmemory is PID 8461 using? _ Major page faults require loading memory page from disk → more RAM needed! # pidstat -r -p 8461 1 3 Linux 3.13.0-49-generic (X220) 2015-04-21 _x86_64_ (4 CPU) 10:09:06 UID PID minflt/s majflt/s VSZ RSS %MEM Command 10:09:07 1000 8461 8,00 0,00 2018384 786688 9,76 firefox 10:09:08 1000 8461 11,00 0,00 2018384 786688 9,76 firefox 10:09:09 1000 8461 23,00 0,00 2018448 786892 9,77 firefox Average: 1000 8461 14,00 0,00 2018405 786756 9,77 firefox Current used share of physical memory Minor and major page faults
  • 19.
    19 iostat _ I/O subsystemstatistics _ CPU (-c) or device utilization (-d) report _ Without argument → summary since boot _ Skip that with -y option # iostat Linux 3.13.0-48-generic (X220) 2015-04-15 _x86_64_ (4 CPU) avg-cpu: %user %nice %system %iowait %steal %idle 16,16 0,09 4,79 0,46 0,00 78,50 Device: tps kB_read/s kB_wrtn/s kB_read kB_wrtn sda 83,80 41,64 531,43 22375057 285581196
  • 20.
  • 21.
    21 iostat _ CPU utilreport → %iowait _ Not really reliable → %iowait is some kind of %idle time # taskset 1 fio –rw=randwrite [...] & # iostat -y -c 1 3 […] avg-cpu: %user %nice %system %iowait %steal %idle 17,32 0,00 6,56 13,65 0,00 62,47 # taskset 1 sh -c "while true; do true; done" & # iostat -y -c 1 3 avg-cpu: %user %nice %system %iowait %steal %idle 35,59 0,00 7,02 0,00 0,00 57,39 http://www.percona.com/blog/2014/06/03/trust-vmstat-iowait-numbers/
  • 22.
    22 iostat _ Extended deviceutil report (“-x”) → %util _ man iostat → … for devices serving request serially, for parallel processing (RAID arrays and SSDs), this number does not reflect their performance limits. _ In theory _ 94,4% util → 23032 IOPS _ 99,6% util → 24300 IOPS
  • 23.
    23 iostat # iostat -y-d -x 1 3 Linux 3.13.0-48-generic (X220) 2015-04-15 _x86_64_ (4 CPU) Device: rrqm/s wrqm/s r/s w/s rkB/s wkB/s avgrq-sz avgqu-sz await r_await w_await svctm %util sda 0,00 2,00 0,00 23032,00 0,00 92136,00 8,00 2,90 0,13 0,00 0,13 0,04 94,40 # iostat -y -d -x 1 3 Linux 3.13.0-48-generic (X220) 2015-04-15 _x86_64_ (4 CPU) Device: rrqm/s wrqm/s r/s w/s rkB/s wkB/s avgrq-sz avgqu-sz await r_await w_await svctm %util sda 0,00 2917,00 0,00 43175,00 0,00 184500,00 8,55 135,75 3,15 0,00 3,15 0,02 99,60 Only 5% util increase, but IOPS nearly doubled!
  • 24.
  • 25.
    25 iostat -cx /-dx _ avgqu-sz Avg. queue length of requests issued _ (delta[time_in_queue] / interval) / 1000.0 _ time_in_queue Requets waiting for device, effected by in_flight _ await Avg. time requests being served _ delta[read_ticks + write_ticks] / delta[read_IOs + write_Ios] _ ticks also effected by in_flight _ Therefore serving more requests while await is not increasing, is a good performance indicator - Monitoring IO Performance using iostat and pt-diskstats - Block layer statistics
  • 26.
  • 27.
    27 dstat _ Combines severalclassical tools _ Replacement for vmstat, iostat, ifstat _ Prints metrics and uses colors _ Has a plugin concept
  • 28.
    28 nicstat _ Print networkdevice statistics _ %Util depends on speed and duplex mode _ Sat also takes errors into account # nicstat -l Int Loopback Mbit/s Duplex State vboxnet0 No 0 unkn up eth0 No 1000 full up lo Yes - unkn up wlan0 No 0 unkn up # nicstat -i eth0 1 5 Time Int rKB/s wKB/s rPk/s wPk/s rAvs wAvs %Util Sat 14:52:21 eth0 3.08 0.36 3.13 2.48 1007.6 149.4 0.00 0.05 14:52:22 eth0 19.89 1.23 16.98 17.97 1199.6 70.00 0.02 0.00 14:52:23 eth0 21.42 1.09 21.99 16.00 997.1 70.00 0.02 0.00 # nicstat -i eth0 -t 1 2 14:57:36 InKB OutKB InSeg OutSeg Reset AttF %ReTX InConn OutCon Drops TCP 0.00 0.00 2.88 2.51 0.02 0.00 0.000 0.00 0.04 0.00 14:57:37 InKB OutKB InSeg OutSeg Reset AttF %ReTX InConn OutCon Drops TCP 0.00 0.00 0.00 0.00 0.00 0.00 0.000 0.00 0.00 0.00 Check if your network is saturated, Drops can be an indicator!
  • 29.
    Do you havea history of your system's performance data? yes no 29
  • 30.
    30 sar (part ofsysstat) _ It's easy with system activity reporter _ sar, sadc, sa1 and sa2, sadf http://www.brendangregg.com/Perf/linux_observability_sar.png
  • 31.
    31 ksar _ LC_ALL=POSIX sar-A -f sa10 > ksar.out.txt Mitigates character encoding and number format problems
  • 32.
    32 Percona Cacti Template _Percona Linux Monitoring Template for Cacti _ generate many graphs easily https://www.percona.com/doc/percona-monitoring- plugins/1.1/cacti/linux-templates.html
  • 33.
    33 Monitoring Plugins _ Example: _check_cpu.sh _ There is still work to be done … _ e.g. plugins based on sar
  • 34.
    34 Agenda _ Collect Statistics _Sysstat Package _ mpstat, vmstat, pidstat, iostat _ dstat, nicstat _ sar, atop _ Percona Cacti Template _ Monitoring Plugins _ Watch online _ top _ iotop _ iftop _ Tracing _ perf_events _ ftrace _ perf-tools _ Flame graphs
  • 35.
    35 top _ System summaryat beginning _ Per process metrics afterwards _ Default sorted by CPU usage $ top -b -n 1| head -15 top - 15:33:50 up 3 days, 19:02, 3 users, load average: 0.13, 0.51, 0.59 Tasks: 668 total, 1 running, 667 sleeping, 0 stopped, 0 zombie Cpu(s): 1.5%us, 0.3%sy, 0.1%ni, 98.1%id, 0.0%wa, 0.0%hi, 0.0%si, 0.0%st Mem: 132009356k total, 23457172k used, 108552184k free, 1600120k buffers Swap: 3904444k total, 0k used, 3904444k free, 12682188k cached PID USER PR NI VIRT RES SHR S %CPU %MEM TIME+ COMMAND 29276 root 20 0 6928 3488 668 S 19 0.0 22:55.72 ossec-syscheckd 1193 gschoenb 20 0 17728 1740 936 R 4 0.0 0:00.02 top 11257 root 20 0 22640 2636 1840 S 4 0.0 70:38.88 openvpn 19907 www-data 20 0 197m 61m 52m S 4 0.0 0:06.18 apache2 775 root 20 0 0 0 0 S 2 0.0 8:03.13 md3_raid10 3712 root 39 19 0 0 0 S 2 0.0 22:45.85 kipmi0 12807 root -3 0 0 0 0 S 2 0.0 6:20.30 drbd2_asender 18653 root 20 0 0 0 0 S 2 0.0 12:40.19 drbd1_receiver 1, 5 and 15 min load average
  • 36.
    36 top _ Memory usage _VIRT The total size of virtual memory for the process _ Also including e.g. shared libraries, not already mapped heap or swap _ how much memory the program is able to access at the moment _ RES How many blocks are really allocated and mapped to address space → resident _ how much actual physical memory a process is consuming _ SHR _ how much of the VIRT size is actually sharable - https://www.linux.com/learn/tutorials/42048-uncover-the-meaning-of-tops-statistics - http://www.linuxdevcenter.com/pub/a/linux/2006/11/30/linux-out-of-memory.html
  • 37.
    37 top _ Can consumeresources on it's own _ Toggle f and select fields, e.g. SWAP _ -u let's you see processes from a user _ Toggle k to kill a PID _ Toggle r to renice a PID _ But _ top can miss short living processes _ high %CPU → so what? _ Keep an eye on the tracing part
  • 38.
    38 htop _ „Super advanced“top _ Uses colors, views can be customized
  • 39.
    39 iotop _ Simple toplike I/O monitor _ Which process is causing I/O _ Filtering specific PID is possible # iotop -o -b Total DISK READ : 0.00 B/s | Total DISK WRITE : 63.94 M/s Actual DISK READ: 0.00 B/s | Actual DISK WRITE: 63.90 M/s TID PRIO USER DISK READ DISK WRITE SWAPIN IO COMMAND 19153 be/4 root 0.00 B/s 63.89 M/s 0.00 % 75.44 % fio --rw=randwrite --name=test --filename=test.fio --size=300M --direct=1 --bs=4k 17715 be/4 gschoenb 0.00 B/s 46.18 K/s 0.00 % 0.00 % firefox [mozStorage #1] # iotop -o -b Total DISK READ : 69.02 M/s | Total DISK WRITE : 65.92 K/s Actual DISK READ: 69.02 M/s | Actual DISK WRITE: 345.12 K/s TID PRIO USER DISK READ DISK WRITE SWAPIN IO COMMAND 19176 be/4 root 69.02 M/s 0.00 B/s 0.00 % 88.28 % fio --rw=read --name=test --filename=test.fio --size=300M --direct=1 --bs=8k Show writes, reads and command in realtime
  • 40.
    40 Bandwidth live usage _iftop _ Per interface usage _ nethogs _ Per process NetHogs version 0.8.0 PID USER PROGRAM DEV SENT RECEIVED 17692 gschoenb /usr/lib/firefox/firefox eth0 0.162 0.194 KB/sec 16585 root /usr/bin/ssh eth0 0.000 0.000 KB/sec 16611 gschoenb evolution eth0 0.000 0.000 KB/sec ? root unknown TCP 0.000 0.000 KB/sec TOTAL 0.162 0.194 KB/sec
  • 41.
  • 42.
    42 Agenda _ Collect Statistics _Sysstat Package _ mpstat, vmstat, pidstat, iostat _ dstat, nicstat _ sar, atop _ Percona Cacti Template _ Monitoring Plugins _ Watch online _ top _ iotop _ iftop _ Tracing _ perf_events _ ftrace _ perf-tools _ Flame graphs
  • 43.
  • 44.
    44 Profiling _ Create profileabout usage characteristics _ Count specific samples/events _ Count objects _ Collecting statistics about tracepoints _ Lines of kernel code with defined event _ Next slides focus on system profiling _ ftrace _ perf_events and perf
  • 45.
    45 ftrace _ Part ofthe Linux kernel since 2.6.27 (2008) _ What is going on inside the kernel _ Common task is to trace events _ With ftrace configured, only debugfs is required # cat /proc/sys/kernel/ftrace_enabled 1 # mount | grep debug none on /sys/kernel/debug type debugfs (rw) /sys/kernel/debug/tracing# cat available_tracers blk mmiotrace function_graph wakeup_rt wakeup function nop Most widely applicable, traces kernel function calls
  • 46.
  • 47.
    47 ftrace _ Interact withfiles in sys _ Easier with trace-cmd → interface for sys files # less /sys/kernel/debug/tracing/trace #!/bin/bash DEBUGFS=`grep debugfs /proc/mounts | awk '{ print $2; }'` echo $$ > $DEBUGFS/tracing/set_ftrace_pid echo function > $DEBUGFS/tracing/current_tracer echo 1 > $DEBUGFS/tracing/tracing_on $* echo 0 > $DEBUGFS/tracing/tracing_on View the recorded trace
  • 48.
    48 perf_events and perf _Used to be called performance counters for Linux _ A lot of updates for kernel 4.1 _ https://lkml.org/lkml/2015/4/14/264 _ CPU performance counters, tracepoints, kprobes and uprobes _ Per package with linux-tools-common # which perf /usr/bin/perf # dpkg -S /usr/bin/perf linux-tools-common: /usr/bin/perf
  • 49.
    49 perf list _ perflist _ Shows supported events # perf list | wc -l 1779 # perf list | grep Hardware cpu-cycles OR cycles [Hardware event] instructions [Hardware event] cache-references [Hardware event] cache-misses [Hardware event] branch-instructions OR branches [Hardware event] branch-misses [Hardware event] bus-cycles [Hardware event] stalled-cycles-frontend OR idle-cycles-frontend [Hardware event] stalled-cycles-backend OR idle-cycles-backend [Hardware event] ref-cycles [Hardware event] L1-dcache-loads [Hardware cache event] L1-dcache-load-misses [Hardware cache event] L1-dcache-stores [Hardware cache event] L1-dcache-store-misses [Hardware cache event] This also includes static tracepoints
  • 50.
    50 Raw CPU counters _Each CPU has it's own raw counters _ They should be documented by the hardware manufacturer _ https://download.01.org/perfmon/ _ libpfm4 is a nice way to find raw masks # perf list | grep rNNN rNNN [Raw hardware event descriptor] # git clone git://perfmon2.git.sourceforge.net/gitroot/perfmon2/libpfm4 # cd libpfm4 # make # cd examples/ # ./showevtinfo | grep LLC | grep MISSES Name : LLC_MISSES [...] # ./check_events LLC_MISSES | grep Codes Codes : 0x53412e # perf stat -e r53412e sleep 5 Now we collect last level cache misses with the raw mask
  • 51.
    51 Tracepoints _ perf alsohas trace functionalities _ Filesystem _ Block layer _ Syscalls # perf list | grep -i trace | wc -l 1716 # perf stat -e 'syscalls:sys_enter_mmap' ./helloWorld.out Hello world! Performance counter stats for './helloWorld.out': 8 syscalls:sys_enter_mmap 0,000556961 seconds time elapsed
  • 52.
    52 perf stat _ Geta counter summary # perf stat python numpy-matrix.py -i matrix.in Performance counter stats for 'python numpy-matrix.py -i matrix.in': 576,104221 task-clock (msec) # 0,930 CPUs utilized 319 context-switches # 0,554 K/sec 4 cpu-migrations # 0,007 K/sec 9.738 page-faults # 0,017 M/sec 1.743.664.199 cycles # 3,027 GHz [82,63%] 831.364.029 stalled-cycles-frontend # 47,68% frontend cycles idle [83,75%] 458.760.523 stalled-cycles-backend # 26,31% backend cycles idle [67,26%] 2.793.953.303 instructions # 1,60 insns per cycle # 0,30 stalled cycles per insn [84,28%] 573.342.473 branches # 995,206 M/sec [83,78%] 3.586.249 branch-misses # 0,63% of all branches [82,70%] 0,619482128 seconds time elapsed A way to compare performance of different algorithms
  • 53.
    53 perf record _ Recordsamples to a file _ Can be post-processed with perf report _ -a records on all CPUs _ -g records call graphs _ Install debug symbols # perf record -a -g sleep 5 [ perf record: Woken up 4 times to write data ] [ perf record: Captured and wrote 2.157 MB perf.data (~94254 samples) ] -a nice way to record what's currently running on all CPUs -g enables call-graph
  • 54.
    54 perf report _ Displaysprofile of a record _ Can be sorted and or filtered _ Shows all samples
  • 55.
    55 # perf report-i perf.data.dd --stdio --showcpuutilization --sort comm,dso [...] # Overhead sys usr Command Shared Object # ........ ........ ........ ....... ................. 95.00% 95.00% 0.00% dd [kernel.kallsyms] | |--33.22%-- _aesni_enc1 | __ablk_encrypt | ablk_encrypt | crypt_scatterlist | crypt_extent | ecryptfs_encrypt_page | ecryptfs_write_end | generic_file_buffered_write | __generic_file_aio_write | generic_file_aio_write | do_sync_write | vfs_write | sys_write | system_call_fastpath | __GI___libc_write | 0x415f65643d524550 |--9.11%-- _cond_resched | | | |--57.94%-- ext4_dirty_inode | | __mark_inode_dirty | | generic_write_end | | ext4_da_write_end | | generic_file_buffered_write Command and shared object Traced method dd writes data
  • 56.
    56 perf-tools _ By BrendanGregg _ https://github.com/brendangregg/perf-tools _ Mostly quick hacks, read Warnings! _ Using perf_events and ftrace _ Good examples what can be done with perf and ftrace _ iosnoop Shows I/O access for commands, including latency _ cachestat Linux page cache hit/miss statistics _ functrace Count kernel functions matching wildcards Nice, this are simple bash scripts!
  • 57.
  • 58.
  • 59.
  • 60.
    60 Flamegraph _ Visualization howresources are distributed among code Powered by @agentzh, http://agentzh.org/misc/slides/yapc-na-2013-flame-graphs.pdf
  • 61.
    61 Let's start the livedemo #4 Flamegraph
  • 62.
    62 Flamegraph # perf record-g dd if=/dev/zero of=test.data count=1 bs=1M # mv perf.data perf.data.dd # perf script -i perf.data.dd | ./FlameGraph/stackcollapse-perf.pl > out.dd.folded # ./FlameGraph/flamegraph.pl out.dd.folded > out.perf.dd.svg
  • 63.
  • 64.
    Thanks for yourattention! _ wfischer AT thomas-krenn.com _ @wefinet