Downloaded 113 times
![BPF Internals (Brendan Gregg)
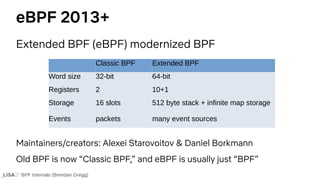
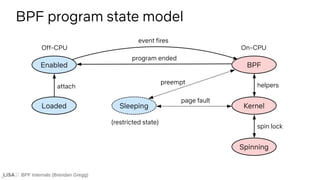
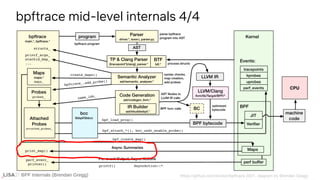
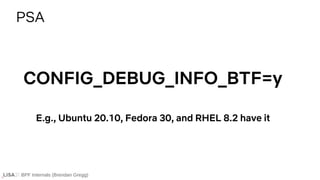
BPF 1992: Berkeley Packet Filter
A runtime for efficient
packet filters
Also a narrow and arcane
kernel technology that few
knew existed
# tcpdump -d host 127.0.0.1 and port 80
(000) ldh [12]
(001) jeq #0x800 jt 2 jf 18
(002) ld [26]
(003) jeq #0x7f000001 jt 6 jf 4
(004) ld [30]
(005) jeq #0x7f000001 jt 6 jf 18
(006) ldb [23]
(007) jeq #0x84 jt 10 jf 8
(008) jeq #0x6 jt 10 jf 9
(009) jeq #0x11 jt 10 jf 18
(010) ldh [20]
(011) jset #0x1fff jt 18 jf 12
(012) ldxb 4*([14]&0xf)
(013) ldh [x + 14]
(014) jeq #0x50 jt 17 jf 15
(015) ldh [x + 16]
(016) jeq #0x50 jt 17 jf 18
(017) ret #262144
(018) ret #0](https://image.slidesharecdn.com/lisa2021bpfinternals-210615021243/85/BPF-Internals-eBPF-5-320.jpg)
![BPF Internals (Brendan Gregg)
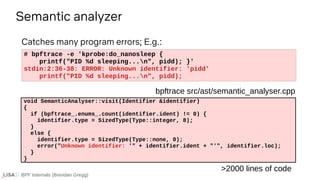
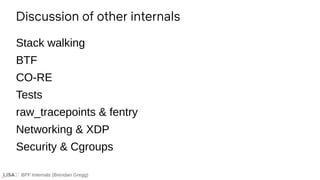
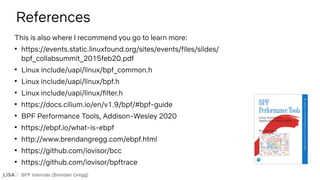
# bpftrace -e 'kprobe:do_nanosleep {
printf("PID %d sleeping...n", pid);
}'
Attaching 1 probe...
PID 10287 sleeping...
PID 10297 sleeping...
PID 10287 sleeping…
PID 10297 sleeping...
PID 10287 sleeping...
PID 2218 sleeping...
PID 10297 sleeping...
[...]
Example output](https://image.slidesharecdn.com/lisa2021bpfinternals-210615021243/85/BPF-Internals-eBPF-18-320.jpg)
![BPF Internals (Brendan Gregg)
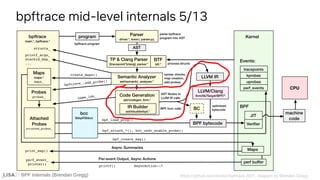
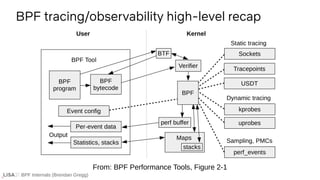
ident [_a-zA-Z][_a-zA-Z0-9]*
map @{ident}|@
var ${ident}
int [0-9]+|0[xX][0-9a-fA-F]+
cint :{int}:
hex (x|X)[0-9a-fA-F]{1,2}
[...]
builtin arg[0-9]|args|cgroup|comm|cpid|cpu|ctx|curtask|elapsed|func|
gid|nsecs|pid|probe|rand|retval|sarg[0-9]|tid|uid|username
call avg|cat|cgroupid|clear|count|delete|exit|hist|join|kaddr|ksym|
lhist|max|min|ntop|override_return|print|printf|reg|signal|stats|str|
strncmp|sum|sym|system|time|uaddr|usym|zero
pid
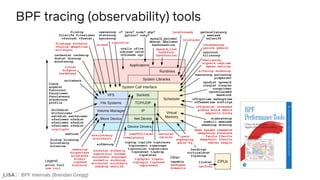
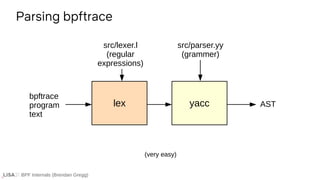
Lexer
bpftrace src/lexer.l
Regular expressions](https://image.slidesharecdn.com/lisa2021bpfinternals-210615021243/85/BPF-Internals-eBPF-27-320.jpg)
![BPF Internals (Brendan Gregg)
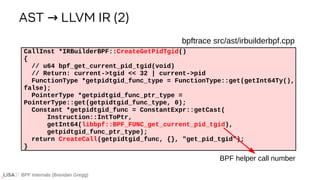
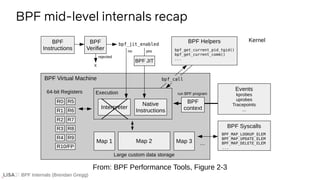
builtin(pid)
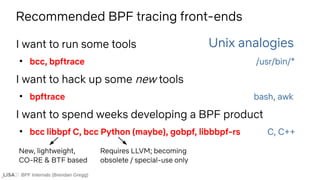
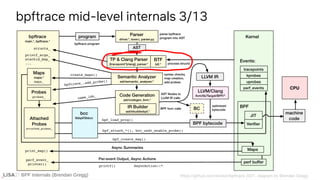
Yacc
%token <std::string> BUILTIN "builtin"
%token <std::string> CALL "call"
[...]
expr : int { $$ = $1; }
| STRING { $$ = new ast::String($1, @$); }
| BUILTIN { $$ = new ast::Builtin($1, @$); }
| CALL_BUILTIN { $$ = new ast::Builtin($1, @$); }
| IDENT { $$ = new ast::Identifier($1, @$); }
| STACK_MODE { $$ = new ast::StackMode($1, @$); }
| ternary { $$ = $1; }
| param { $$ = $1; }
| map_or_var { $$ = $1; }
| call { $$ = $1; }
[...]
call : CALL "(" ")" { $$ = new ast::Call($1, @$); }
| CALL "(" vargs ")" { $$ = new ast::Call($1, $3, @$); }
bpftrace src/parser.yy
Grammar rules](https://image.slidesharecdn.com/lisa2021bpfinternals-210615021243/85/BPF-Internals-eBPF-28-320.jpg)
![BPF Internals (Brendan Gregg)
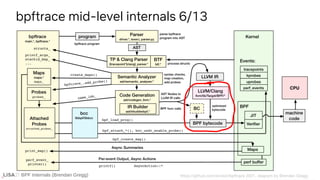
ident [_a-zA-Z][_a-zA-Z0-9]*
map @{ident}|@
var ${ident}
int [0-9]+|0[xX][0-9a-fA-F]+
cint :{int}:
hex (x|X)[0-9a-fA-F]{1,2}
[...]
builtin arg[0-9]|args|cgroup|comm|cpid|cpu|ctx|curtask|elapsed|func|
gid|nsecs|pid|probe|rand|retval|sarg[0-9]|tid|uid|username
call avg|cat|cgroupid|clear|count|delete|exit|hist|join|kaddr|ksym|
lhist|max|min|ntop|override_return|print|printf|reg|signal|stats|str|
strncmp|sum|sym|system|time|uaddr|usym|zero
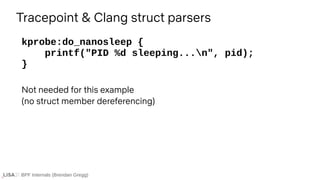
printf("PID %d sleeping...n", pid);
Lexer (2)
bpftrace src/lexer.l](https://image.slidesharecdn.com/lisa2021bpfinternals-210615021243/85/BPF-Internals-eBPF-29-320.jpg)
![BPF Internals (Brendan Gregg)
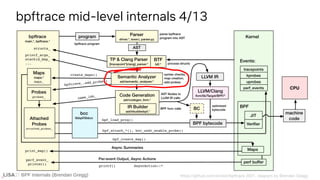
call(printf(...));
Yacc (2)
%token <std::string> BUILTIN "builtin"
%token <std::string> CALL "call"
[...]
expr : int { $$ = $1; }
| STRING { $$ = new ast::String($1, @$); }
| BUILTIN { $$ = new ast::Builtin($1, @$); }
| CALL_BUILTIN { $$ = new ast::Builtin($1, @$); }
| IDENT { $$ = new ast::Identifier($1, @$); }
| STACK_MODE { $$ = new ast::StackMode($1, @$); }
| ternary { $$ = $1; }
| param { $$ = $1; }
| map_or_var { $$ = $1; }
| call { $$ = $1; }
[...]
call : CALL "(" ")" { $$ = new ast::Call($1, @$); }
| CALL "(" vargs ")" { $$ = new ast::Call($1, $3, @$); }
bpftrace src/parser.yy](https://image.slidesharecdn.com/lisa2021bpfinternals-210615021243/85/BPF-Internals-eBPF-30-320.jpg)
![BPF Internals (Brendan Gregg)
" { yy_push_state(STR, yyscanner); buffer.clear(); }
<STR>{
" { yy_pop_state(yyscanner); return Parser::make_STRING(buffer, loc); }
[^n"]+ buffer += yytext;
n buffer += 'n';
t buffer += 't';
r buffer += 'r';
" buffer += '"';
buffer += '';
{oct} {
long value = strtol(yytext+1, NULL, 8);
if (value > UCHAR_MAX)
driver.error(loc, std::string("octal escape sequence out of range '") +
yytext + "'");
buffer += value;
}
{hex} buffer += strtol(yytext+2, NULL, 16);
n driver.error(loc, "unterminated string"); yy_pop_state(yyscanner);
loc.lines(1); loc.step();
<<EOF>> driver.error(loc, "unterminated string"); yy_pop_state(yyscanner);
. { driver.error(loc, std::string("invalid escape character '") +
yytext + "'"); }
. driver.error(loc, "invalid character"); yy_pop_state(yyscanner);
}
"PID %d sleeping...n"
Lexer (3)
bpftrace src/lexer.l](https://image.slidesharecdn.com/lisa2021bpfinternals-210615021243/85/BPF-Internals-eBPF-31-320.jpg)
![BPF Internals (Brendan Gregg)
string("PID %d sleeping...n")
Yacc (3)
%token <std::string> STRING "string"
[...]
expr : int { $$ = $1; }
| STRING { $$ = new ast::String($1, @$); }
| BUILTIN { $$ = new ast::Builtin($1, @$); }
| CALL_BUILTIN { $$ = new ast::Builtin($1, @$); }
| IDENT { $$ = new ast::Identifier($1, @$); }
| STACK_MODE { $$ = new ast::StackMode($1, @$); }
| ternary { $$ = $1; }
| param { $$ = $1; }
| map_or_var { $$ = $1; }
| call { $$ = $1; }
[...]
bpftrace src/parser.yy](https://image.slidesharecdn.com/lisa2021bpfinternals-210615021243/85/BPF-Internals-eBPF-32-320.jpg)
![BPF Internals (Brendan Gregg)
ident [_a-zA-Z][_a-zA-Z0-9]*
map @{ident}|@
[...]
kprobe:do_nanosleep
Lexer & Yacc (4)
bpftrace src/lexer.l
attach_point : ident { $$ = new ast::AttachPoint($1, @$); }
| ident ":" wildcard { $$ = new ast::AttachPoint($1, $3, @$); }
| ident ":" wildcard PLUS INT { $$ = new ast::AttachPoint($1, $3, $5, @$); }
| ident PATH STRING { $$ = new ast::AttachPoint($1, $2.substr(1, $2.si...
[...]
wildcard : wildcard ident { $$ = $1 + $2; }
| wildcard MUL { $$ = $1 + "*"; }
| wildcard LBRACKET { $$ = $1 + "["; }
| wildcard RBRACKET { $$ = $1 + "]"; }
| wildcard DOT { $$ = $1 + "."; }
| { $$ = ""; }
;
bpftrace src/parser.yy](https://image.slidesharecdn.com/lisa2021bpfinternals-210615021243/85/BPF-Internals-eBPF-33-320.jpg)
![BPF Internals (Brendan Gregg)
ident [_a-zA-Z][_a-zA-Z0-9]*
map @{ident}|@
[...]
kprobe:do_nanosleep
Lexer & Yacc (4)
attach_point : ident { $$ = new ast::AttachPoint($1, @$); }
| ident ":" wildcard { $$ = new ast::AttachPoint($1, $3, @$); }
| ident ":" wildcard PLUS INT { $$ = new ast::AttachPoint($1, $3, $5, @$); }
| ident PATH STRING { $$ = new ast::AttachPoint($1, $2.substr(1, $2.si...
[...]
wildcard : wildcard ident { $$ = $1 + $2; }
| wildcard MUL { $$ = $1 + "*"; }
| wildcard LBRACKET { $$ = $1 + "["; }
| wildcard RBRACKET { $$ = $1 + "]"; }
| wildcard DOT { $$ = $1 + "."; }
| { $$ = ""; }
;
1. 2.
3.
4.
5.
6.
bpftrace src/lexer.l
bpftrace src/parser.yy](https://image.slidesharecdn.com/lisa2021bpfinternals-210615021243/85/BPF-Internals-eBPF-34-320.jpg)
![BPF Internals (Brendan Gregg)
{ statements; ... }
Yacc (5)
probe : attach_points pred block { $$ = new ast::Probe($1, $2, $3); }
attach_points : attach_points "," attach_point { $$ = $1; $1->push_back($3); }
| attach_point { $$ = new ast::AttachPointList; $$->push_back($1); }
[...]
block : "{" stmts "}" { $$ = $2; }
;
semicolon_ended_stmt: stmt ";" { $$ = $1; }
;
stmts : semicolon_ended_stmt stmts { $$ = $2; $2->insert($2->begin(), $1); }
| block_stmt stmts { $$ = $2; $2->insert($2->begin(), $1); }
| stmt { $$ = new ast::StatementList; $$->push_back($1); }
| { $$ = new ast::StatementList; }
;
bpftrace src/parser.yy
Plus more grammar for program structure...](https://image.slidesharecdn.com/lisa2021bpfinternals-210615021243/85/BPF-Internals-eBPF-35-320.jpg)
![BPF Internals (Brendan Gregg)
# bpftrace -d -e 'kprobe:do_nanosleep {
printf("PID %d sleeping...n", pid);
}'
AST
-------------------
Program
kprobe:do_nanosleep
call: printf
string: PID %d sleeping...n
builtin: pid
[...]
Now you have AST nodes!](https://image.slidesharecdn.com/lisa2021bpfinternals-210615021243/85/BPF-Internals-eBPF-36-320.jpg)
![BPF Internals (Brendan Gregg)
AST LLVM IR
→
void CodegenLLVM::visit(Builtin &builtin)
{
[…]
else if (builtin.ident == "pid" || builtin.ident == "tid")
{
Value *pidtgid = b_.CreateGetPidTgid();
if (builtin.ident == "pid")
{
expr_ = b_.CreateLShr(pidtgid, 32);
[…]
bpftrace src/ast/codegen_llvm.cpp
BPF logical shift right instruction](https://image.slidesharecdn.com/lisa2021bpfinternals-210615021243/85/BPF-Internals-eBPF-42-320.jpg)
![BPF Internals (Brendan Gregg)
#define __BPF_FUNC_MAPPER(FN)
FN(unspec),
FN(map_lookup_elem),
FN(map_update_elem),
FN(map_delete_elem),
FN(probe_read),
FN(ktime_get_ns),
FN(trace_printk),
FN(get_prandom_u32),
FN(get_smp_processor_id),
FN(skb_store_bytes),
FN(l3_csum_replace),
FN(l4_csum_replace),
FN(tail_call),
FN(clone_redirect),
FN(get_current_pid_tgid),
FN(get_current_uid_gid),
[...]
Linux include/uapi/linux/bpf.h
BPF helper calls
#14](https://image.slidesharecdn.com/lisa2021bpfinternals-210615021243/85/BPF-Internals-eBPF-44-320.jpg)
![BPF Internals (Brendan Gregg)
# bpftrace -d -e 'kprobe:do_nanosleep {
printf("PID %d sleeping...n", pid); }'
[…]
define i64 @"kprobe:do_nanosleep"(i8*) local_unnamed_addr section
"s_kprobe:do_nanosleep_1" {
entry:
%printf_args = alloca %printf_t, align 8
%1 = bitcast %printf_t* %printf_args to i8*
call void @llvm.lifetime.start.p0i8(i64 -1, i8* nonnull %1)
%2 = getelementptr inbounds %printf_t, %printf_t* %printf_args, i64 0, i32 0
store i64 0, i64* %2, align 8
%get_pid_tgid = tail call i64 inttoptr (i64 14 to i64 ()*)()
%3 = lshr i64 %get_pid_tgid, 32
%4 = getelementptr inbounds %printf_t, %printf_t* %printf_args, i64 0, i32 1
store i64 %3, i64* %4, align 8
%pseudo = tail call i64 @llvm.bpf.pseudo(i64 1, i64 1)
%get_cpu_id = tail call i64 inttoptr (i64 8 to i64 ()*)()
%perf_event_output = call i64 inttoptr (i64 25 to i64 (i8*, i64, i64, %printf_t*,
i64)*)(i8* %0, i64 %pseudo, i64 %get_cpu_id, %printf_t* nonnull %printf_args, i64 16)
call void @llvm.lifetime.end.p0i8(i64 -1, i8* nonnull %1)
ret i64 0
}
Now you have LLVM IR!](https://image.slidesharecdn.com/lisa2021bpfinternals-210615021243/85/BPF-Internals-eBPF-45-320.jpg)
![BPF Internals (Brendan Gregg)
# bpftrace -d -e 'kprobe:do_nanosleep {
printf("PID %d sleeping...n", pid); }'
[…]
define i64 @"kprobe:do_nanosleep"(i8*) local_unnamed_addr section
"s_kprobe:do_nanosleep_1" {
entry:
%printf_args = alloca %printf_t, align 8
%1 = bitcast %printf_t* %printf_args to i8*
call void @llvm.lifetime.start.p0i8(i64 -1, i8* nonnull %1)
%2 = getelementptr inbounds %printf_t, %printf_t* %printf_args, i64 0, i32 0
store i64 0, i64* %2, align 8
%get_pid_tgid = tail call i64 inttoptr (i64 14 to i64 ()*)()
%3 = lshr i64 %get_pid_tgid, 32
%4 = getelementptr inbounds %printf_t, %printf_t* %printf_args, i64 0, i32 1
store i64 %3, i64* %4, align 8
%pseudo = tail call i64 @llvm.bpf.pseudo(i64 1, i64 1)
%get_cpu_id = tail call i64 inttoptr (i64 8 to i64 ()*)()
%perf_event_output = call i64 inttoptr (i64 25 to i64 (i8*, i64, i64, %printf_t*,
i64)*)(i8* %0, i64 %pseudo, i64 %get_cpu_id, %printf_t* nonnull %printf_args, i64 16)
call void @llvm.lifetime.end.p0i8(i64 -1, i8* nonnull %1)
ret i64 0
}
Now you have LLVM IR! (2)](https://image.slidesharecdn.com/lisa2021bpfinternals-210615021243/85/BPF-Internals-eBPF-46-320.jpg)
![BPF Internals (Brendan Gregg)
# bpftrace -d -e 'kprobe:do_nanosleep {
printf("PID %d sleeping...n", pid); }'
[…]
define i64 @"kprobe:do_nanosleep"(i8*) local_unnamed_addr section
"s_kprobe:do_nanosleep_1" {
entry:
%printf_args = alloca %printf_t, align 8
%1 = bitcast %printf_t* %printf_args to i8*
call void @llvm.lifetime.start.p0i8(i64 -1, i8* nonnull %1)
%2 = getelementptr inbounds %printf_t, %printf_t* %printf_args, i64 0, i32 0
store i64 0, i64* %2, align 8
[...]
Now you have LLVM IR! (3)
This is all generated from LLVM IR calls in bpftrace src/ast/*
Lots of CreateAllocaBPF(), CreateGEP(), etc. (this gets verbose)](https://image.slidesharecdn.com/lisa2021bpfinternals-210615021243/85/BPF-Internals-eBPF-47-320.jpg)
![BPF Internals (Brendan Gregg)
LLVM llvm/lib/Target/BPF/BPFInstrInfo.td
class CALL<string OpcodeStr>
: TYPE_ALU_JMP<BPF_CALL.Value, BPF_K.Value,
(outs),
(ins calltarget:$BrDst),
!strconcat(OpcodeStr, " $BrDst"),
[]> {
bits<32> BrDst;
let Inst{31-0} = BrDst;
let BPFClass = BPF_JMP;
}
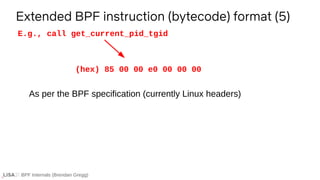
Plus more llvm boilerplate & BPF headers shown earlier
E.g., tail call i64 inttoptr (i64 14 to i64 ()*)()
14
85 00 00 e0 00 00 00
LLVM IR BPF
→](https://image.slidesharecdn.com/lisa2021bpfinternals-210615021243/85/BPF-Internals-eBPF-56-320.jpg)
![BPF Internals (Brendan Gregg)
# strace -fe bpf bpftrace -e 'kprobe:do_nanosleep {
printf("PID %d sleeping...n", pid);
}'
[...]
bpf(BPF_PROG_LOAD, {prog_type=BPF_PROG_TYPE_KPROBE, insn_cnt=18, insns=0x7fdde5305000,
license="GPL", log_level=0, log_size=0, log_buf=NULL, kern_version=KERNEL_VERSION(5, 8,
18), prog_flags=0, prog_name="do_nanosleep", prog_ifindex=0,
expected_attach_type=BPF_CGROUP_INET_INGRESS, prog_btf_fd=0, func_info_rec_size=0,
func_info=NULL, func_info_cnt=0, line_info_rec_size=0, line_info=NULL, line_info_cnt=0,
attach_btf_id=0, attach_prog_fd=0}, 120) = 14
Sending BPF bytecode to the kernel
Success! Passed the verifier...](https://image.slidesharecdn.com/lisa2021bpfinternals-210615021243/85/BPF-Internals-eBPF-60-320.jpg)
![BPF Internals (Brendan Gregg)
85 00 00 00 12 34 56 78
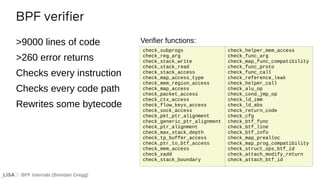
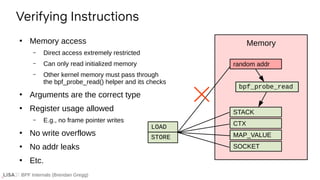
Verifying BPF instructions
If ...
static int do_check(struct bpf_verifier_env *env)
[...]
} else if (class == BPF_JMP || class == BPF_JMP32) {
u8 opcode = BPF_OP(insn->code);
env->jmps_processed++;
if (opcode == BPF_CALL) {
[...]
err = check_helper_call(env, insn->imm, env->insn_idx);
[...]
static int check_helper_call(struct bpf_verifier_env *env, int func_id, int insn_idx)
{
const struct bpf_func_proto *fn = NULL;
struct bpf_reg_state *regs;
struct bpf_call_arg_meta meta;
bool changes_data;
int i, err;
/* find function prototype */
if (func_id < 0 || func_id >= __BPF_FUNC_MAX_ID) {
verbose(env, "invalid func %s#%dn", func_id_name(func_id),
func_id);
return -EINVAL;
Linux kernel/bpf/verifier.c
>9000 lines of code
Imagine we call a bogus function...](https://image.slidesharecdn.com/lisa2021bpfinternals-210615021243/85/BPF-Internals-eBPF-63-320.jpg)

![BPF Internals (Brendan Gregg)
# bpftool prog show
[…]
70: kprobe name do_nanosleep tag 8dc93a3b6a21ef3b gpl
loaded_at 2021-05-02T00:44:26+0000 uid 0
xlated 144B jited 96B memlock 4096B map_ids 24
# bpftool prog dump xlated id 70 opcodes
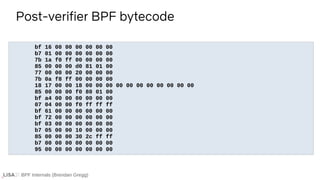
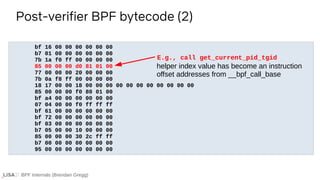
0: (bf) r6 = r1
bf 16 00 00 00 00 00 00
1: (b7) r1 = 0
b7 01 00 00 00 00 00 00
2: (7b) *(u64 *)(r10 -16) = r1
7b 1a f0 ff 00 00 00 00
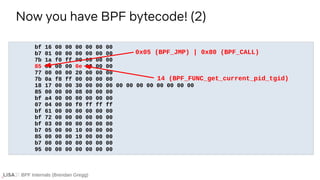
3: (85) call bpf_get_current_pid_tgid#98768
85 00 00 00 d0 81 01 00
4: (77) r0 >>= 32
77 00 00 00 20 00 00 00
5: (7b) *(u64 *)(r10 -8) = r0
7b 0a f8 ff 00 00 00 00
6: (18) r7 = map[id:24]
18 17 00 00 18 00 00 00 00 00 00 00 00 00 00 00
[...]
BPF bytecode with human words
Using bpftool
on a running
instance of the
program](https://image.slidesharecdn.com/lisa2021bpfinternals-210615021243/85/BPF-Internals-eBPF-71-320.jpg)
![BPF Internals (Brendan Gregg)
# bpftool prog show
[…]
70: kprobe name do_nanosleep tag 8dc93a3b6a21ef3b gpl
loaded_at 2021-05-02T00:44:26+0000 uid 0
xlated 144B jited 96B memlock 4096B map_ids 24
# bpftool prog dump xlated id 70 opcodes
0: (bf) r6 = r1
bf 16 00 00 00 00 00 00
1: (b7) r1 = 0
b7 01 00 00 00 00 00 00
2: (7b) *(u64 *)(r10 -16) = r1
7b 1a f0 ff 00 00 00 00
3: (85) call bpf_get_current_pid_tgid#98768
85 00 00 00 d0 81 01 00
4: (77) r0 >>= 32
77 00 00 00 20 00 00 00
5: (7b) *(u64 *)(r10 -8) = r0
7b 0a f8 ff 00 00 00 00
6: (18) r7 = map[id:24]
18 17 00 00 18 00 00 00 00 00 00 00 00 00 00 00
[...]
BPF bytecode with human words (2)
Using bpftool
on a running
instance of the
program](https://image.slidesharecdn.com/lisa2021bpfinternals-210615021243/85/BPF-Internals-eBPF-72-320.jpg)
![BPF Internals (Brendan Gregg)
# bpftool prog dump xlated id 70
0: (bf) r6 = r1
1: (b7) r1 = 0
2: (7b) *(u64 *)(r10 -16) = r1
3: (85) call bpf_get_current_pid_tgid#98768
4: (77) r0 >>= 32
5: (7b) *(u64 *)(r10 -8) = r0
6: (18) r7 = map[id:24]
8: (85) call bpf_get_smp_processor_id#98544
9: (bf) r4 = r10
10: (07) r4 += -16
11: (bf) r1 = r6
12: (bf) r2 = r7
13: (bf) r3 = r0
14: (b7) r5 = 16
15: (85) call bpf_perf_event_output#-54224
16: (b7) r0 = 0
17: (95) exit
BPF bytecode, opcodes only
just the opcode 8 bits](https://image.slidesharecdn.com/lisa2021bpfinternals-210615021243/85/BPF-Internals-eBPF-73-320.jpg)
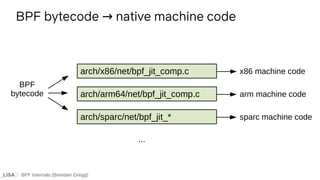
![BPF Internals (Brendan Gregg)
BPF bytecode x86 machine code
→
If ...
static int do_jit(struct bpf_prog *bpf_prog, int *addrs, u8 *image,
int oldproglen, struct jit_context *ctx)
{
[…]
for (i = 1; i <= insn_cnt; i++, insn++) {
[…]
switch (insn->code) {
[…]
case BPF_JMP | BPF_CALL:
func = (u8 *) __bpf_call_base + imm32;
if (!imm32 || emit_call(&prog, func, image + addrs[i - 1]))
return -EINVAL;
break;
[…]
static int emit_call(u8 **pprog, void *func, void *ip)
{
return emit_patch(pprog, func, ip, 0xE8);
}
Linux arch/x86/net/bpf_jit_comp.c](https://image.slidesharecdn.com/lisa2021bpfinternals-210615021243/85/BPF-Internals-eBPF-76-320.jpg)
![BPF Internals (Brendan Gregg)
BPF bytecode x86 machine code
→
If ...
static int do_jit(struct bpf_prog *bpf_prog, int *addrs, u8 *image,
int oldproglen, struct jit_context *ctx)
{
[…]
for (i = 1; i <= insn_cnt; i++, insn++) {
[…]
switch (insn->code) {
[…]
case BPF_JMP | BPF_CALL:
func = (u8 *) __bpf_call_base + imm32;
if (!imm32 || emit_call(&prog, func, image + addrs[i - 1]))
return -EINVAL;
break;
[…]
static int emit_call(u8 **pprog, void *func, void *ip)
{
return emit_patch(pprog, func, ip, 0xE8);
}
Linux arch/x86/net/bpf_jit_comp.c
E.g., call get_current_pid_tgid
0xe8 is x86 CALL](https://image.slidesharecdn.com/lisa2021bpfinternals-210615021243/85/BPF-Internals-eBPF-77-320.jpg)
![BPF Internals (Brendan Gregg)
# bpftool prog dump jited id 80 opcodes | grep -v :
55
48 89 e5
48 81 ec 10 00 00 00
53
41 55
41 56
41 57
6a 00
48 89 fb
31 ff
48 89 7d f0
e8 a0 8b 44 c2
48 c1 e8 20
48 89 45 f8
49 bd 00 b6 7b b8 3a 9d ff ff
e8 a9 8a 44 c2
48 89 e9
48 83 c1 f0
48 89 df
[...]
Now you have x86 machine code!
31 instructions](https://image.slidesharecdn.com/lisa2021bpfinternals-210615021243/85/BPF-Internals-eBPF-78-320.jpg)
![BPF Internals (Brendan Gregg)
# bpftool prog dump jited id 80 opcodes | grep -v :
55
48 89 e5
48 81 ec 10 00 00 00
53
41 55
41 56
41 57
6a 00
48 89 fb
31 ff
48 89 7d f0
e8 a0 8b 44 c2
48 c1 e8 20
48 89 45 f8
49 bd 00 b6 7b b8 3a 9d ff ff
e8 a9 8a 44 c2
48 89 e9
48 83 c1 f0
48 89 df
[...]
Now you have x86 machine code!
31 instructions
CALL get_current_pid_tgid](https://image.slidesharecdn.com/lisa2021bpfinternals-210615021243/85/BPF-Internals-eBPF-79-320.jpg)
![BPF Internals (Brendan Gregg)
# bpftool prog dump jited id 71 opcodes | grep -v :
fd 7b bf a9
fd 03 00 91
f3 53 bf a9
f5 5b bf a9
f9 6b bf a9
f9 03 00 91
1a 00 80 d2
ff 43 00 d1
13 00 00 91
00 00 80 d2
ea 01 80 92
20 6b 2a f8
ea 48 9e 92
0a 05 a2 f2
0a 00 d0 f2
40 01 3f d6
07 00 00 91
e7 fc 60 d3
ea 00 80 92
[...]
… or you have ARM machine code!
48 instructions](https://image.slidesharecdn.com/lisa2021bpfinternals-210615021243/85/BPF-Internals-eBPF-80-320.jpg)
![BPF Internals (Brendan Gregg)
# bpftool prog dump jited id 80
0xffffffffc0192b2e:
0: push %rbp
1: mov %rsp,%rbp
4: sub $0x10,%rsp
b: push %rbx
c: push %r13
e: push %r14
10: push %r15
12: pushq $0x0
14: mov %rdi,%rbx
17: xor %edi,%edi
19: mov %rdi,-0x10(%rbp)
1d: callq 0xffffffffc2448bc2
22: shr $0x20,%rax
26: mov %rax,-0x8(%rbp)
2a: movabs $0xffff9d3ab87bb600,%r13
34: callq 0xffffffffc2448ae2
39: mov %rbp,%rcx
3c: add $0xfffffffffffffff0,%rcx
[...]
x86 instruction disassembly](https://image.slidesharecdn.com/lisa2021bpfinternals-210615021243/85/BPF-Internals-eBPF-81-320.jpg)
![BPF Internals (Brendan Gregg)
# bpftool prog dump jited id 80
0xffffffffc0192b2e:
0: push %rbp
1: mov %rsp,%rbp
4: sub $0x10,%rsp
b: push %rbx
c: push %r13
e: push %r14
10: push %r15
12: pushq $0x0
14: mov %rdi,%rbx
17: xor %edi,%edi
19: mov %rdi,-0x10(%rbp)
1d: callq 0xffffffffc2448bc2
22: shr $0x20,%rax
26: mov %rax,-0x8(%rbp)
2a: movabs $0xffff9d3ab87bb600,%r13
34: callq 0xffffffffc2448ae2
39: mov %rbp,%rcx
3c: add $0xfffffffffffffff0,%rcx
[...]
x86 instruction disassembly (2)
BPF prologue
BPF program
get_current_pid_tgid](https://image.slidesharecdn.com/lisa2021bpfinternals-210615021243/85/BPF-Internals-eBPF-82-320.jpg)
![BPF Internals (Brendan Gregg)
Plus you have BPF helper code
BPF_CALL_0(bpf_get_current_pid_tgid)
{
struct task_struct *task = current;
if (unlikely(!task))
return -EINVAL;
return (u64) task->tgid << 32 | task->pid;
}
[...]
Linux kernel/bpf/helpers.c](https://image.slidesharecdn.com/lisa2021bpfinternals-210615021243/85/BPF-Internals-eBPF-83-320.jpg)
![BPF Internals (Brendan Gregg)
# strace -fe perf_event_open,bpf,ioctl bpftrace -e 'kprobe:do_nanosleep {
printf("PID %d sleeping...n", pid); }'
[...]
bpf(BPF_PROG_LOAD, {prog_type=BPF_PROG_TYPE_KPROBE, insn_cnt=18, insns=0x7f6e826cf000,
license="GPL", log_level=0, log_size=0, log_buf=NULL, kern_version=KERNEL_VERSION(5, 8,
18), prog_flags=0, prog_name="do_nanosleep", prog_ifindex=0,
expected_attach_type=BPF_CGROUP_INET_INGRESS, prog_btf_fd=0, func_info_rec_size=0,
func_info=NULL, func_info_cnt=0, line_info_rec_size=0, line_info=NULL, line_info_cnt=0,
attach_btf_id=0, attach_prog_fd=0}, 120) = 14
perf_event_open({type=0x6 /* PERF_TYPE_??? */, size=PERF_ATTR_SIZE_VER5, config=0, ...},
-1, 0, -1, PERF_FLAG_FD_CLOEXEC) = 13
ioctl(13, PERF_EVENT_IOC_SET_BPF, 14) = 0
ioctl(13, PERF_EVENT_IOC_ENABLE, 0) = 0
Attaching BPF to a kprobe](https://image.slidesharecdn.com/lisa2021bpfinternals-210615021243/85/BPF-Internals-eBPF-85-320.jpg)
![BPF Internals (Brendan Gregg)
# strace -fe perf_event_open,bpf,ioctl bpftrace -e 'kprobe:do_nanosleep {
printf("PID %d sleeping...n", pid); }'
[...]
bpf(BPF_PROG_LOAD, {prog_type=BPF_PROG_TYPE_KPROBE, insn_cnt=18, insns=0x7f6e826cf000,
license="GPL", log_level=0, log_size=0, log_buf=NULL, kern_version=KERNEL_VERSION(5, 8,
18), prog_flags=0, prog_name="do_nanosleep", prog_ifindex=0,
expected_attach_type=BPF_CGROUP_INET_INGRESS, prog_btf_fd=0, func_info_rec_size=0,
func_info=NULL, func_info_cnt=0, line_info_rec_size=0, line_info=NULL, line_info_cnt=0,
attach_btf_id=0, attach_prog_fd=0}, 120) = 14
perf_event_open({type=0x6 /* PERF_TYPE_??? */, size=PERF_ATTR_SIZE_VER5, config=0, ...},
-1, 0, -1, PERF_FLAG_FD_CLOEXEC) = 13
ioctl(13, PERF_EVENT_IOC_SET_BPF, 14) = 0
ioctl(13, PERF_EVENT_IOC_ENABLE, 0) = 0
Attaching BPF to a kprobe (2)
BPF program
(#14)
kprobe
(#13)
ioctl()
creates the kprobe
strace is lacking some translation
bpf() perf_event_open()](https://image.slidesharecdn.com/lisa2021bpfinternals-210615021243/85/BPF-Internals-eBPF-86-320.jpg)
![BPF Internals (Brendan Gregg)
kprobes
If ...
static int __sched do_nanosleep(struct hrtimer_sleeper *t, enum hrtimer_mode mode)
{
struct restart_block *restart;
do {
set_current_state(TASK_INTERRUPTIBLE);
hrtimer_sleeper_start_expires(t, mode);
if (likely(t->task))
[...]
Linux kernel/time/hrtimer.c
How do we instrument this?
(it’s actually quite easy)](https://image.slidesharecdn.com/lisa2021bpfinternals-210615021243/85/BPF-Internals-eBPF-88-320.jpg)
![BPF Internals (Brendan Gregg)
(gdb) disas/r do_nanosleep
Dump of assembler code for function do_nanosleep:
0xffffffff81b7d810 <+0>: e8 1b 00 4f ff callq 0xffffffff8106d830 <__fentry__>
0xffffffff81b7d815 <+5>: 55 push %rbp
0xffffffff81b7d816 <+6>: 89 f1 mov %esi,%ecx
0xffffffff81b7d818 <+8>: 48 89 e5 mov %rsp,%rbp
0xffffffff81b7d81b <+11>: 41 55 push %r13
0xffffffff81b7d81d <+13>: 41 54 push %r12
0xffffffff81b7d81f <+15>: 53 push %rbx
[...]
Instrumenting live kernel functions](https://image.slidesharecdn.com/lisa2021bpfinternals-210615021243/85/BPF-Internals-eBPF-89-320.jpg)
![BPF Internals (Brendan Gregg)
(gdb) disas/r do_nanosleep
Dump of assembler code for function do_nanosleep:
0xffffffff81b7d810 <+0>: e8 1b 00 4f ff callq 0xffffffff8106d830 <__fentry__>
0xffffffff81b7d815 <+5>: 55 push %rbp
0xffffffff81b7d816 <+6>: 89 f1 mov %esi,%ecx
0xffffffff81b7d818 <+8>: 48 89 e5 mov %rsp,%rbp
0xffffffff81b7d81b <+11>: 41 55 push %r13
0xffffffff81b7d81d <+13>: 41 54 push %r12
0xffffffff81b7d81f <+15>: 53 push %rbx
[...]
Instrumenting live kernel functions (2)
A) Ftrace is already there. Kprobes can add a handler.
B) Or a breakpoint written (e.g., int3).
C) Or a jmp is written.
this is usually
nop’d out
May need to stop_machine() to ensure other
cores don’t execute changing instruction text](https://image.slidesharecdn.com/lisa2021bpfinternals-210615021243/85/BPF-Internals-eBPF-90-320.jpg)
![BPF Internals (Brendan Gregg)
Perf output buffers
# strace -fe perf_event_open bpftrace -e 'kprobe:do_nanosleep {
printf("PID %d sleeping...n", pid); }'
strace: Process 3229968 attached
[pid 3229968] +++ exited with 0 +++
perf_event_open({type=PERF_TYPE_SOFTWARE, ..., config=PERF_COUNT_SW_BPF_OUTPUT, ...}, -1, 0, -1,
PERF_FLAG_FD_CLOEXEC) = 5
perf_event_open({type=PERF_TYPE_SOFTWARE, ..., config=PERF_COUNT_SW_BPF_OUTPUT, ...}, -1, 1, -1,
PERF_FLAG_FD_CLOEXEC) = 6
perf_event_open({type=PERF_TYPE_SOFTWARE, ..., config=PERF_COUNT_SW_BPF_OUTPUT, ...}, -1, 2, -1,
PERF_FLAG_FD_CLOEXEC) = 7
[...]](https://image.slidesharecdn.com/lisa2021bpfinternals-210615021243/85/BPF-Internals-eBPF-92-320.jpg)
![BPF Internals (Brendan Gregg)
Perf output buffers
# strace -fe perf_event_open bpftrace -e 'kprobe:do_nanosleep {
printf("PID %d sleeping...n", pid); }'
strace: Process 3229968 attached
[pid 3229968] +++ exited with 0 +++
perf_event_open({type=PERF_TYPE_SOFTWARE, ..., config=PERF_COUNT_SW_BPF_OUTPUT, ...}, -1, 0, -1,
PERF_FLAG_FD_CLOEXEC) = 5
perf_event_open({type=PERF_TYPE_SOFTWARE, ..., config=PERF_COUNT_SW_BPF_OUTPUT, ...}, -1, 1, -1,
PERF_FLAG_FD_CLOEXEC) = 6
perf_event_open({type=PERF_TYPE_SOFTWARE, ..., config=PERF_COUNT_SW_BPF_OUTPUT, ...}, -1, 2, -1,
PERF_FLAG_FD_CLOEXEC) = 7
[...]
CPU ID
output buffer 5 CPU 0
output buffer 6 CPU 1
output buffer 7 CPU 2
...
bpftrace
fd 5
fd 6
fd 7
bpftrace waits for events using epoll_wait(2)](https://image.slidesharecdn.com/lisa2021bpfinternals-210615021243/85/BPF-Internals-eBPF-93-320.jpg)
![BPF Internals (Brendan Gregg)
bpftrace printf & async actions
enum class AsyncAction
{
// clang-format off
printf = 0, // printf reserves 0-9999 for printf_ids
syscall = 10000, // system reserves 10000-19999 for printf_ids
cat = 20000, // cat reserves 20000-29999 for printf_ids
exit = 30000,
print,
clear,
[...]
bpftrace src/types.h
printf_id
64-bit
arguments
bpftrace perf output message format:
E.g., printf_id 0: "PID %d sleeping...n"
High numbers are used
for other async actions:](https://image.slidesharecdn.com/lisa2021bpfinternals-210615021243/85/BPF-Internals-eBPF-95-320.jpg)
![BPF Internals (Brendan Gregg)
bpftrace printf & async actions (2)
void perf_event_printer(void *cb_cookie, void *data, int size)
{
[…]
auto printf_id = *reinterpret_cast<uint64_t *>(arg_data);
[…]
// async actions
if (printf_id == asyncactionint(AsyncAction::exit))
{
bpftrace->request_finalize();
return;
}
[…]
// printf
auto fmt = std::get<0>(bpftrace->printf_args_[printf_id]);
auto args = std::get<1>(bpftrace->printf_args_[printf_id]);
auto arg_values = bpftrace->get_arg_values(args, arg_data);
bpftrace->out_->message(MessageType::printf, format(fmt, arg_values), false);
bpftrace src/bpftrace.cpp
message() just prints it out](https://image.slidesharecdn.com/lisa2021bpfinternals-210615021243/85/BPF-Internals-eBPF-96-320.jpg)
![BPF Internals (Brendan Gregg)
# bpftrace -e 'kprobe:do_nanosleep {
printf("PID %d sleeping...n", pid);
}'
Attaching 1 probe...
PID 10287 sleeping...
PID 10297 sleeping...
PID 10287 sleeping…
PID 10297 sleeping...
PID 10287 sleeping...
PID 2218 sleeping...
PID 10297 sleeping...
[...]
Final output](https://image.slidesharecdn.com/lisa2021bpfinternals-210615021243/85/BPF-Internals-eBPF-97-320.jpg)

![BPF Internals (Brendan Gregg)
2. Static tracing and map summaries
bpftrace -e 'tracepoint:block:block_rq_issue {
@[comm] = count();
}'](https://image.slidesharecdn.com/lisa2021bpfinternals-210615021243/85/BPF-Internals-eBPF-99-320.jpg)
![BPF Internals (Brendan Gregg)
# bpftrace -e 'tracepoint:block:block_rq_issue {
@[comm] = count();
}'
Attaching 1 probe…
^C
@[kworker/2:2H]: 131
@[chrome]: 135
@[kworker/7:1H]: 185
@[Xorg]: 245
@[tar]: 1204
@[dmcrypt_write/2]: 1993
Example output](https://image.slidesharecdn.com/lisa2021bpfinternals-210615021243/85/BPF-Internals-eBPF-100-320.jpg)
![BPF Internals (Brendan Gregg)
map @{ident}|@
[...]
Lexer & Yacc
bpftrace src/lexer.l
%token <std::string> MAP "map"
[...]
stmt : expr { $$ = new ast::ExprStatement($1, @1); }
| compound_assignment { $$ = $1; }
| jump_stmt { $$ = $1; }
| map "=" expr { $$ = new ast::AssignMapStatement($1, $3, false, @2); }
[...]
map : MAP { $$ = new ast::Map($1, @$); }
| MAP "[" vargs "]" { $$ = new ast::Map($1, $3, @$); }
bpftrace src/parser.yy](https://image.slidesharecdn.com/lisa2021bpfinternals-210615021243/85/BPF-Internals-eBPF-102-320.jpg)
![BPF Internals (Brendan Gregg)
BPF map operations
User-space BPF-space (kernel)
bpf(2) syscall
BPF_MAP_CREATE
BPF_MAP_LOOKUP_ELEM
BPF_MAP_UPDATE_ELEM
BPF_MAP_DELETE_ELEM
BPF_MAP_GET_NEXT_KEY
[...]
BPF helpers
bpf_map_lookup_elem()
bpf_map_update_elem()
bpf_map_delete_elem()
[...]](https://image.slidesharecdn.com/lisa2021bpfinternals-210615021243/85/BPF-Internals-eBPF-105-320.jpg)
![BPF Internals (Brendan Gregg)
Creating BPF maps
# strace -febpf bpftrace -e 'block:block_rq_issue {
@[comm] = count(); }'
bpf(BPF_MAP_CREATE, {map_type=BPF_MAP_TYPE_ARRAY, key_size=4, value_size=4, max_entries=1,
map_flags=0, inner_map_fd=0, map_name="", map_ifindex=0, btf_fd=0, btf_key_type_id=0,
btf_value_type_id=0}, 120) = 3
bpf(BPF_MAP_CREATE, {map_type=BPF_MAP_TYPE_PERCPU_HASH, key_size=16, value_size=8, max_entries=4096,
map_flags=0, inner_map_fd=0, map_name="@", map_ifindex=0, btf_fd=0, btf_key_type_id=0,
btf_value_type_id=0}, 120) = -1 EINVAL (Invalid argument)
bpf(BPF_MAP_CREATE, {map_type=BPF_MAP_TYPE_PERCPU_HASH, key_size=16, value_size=8, max_entries=4096,
map_flags=0, inner_map_fd=0, map_name="", map_ifindex=0, btf_fd=0, btf_key_type_id=0,
btf_value_type_id=0}, 120) = 3
bpf(BPF_MAP_CREATE, {map_type=BPF_MAP_TYPE_PERF_EVENT_ARRAY, key_size=4, value_size=4,
max_entries=8, map_flags=0, inner_map_fd=0, map_name="printf", map_ifindex=0, btf_fd=0,
btf_key_type_id=0, btf_value_type_id=0}, 120) = 4
[...]](https://image.slidesharecdn.com/lisa2021bpfinternals-210615021243/85/BPF-Internals-eBPF-106-320.jpg)
![BPF Internals (Brendan Gregg)
Creating BPF maps
# strace -febpf bpftrace -e 'block:block_rq_issue {
@[comm] = count(); }'
bpf(BPF_MAP_CREATE, {map_type=BPF_MAP_TYPE_ARRAY, key_size=4, value_size=4, max_entries=1,
map_flags=0, inner_map_fd=0, map_name="", map_ifindex=0, btf_fd=0, btf_key_type_id=0,
btf_value_type_id=0}, 120) = 3
bpf(BPF_MAP_CREATE, {map_type=BPF_MAP_TYPE_PERCPU_HASH, key_size=16, value_size=8, max_entries=4096,
map_flags=0, inner_map_fd=0, map_name="@", map_ifindex=0, btf_fd=0, btf_key_type_id=0,
btf_value_type_id=0}, 120) = -1 EINVAL (Invalid argument)
bpf(BPF_MAP_CREATE, {map_type=BPF_MAP_TYPE_PERCPU_HASH, key_size=16, value_size=8, max_entries=4096,
map_flags=0, inner_map_fd=0, map_name="", map_ifindex=0, btf_fd=0, btf_key_type_id=0,
btf_value_type_id=0}, 120) = 3
bpf(BPF_MAP_CREATE, {map_type=BPF_MAP_TYPE_PERF_EVENT_ARRAY, key_size=4, value_size=4,
max_entries=8, map_flags=0, inner_map_fd=0, map_name="printf", map_ifindex=0, btf_fd=0,
btf_key_type_id=0, btf_value_type_id=0}, 120) = 4
[...]](https://image.slidesharecdn.com/lisa2021bpfinternals-210615021243/85/BPF-Internals-eBPF-107-320.jpg)
![BPF Internals (Brendan Gregg)
Tracepoint defined
If ...
DECLARE_EVENT_CLASS(block_rq,
TP_PROTO(struct request_queue *q, struct request *rq),
TP_ARGS(q, rq),
TP_STRUCT__entry(
__field( dev_t, dev )
__field( sector_t, sector )
__field( unsigned int, nr_sector )
__field( unsigned int, bytes )
__array( char, rwbs, RWBS_LEN )
__array( char, comm, TASK_COMM_LEN )
__dynamic_array( char, cmd, 1 )
),
TP_fast_assign(
__entry->dev = rq->rq_disk ? disk_devt(rq->rq_disk) : 0;
__entry->sector = blk_rq_trace_sector(rq);
[...]
DEFINE_EVENT(block_rq, block_rq_issue,
TP_PROTO(struct request_queue *q, struct request *rq),
TP_ARGS(q, rq)
);
Linux include/trace/events/block.h](https://image.slidesharecdn.com/lisa2021bpfinternals-210615021243/85/BPF-Internals-eBPF-109-320.jpg)
![BPF Internals (Brendan Gregg)
Tracepoints in code
If ...
void blk_mq_start_request(struct request *rq)
{
struct request_queue *q = rq->q;
trace_block_rq_issue(q, rq);
if (test_bit(QUEUE_FLAG_STATS, &q->queue_flags)) {
rq->io_start_time_ns = ktime_get_ns();
rq->stats_sectors = blk_rq_sectors(rq);
[...]
Linux block/block-mq.c
This is a (best effort) stable interface
Use tracepoints instead of kprobes when possible!](https://image.slidesharecdn.com/lisa2021bpfinternals-210615021243/85/BPF-Internals-eBPF-110-320.jpg)
![BPF Internals (Brendan Gregg)
(gdb) disas/r blk_mq_start_request
Dump of assembler code for function blk_mq_start_request:
0xffffffff815118e0 <+0>: e8 4b bf b5 ff callq 0xffffffff8106d830 <__fentry__>
0xffffffff815118e5 <+5>: 55 push %rbp
0xffffffff815118e6 <+6>: 48 89 e5 mov %rsp,%rbp
0xffffffff815118e9 <+9>: 41 55 push %r13
0xffffffff815118eb <+11>: 41 54 push %r12
0xffffffff815118ed <+13>: 49 89 fc mov %rdi,%r12
0xffffffff815118f0 <+16>: 53 push %rbx
0xffffffff815118f1 <+17>: 4c 8b 2f mov (%rdi),%r13
0xffffffff815118f4 <+20>: 0f 1f 44 00 00 nopl 0x0(%rax,%rax,1)
0xffffffff815118f9 <+25>: 49 8b 45 60 mov 0x60(%r13),%rax
[...]
Instrumenting tracepoints (2)
How do we include the tracepoint without adding overhead?
(this is actually quite easy)](https://image.slidesharecdn.com/lisa2021bpfinternals-210615021243/85/BPF-Internals-eBPF-111-320.jpg)
![BPF Internals (Brendan Gregg)
(gdb) disas/r blk_mq_start_request
Dump of assembler code for function blk_mq_start_request:
0xffffffff815118e0 <+0>: e8 4b bf b5 ff callq 0xffffffff8106d830 <__fentry__>
0xffffffff815118e5 <+5>: 55 push %rbp
0xffffffff815118e6 <+6>: 48 89 e5 mov %rsp,%rbp
0xffffffff815118e9 <+9>: 41 55 push %r13
0xffffffff815118eb <+11>: 41 54 push %r12
0xffffffff815118ed <+13>: 49 89 fc mov %rdi,%r12
0xffffffff815118f0 <+16>: 53 push %rbx
0xffffffff815118f1 <+17>: 4c 8b 2f mov (%rdi),%r13
0xffffffff815118f4 <+20>: 0f 1f 44 00 00 nopl 0x0(%rax,%rax,1)
0xffffffff815118f9 <+25>: 49 8b 45 60 mov 0x60(%r13),%rax
[...]
Instrumenting tracepoints (2)
This 5-byte nop is a placeholder. Does nothing quickly.
When the tracepoint is enabled, the nop becomes a jmp to the tracepoint
trampoline.
How do we include the tracepoint without adding overhead?](https://image.slidesharecdn.com/lisa2021bpfinternals-210615021243/85/BPF-Internals-eBPF-112-320.jpg)
![BPF Internals (Brendan Gregg)
User-space map iteration
If ...
int BPFtrace::print_map(IMap &map, uint32_t top, uint32_t div)
[…]
while (bpf_get_next_key(map.mapfd_, old_key.data(), key.data()) == 0)
{
int value_size = map.type_.GetSize();
value_size *= nvalues;
auto value = std::vector<uint8_t>(value_size);
int err = bpf_lookup_elem(map.mapfd_, key.data(), value.data());
if (err == -1)
{
// key was removed by the eBPF program during bpf_get_next_key() and bpf_lookup_elem(),
// let's skip this key
continue;
}
else if (err)
{
LOG(ERROR) << "failed to look up elem: " << err;
return -1;
}
values_by_key.push_back({key, value});
old_key = key;
}
bpftrace src/bpftrace.cpp
libbcc/
libbpf
bpf(2)
syscall
kernel](https://image.slidesharecdn.com/lisa2021bpfinternals-210615021243/85/BPF-Internals-eBPF-114-320.jpg)
![BPF Internals (Brendan Gregg)
Reading entire BPF maps
# strace -febpf bpftrace -e 'block:block_rq_issue {
@[comm] = count(); }'
[...]
bpf(BPF_MAP_LOOKUP_ELEM, {map_fd=3, key=0x557e422133e0, value=0x557e4221eab0, flags=BPF_ANY}, 120) = -
1 ENOENT (No such file or directory)
bpf(BPF_MAP_GET_NEXT_KEY, {map_fd=3, key=0x557e422133e0, next_key=0x557e4224d3f0}, 120) = 0
bpf(BPF_MAP_LOOKUP_ELEM, {map_fd=3, key=0x557e4224d3f0, value=0x557e4221eab0, flags=BPF_ANY}, 120) = 0
bpf(BPF_MAP_GET_NEXT_KEY, {map_fd=3, key=0x557e422133e0, next_key=0x557e4224d3f0}, 120) = 0
bpf(BPF_MAP_LOOKUP_ELEM, {map_fd=3, key=0x557e4224d3f0, value=0x557e4221eab0, flags=BPF_ANY}, 120) = 0
bpf(BPF_MAP_GET_NEXT_KEY, {map_fd=3, key=0x557e422133e0, next_key=0x557e4224d3f0}, 120) = 0
bpf(BPF_MAP_LOOKUP_ELEM, {map_fd=3, key=0x557e4224d3f0, value=0x557e4221eab0, flags=BPF_ANY}, 120) = 0
bpf(BPF_MAP_GET_NEXT_KEY, {map_fd=3, key=0x557e422133e0, next_key=0x557e4224d3f0}, 120) = 0
bpf(BPF_MAP_LOOKUP_ELEM, {map_fd=3, key=0x557e4224d3f0, value=0x557e4221eab0, flags=BPF_ANY}, 120) = 0
bpf(BPF_MAP_GET_NEXT_KEY, {map_fd=3, key=0x557e422133e0, next_key=0x557e4224d3f0}, 120) = 0
bpf(BPF_MAP_LOOKUP_ELEM, {map_fd=3, key=0x557e4224d3f0, value=0x557e4221eab0, flags=BPF_ANY}, 120) = 0
bpf(BPF_MAP_GET_NEXT_KEY, {map_fd=3, key=0x557e422133e0, next_key=0x557e4224d3f0}, 120) = 0
bpf(BPF_MAP_LOOKUP_ELEM, {map_fd=3, key=0x557e4224d3f0, value=0x557e4221eab0, flags=BPF_ANY}, 120) = 0
[...]
This is an infrequent activity (this program only does this once)](https://image.slidesharecdn.com/lisa2021bpfinternals-210615021243/85/BPF-Internals-eBPF-115-320.jpg)
![BPF Internals (Brendan Gregg)
# bpftrace -e 'tracepoint:block:block_rq_issue {
@[comm] = count();
}'
Attaching 1 probe…
^C
@[kworker/2:2H]: 131
@[chrome]: 135
@[kworker/7:1H]: 185
@[Xorg]: 245
@[tar]: 1204
@[dmcrypt_write/2]: 1993
Final output](https://image.slidesharecdn.com/lisa2021bpfinternals-210615021243/85/BPF-Internals-eBPF-116-320.jpg)


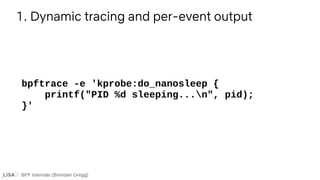
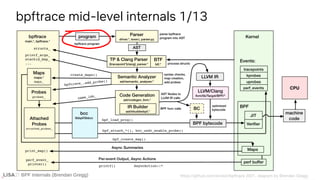
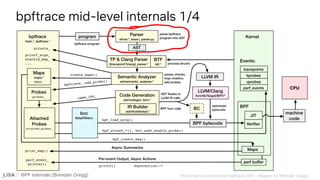
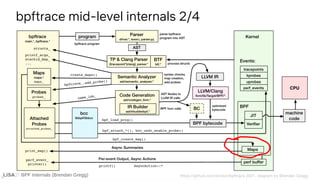
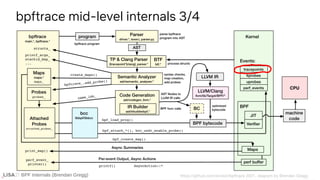
The document discusses BPF (Berkeley Packet Filter) internals, tracing examples using eBPF, and its evolution into a modern generic in-kernel execution environment. Key concepts include dynamic and static tracing, BPF program state models, and tooling like bcc and bpftrace used for observability and performance monitoring. It provides insights into parsing, grammar rules, and AST transformations involved in developing BPF tracing programs.