Download as PDF, PPTX
![# readahead.bt
Attaching 5 probes...
^C
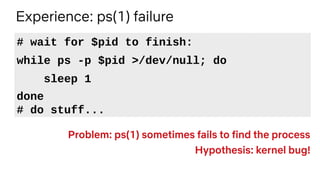
Readahead unused pages: 128
Readahead used page age (ms):
@age_ms:
[1] 2455 |@@@@@@@@@@@@@@@ |
[2, 4) 8424 |@@@@@@@@@@@@@@@@@@@@@@@@@@@@@@@@@@@@@@@@@@@@@@@@@@@@|
[4, 8) 4417 |@@@@@@@@@@@@@@@@@@@@@@@@@@@ |
[8, 16) 7680 |@@@@@@@@@@@@@@@@@@@@@@@@@@@@@@@@@@@@@@@@@@@@@@@ |
[16, 32) 4352 |@@@@@@@@@@@@@@@@@@@@@@@@@@ |
[32, 64) 0 | |
[64, 128) 0 | |
[128, 256) 384 |@@ |
BPF
Observability
Brendan Gregg
LSFMM
Apr 2019](https://image.slidesharecdn.com/lsfmm2019bpfobservability-190501154804/85/LSFMM-2019-BPF-Observability-1-320.jpg)
![# readahead.bt
Attaching 5 probes...
^C
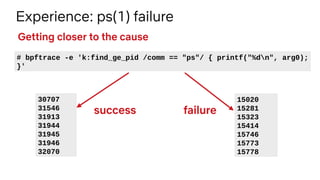
Readahead unused pages: 128
Readahead used page age (ms):
@age_ms:
[1] 2455 |@@@@@@@@@@@@@@@ |
[2, 4) 8424 |@@@@@@@@@@@@@@@@@@@@@@@@@@@@@@@@@@@@@@@@@@@@@@@@@@@@|
[4, 8) 4417 |@@@@@@@@@@@@@@@@@@@@@@@@@@@ |
[8, 16) 7680 |@@@@@@@@@@@@@@@@@@@@@@@@@@@@@@@@@@@@@@@@@@@@@@@ |
[16, 32) 4352 |@@@@@@@@@@@@@@@@@@@@@@@@@@ |
[32, 64) 0 | |
[64, 128) 0 | |
[128, 256) 384 |@@ |
BPF
Observability
Brendan Gregg
LSFMM
Apr 2019](https://image.slidesharecdn.com/lsfmm2019bpfobservability-190501154804/75/LSFMM-2019-BPF-Observability-1-2048.jpg)


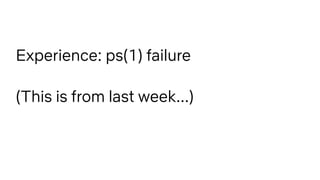
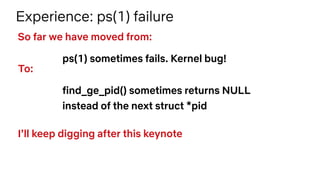
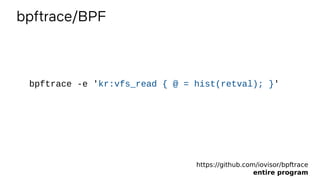
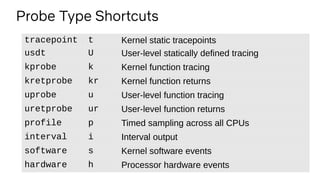
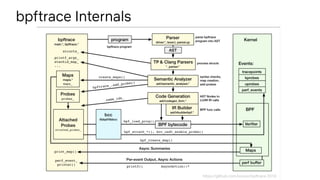
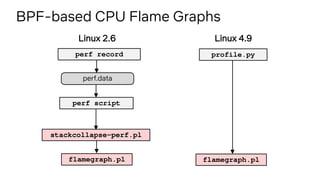
![Experience: ps(1) failure
# bpftrace -e 't:syscalls:sys_exit_* /comm == "ps"/ {
@[probe, args->ret > 0 ? 0 : - args->ret] = count(); }'
Attaching 316 probes...
[...]
@[tracepoint:syscalls:sys_exit_openat, 2]: 120
@[tracepoint:syscalls:sys_exit_newfstat, 0]: 180
@[tracepoint:syscalls:sys_exit_mprotect, 0]: 230
@[tracepoint:syscalls:sys_exit_rt_sigaction, 0]: 240
@[tracepoint:syscalls:sys_exit_mmap, 0]: 350
@[tracepoint:syscalls:sys_exit_newstat, 0]: 5000
@[tracepoint:syscalls:sys_exit_read, 0]: 10170
@[tracepoint:syscalls:sys_exit_close, 0]: 10190
@[tracepoint:syscalls:sys_exit_openat, 0]: 10190
Which syscall is abnormally failing (without strace(1) )?](https://image.slidesharecdn.com/lsfmm2019bpfobservability-190501154804/85/LSFMM-2019-BPF-Observability-9-320.jpg)
![Experience: ps(1) failure
# bpftrace -e 't:raw_syscalls:sys_exit /comm == "ps"/ {
@[args->id, args->ret > 0 ? 0 : - args->ret] = count(); }'
Attaching 1 probe...
[...]
@[21, 2]: 120
@[5, 0]: 180
@[10, 0]: 230
@[13, 0]: 240
@[9, 0]: 350
@[4, 0]: 5000
@[0, 0]: 10170
@[3, 0]: 10190
@[257, 0]: 10190
Which syscall is abnormally failing (without multi-probe)?](https://image.slidesharecdn.com/lsfmm2019bpfobservability-190501154804/85/LSFMM-2019-BPF-Observability-10-320.jpg)
![Experience: ps(1) failure
# bpftrace -e 't:raw_syscalls:sys_exit /comm == "ps"/ {
@[ksym(*(kaddr("sys_call_table") + args->id * 8)),
args->ret > 0 ? 0 : - args->ret] = count(); }'
[...]
@[sys_brk, 0]: 8202
@[sys_ioctl, 25]: 8203
@[sys_access, 2]: 32808
@[SyS_openat, 2]: 32808
@[sys_newfstat, 0]: 49213
@[sys_newstat, 2]: 60820
@[sys_mprotect, 0]: 62882
[...]
Which syscall is abnormally failing (without multi-probe)?
caught 1 extra failure
ioctl() was a dead end](https://image.slidesharecdn.com/lsfmm2019bpfobservability-190501154804/85/LSFMM-2019-BPF-Observability-11-320.jpg)
![Experience: ps(1) failure
# bpftrace -e 't:syscalls:sys_exit_getdents /comm == "ps"/ {
printf("ret: %dn", args->ret); }'
[...]
ret: 9192
ret: 0
ret: 9216
ret: 0
ret: 9168
ret: 0
ret: 5640
ret: 0
^C
Which syscall is successfully failing?](https://image.slidesharecdn.com/lsfmm2019bpfobservability-190501154804/85/LSFMM-2019-BPF-Observability-12-320.jpg)
![Experience: ps(1) failure
# bpftrace -e 't:syscalls:sys_enter_getdents /comm == "ps"/ {
@start[tid] = nsecs; }
t:syscalls:sys_exit_getdents /@start[tid]/ {
printf("%8d us, ret: %dn", (nsecs - @start[tid]) / 1000,
args->ret); delete(@start[tid]); }'
[...]
559 us, ret: 9640
3 us, ret: 0
516 us, ret: 9576
3 us, ret: 0
373 us, ret: 7720
2 us, ret: 0
^C
Which syscall is successfully failing?](https://image.slidesharecdn.com/lsfmm2019bpfobservability-190501154804/85/LSFMM-2019-BPF-Observability-13-320.jpg)
![Experience: ps(1) failure
# funccount '*proc*'
Tracing "*proc*"... Ctrl-C to end.^C
FUNC COUNT
[…]
proc_readdir 1492
proc_readdir_de 1492
proc_root_getattr 1492
process_measurement 1669
kick_process 1671
wake_up_process 2188
proc_pid_readdir 2984
proc_root_readdir 2984
proc_fill_cache 977263
/proc debugging](https://image.slidesharecdn.com/lsfmm2019bpfobservability-190501154804/85/LSFMM-2019-BPF-Observability-14-320.jpg)
![Experience: ps(1) failure
# bpftrace -e 'kr:proc_fill_cache /comm == "ps"/ {
@[retval] = count(); }'
Some quick dead ends
# bpftrace -e 'kr:nr_processes /comm == "ps"/ {
printf("%dn", retval); }'
# bpftrace -e 'kr:proc_readdir_de /comm == "ps"/ {
printf("%dn", retval); }'
# bpftrace -e 'kr:proc_root_readdir /comm == "ps"/ {
printf("%dn", retval); }'
Note: this is all in production](https://image.slidesharecdn.com/lsfmm2019bpfobservability-190501154804/85/LSFMM-2019-BPF-Observability-15-320.jpg)
![Experience: ps(1) failure
# bpftrace -e 'k:find_ge_pid /comm == "ps"/ { @nr[tid] = arg0; }
kr:find_ge_pid /@nr[tid]/ {
printf("%d: %llxn", @nr[tid], retval); delete(@nr[tid]); }'
[…]
15561: ffff8a3ee70ad280
15564: ffff8a400244bb80
15569: ffff8a3f6f1a1840
15570: ffff8a3ffe890c00
15571: ffff8a3ffd23bdc0
15575: ffff8a40024fdd80
15576: 0
find_ge_pid() entry argument & return value:](https://image.slidesharecdn.com/lsfmm2019bpfobservability-190501154804/85/LSFMM-2019-BPF-Observability-17-320.jpg)
![Experience: ps(1) failure
struct pid *find_ge_pid(int nr, struct pid_namespace *ns)
{
return idr_get_next(&ns->idr, &nr);
}
[…]
void *idr_get_next(struct idr *idr, int *nextid)
{
[…]
slot = radix_tree_iter_find(&idr->idr_rt, &iter, id);
Subject [RFC 2/2] pid: Replace PID bitmap implementation with IDR API
Date Sat, 9 Sep 2017 18:03:17 +0530
[…]
Kernel source:](https://image.slidesharecdn.com/lsfmm2019bpfobservability-190501154804/85/LSFMM-2019-BPF-Observability-18-320.jpg)

![bpftrace: BPF observability front-end
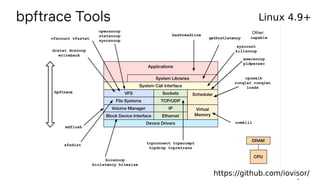
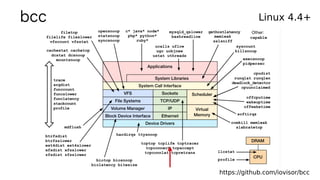
Linux 4.9+ https://github.com/iovisor/bpftrace
# Files opened by process
bpftrace -e 't:syscalls:sys_enter_open { printf("%s %sn", comm,
str(args->filename)) }'
# Read size distribution by process
bpftrace -e 't:syscalls:sys_exit_read { @[comm] = hist(args->ret) }'
# Count VFS calls
bpftrace -e 'kprobe:vfs_* { @[func]++ }'
# Show vfs_read latency as a histogram
bpftrace -e 'k:vfs_read { @[tid] = nsecs }
kr:vfs_read /@[tid]/ { @ns = hist(nsecs - @[tid]); delete(@tid) }’
# Trace user-level function
bpftrace -e 'uretprobe:bash:readline { printf(“%sn”, str(retval)) }’
…](https://image.slidesharecdn.com/lsfmm2019bpfobservability-190501154804/85/LSFMM-2019-BPF-Observability-21-320.jpg)
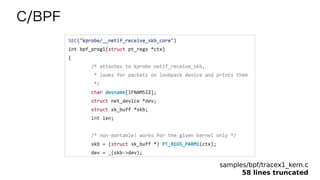
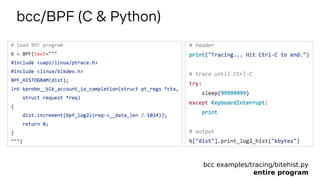


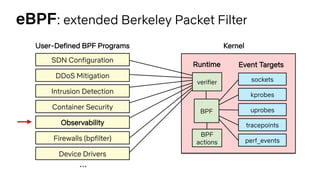
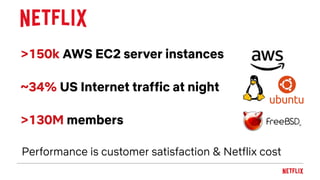
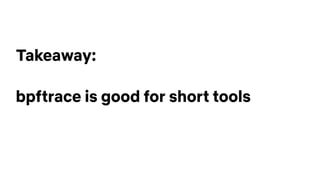
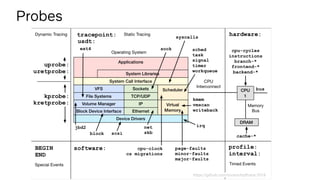
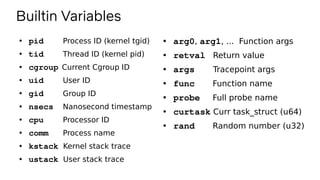
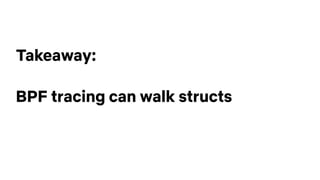
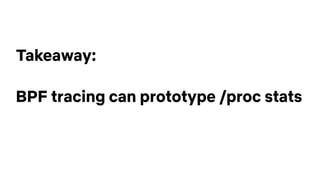
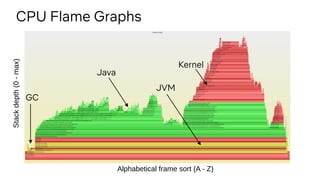
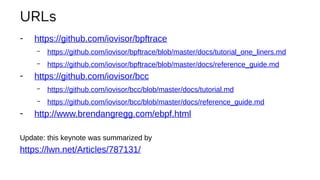
![Experience: readahead
# readahead.bt
Attaching 5 probes...
^C
Readahead unused pages: 128
Readahead used page age (ms):
@age_ms:
[1] 2455 |@@@@@@@@@@@@@@@ |
[2, 4) 8424 |@@@@@@@@@@@@@@@@@@@@@@@@@@@@@@@@@@@@@@@@@@@@@@@@@@@@|
[4, 8) 4417 |@@@@@@@@@@@@@@@@@@@@@@@@@@@ |
[8, 16) 7680 |@@@@@@@@@@@@@@@@@@@@@@@@@@@@@@@@@@@@@@@@@@@@@@@ |
[16, 32) 4352 |@@@@@@@@@@@@@@@@@@@@@@@@@@ |
[32, 64) 0 | |
[64, 128) 0 | |
[128, 256) 384 |@@ |
Is readahead polluting the cache?](https://image.slidesharecdn.com/lsfmm2019bpfobservability-190501154804/85/LSFMM-2019-BPF-Observability-29-320.jpg)
![#!/usr/local/bin/bpftrace
kprobe:__do_page_cache_readahead { @in_readahead[tid] = 1; }
kretprobe:__do_page_cache_readahead { @in_readahead[tid] = 0; }
kretprobe:__page_cache_alloc
/@in_readahead[tid]/
{
@birth[retval] = nsecs;
@rapages++;
}
kprobe:mark_page_accessed
/@birth[arg0]/
{
@age_ms = hist((nsecs - @birth[arg0]) / 1000000);
delete(@birth[arg0]);
@rapages--;
}
END
{
printf("nReadahead unused pages: %dn", @rapages);
printf("nReadahead used page age (ms):n");
print(@age_ms); clear(@age_ms);
clear(@birth); clear(@in_readahead); clear(@rapages);
}](https://image.slidesharecdn.com/lsfmm2019bpfobservability-190501154804/85/LSFMM-2019-BPF-Observability-30-320.jpg)
![bpftrace Syntax
bpftrace -e ‘k:do_nanosleep /pid > 100/ { @[comm]++ }’
Probe
Filter
(optional)
Action](https://image.slidesharecdn.com/lsfmm2019bpfobservability-190501154804/85/LSFMM-2019-BPF-Observability-32-320.jpg)
![Filters
● /pid == 181/
● /comm != “sshd”/
● /@ts[tid]/](https://image.slidesharecdn.com/lsfmm2019bpfobservability-190501154804/85/LSFMM-2019-BPF-Observability-35-320.jpg)
![Functions
●
hist(n) Log2 histogram
●
lhist(n, min, max, step) Linear hist.
●
count() Count events
●
sum(n) Sum value
●
min(n) Minimum value
●
max(n) Maximum value
●
avg(n) Average value
●
stats(n) Statistics
●
str(s) String
●
ksym(p) Resolve kernel addr
●
usym(p) Resolve user addr
●
kaddr(n) Resolve kernel symbol
●
uaddr(n) Resolve user symbol
●
printf(fmt, ...) Print formatted
●
print(@x[, top[, div]]) Print map
●
delete(@x) Delete map element
●
clear(@x) Delete all keys/values
●
reg(n) Register lookup
●
join(a) Join string array
●
time(fmt) Print formatted time
●
system(fmt) Run shell command
●
cat(file) Print file contents
●
exit() Quit bpftrace](https://image.slidesharecdn.com/lsfmm2019bpfobservability-190501154804/85/LSFMM-2019-BPF-Observability-37-320.jpg)
![Variable Types
●
Basic Variables
– @global
– @thread_local[tid]
– $scratch
●
Associative Arrays
– @array[key] = value
●
Buitins
– pid
– ...](https://image.slidesharecdn.com/lsfmm2019bpfobservability-190501154804/85/LSFMM-2019-BPF-Observability-38-320.jpg)
![bpftrace: biolatency
#!/usr/local/bin/bpftrace
BEGIN
{
printf("Tracing block device I/O... Hit Ctrl-C to end.n");
}
kprobe:blk_account_io_start
{
@start[arg0] = nsecs;
}
kprobe:blk_account_io_completion
/@start[arg0]/
{
@usecs = hist((nsecs - @start[arg0]) / 1000);
delete(@start[arg0]);
}](https://image.slidesharecdn.com/lsfmm2019bpfobservability-190501154804/85/LSFMM-2019-BPF-Observability-40-320.jpg)

![Experience: superping
# ping 172.20.0.1
PING 172.20.0.1 (172.20.0.1) 56(84) bytes of data.
64 bytes from 172.20.0.1: icmp_seq=1 ttl=64 time=2.87 ms
64 bytes from 172.20.0.1: icmp_seq=2 ttl=64 time=1.66 ms
64 bytes from 172.20.0.1: icmp_seq=3 ttl=64 time=1.55 ms
64 bytes from 172.20.0.1: icmp_seq=4 ttl=64 time=1.11 ms
64 bytes from 172.20.0.1: icmp_seq=5 ttl=64 time=2.48 ms
64 bytes from 172.20.0.1: icmp_seq=6 ttl=64 time=2.39 ms
[...]
How much is scheduler latency?](https://image.slidesharecdn.com/lsfmm2019bpfobservability-190501154804/85/LSFMM-2019-BPF-Observability-42-320.jpg)
![Experience: superping
# ./superping.bt
Attaching 6 probes...
Tracing ICMP echo request latency. Hit Ctrl-C to end.
IPv4 ping, ID 9827 seq 1: 2883 us
IPv4 ping, ID 9827 seq 2: 1682 us
IPv4 ping, ID 9827 seq 3: 1568 us
IPv4 ping, ID 9827 seq 4: 1078 us
IPv4 ping, ID 9827 seq 5: 2486 us
IPv4 ping, ID 9827 seq 6: 2394 us
[...]
How much is scheduler latency?
?!](https://image.slidesharecdn.com/lsfmm2019bpfobservability-190501154804/85/LSFMM-2019-BPF-Observability-43-320.jpg)
![#!/usr/local/bin/bpftrace
#include <linux/skbuff.h>
#include <linux/icmp.h>
#include <linux/ip.h>
#include <linux/ipv6.h>
#include <linux/in.h>
BEGIN { printf("Tracing ICMP echo request latency. Hit Ctrl-C to end.n"); }
kprobe:ip_send_skb
{
$skb = (struct sk_buff *)arg1;
// get IPv4 header; see skb_network_header():
$iph = (struct iphdr *)($skb->head + $skb->network_header);
if ($iph->protocol == IPPROTO_ICMP) {
// get ICMP header; see skb_transport_header():
$icmph = (struct icmphdr *)($skb->head + $skb->transport_header);
if ($icmph->type == ICMP_ECHO) {
$id = $icmph->un.echo.id;
$seq = $icmph->un.echo.sequence;
@start[$id, $seq] = nsecs;
}
}
}
[...]
Note: no debuginfo required](https://image.slidesharecdn.com/lsfmm2019bpfobservability-190501154804/85/LSFMM-2019-BPF-Observability-44-320.jpg)

![Experience: tcplife
# ./tcplife
PID COMM LADDR LPORT RADDR RPORT TX_KB RX_KB MS
22597 recordProg 127.0.0.1 46644 127.0.0.1 28527 0 0 0.23
3277 redis-serv 127.0.0.1 28527 127.0.0.1 46644 0 0 0.28
22598 curl 100.66.3.172 61620 52.205.89.26 80 0 1 91.79
22604 curl 100.66.3.172 44400 52.204.43.121 80 0 1 121.38
22624 recordProg 127.0.0.1 46648 127.0.0.1 28527 0 0 0.22
3277 redis-serv 127.0.0.1 28527 127.0.0.1 46648 0 0 0.27
22647 recordProg 127.0.0.1 46650 127.0.0.1 28527 0 0 0.21
3277 redis-serv 127.0.0.1 28527 127.0.0.1 46650 0 0 0.26
[...]
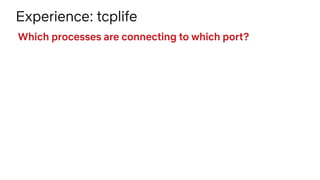
Which processes are connecting to which port?](https://image.slidesharecdn.com/lsfmm2019bpfobservability-190501154804/85/LSFMM-2019-BPF-Observability-51-320.jpg)
![int kprobe__tcp_set_state(struct pt_regs *ctx, struct sock *sk, int state)
{
u32 pid = bpf_get_current_pid_tgid() >> 32;
// lport is either used in a filter here, or later
u16 lport = sk->__sk_common.skc_num;
[…]
struct tcp_sock *tp = (struct tcp_sock *)sk;
rx_b = tp->bytes_received;
tx_b = tp->bytes_acked;
u16 family = sk->__sk_common.skc_family;
if (family == AF_INET) {
struct ipv4_data_t data4 = {};
data4.span_us = delta_us;
data4.rx_b = rx_b;
data4.tx_b = tx_b;
data4.ts_us = bpf_ktime_get_ns() / 1000;
data4.saddr = sk->__sk_common.skc_rcv_saddr;
data4.daddr = sk->__sk_common.skc_daddr;
[…]
bcc: tcplife](https://image.slidesharecdn.com/lsfmm2019bpfobservability-190501154804/85/LSFMM-2019-BPF-Observability-53-320.jpg)
![Experience: tcplife
# bpftrace -lv t:tcp:tcp_set_state
tracepoint:tcp:tcp_set_state
const void * skaddr;
int oldstate;
int newstate;
__u16 sport;
__u16 dport;
__u8 saddr[4];
__u8 daddr[4];
__u8 saddr_v6[16];
__u8 daddr_v6[16];
From kprobes to tracepoints
# bpftrace -lv t:sock:inet_sock_set_state
tracepoint:sock:inet_sock_set_state
const void * skaddr;
int oldstate;
int newstate;
__u16 sport;
__u16 dport;
__u16 family;
__u8 protocol;
__u8 saddr[4];
__u8 daddr[4];
__u8 saddr_v6[16];
__u8 daddr_v6[16];Linux 4.15
Linux 4.16+](https://image.slidesharecdn.com/lsfmm2019bpfobservability-190501154804/85/LSFMM-2019-BPF-Observability-54-320.jpg)


![Experience: cachestat
# cachestat
HITS MISSES DIRTIES HITRATIO BUFFERS_MB CACHED_MB
1132 0 4 100.00% 277 4367
161 0 36 100.00% 277 4372
16 0 28 100.00% 277 4372
17154 13750 15 55.51% 277 4422
19 0 1 100.00% 277 4422
83 0 83 100.00% 277 4421
16 0 1 100.00% 277 4423
[...]
What is the page cache hit ratio?](https://image.slidesharecdn.com/lsfmm2019bpfobservability-190501154804/85/LSFMM-2019-BPF-Observability-58-320.jpg)
![b.attach_kprobe(event="add_to_page_cache_lru", fn_name="do_count")
b.attach_kprobe(event="mark_page_accessed", fn_name="do_count")
b.attach_kprobe(event="account_page_dirtied", fn_name="do_count")
b.attach_kprobe(event="mark_buffer_dirty", fn_name="do_count")
[…]
# total = total cache accesses without counting dirties
# misses = total of add to lru because of read misses
total = mpa - mbd
misses = apcl - apd
if misses < 0:
misses = 0
if total < 0:
total = 0
hits = total - misses
# If hits are < 0, then its possible misses are overestimated
# due to possibly page cache read ahead adding more pages than
# needed. In this case just assume misses as total and reset hits.
if hits < 0:
misses = total
hits = 0
[…]
This is a sandcastle](https://image.slidesharecdn.com/lsfmm2019bpfobservability-190501154804/85/LSFMM-2019-BPF-Observability-59-320.jpg)


Here is a bpftrace program to measure scheduler latency for ICMP echo requests: #!/usr/local/bin/bpftrace kprobe:icmp_send { @start[tid] = nsecs; } kprobe:__netif_receive_skb_core { @diff[tid] = hist(nsecs - @start[tid]); delete(@start[tid]); } END { print(@diff); clear(@diff); } This traces the time between the icmp_send kernel function (when the packet is queued for transmit) and the __netif_receive_skb_core function (when the response packet is received). The


![Getting Started with Apache Spark: Big Data Made Simple [Free Meetup]](https://cdn.slidesharecdn.com/ss_thumbnails/apachesparkgettingstarted-260203175547-8361bcc3-thumbnail.jpg?width=640&height=640&fit=bounds)


