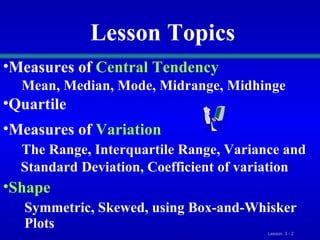
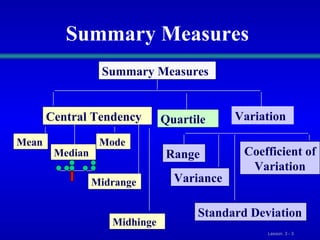
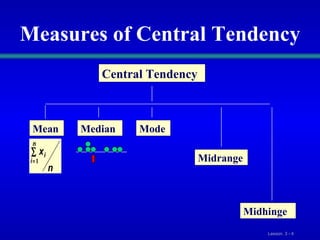
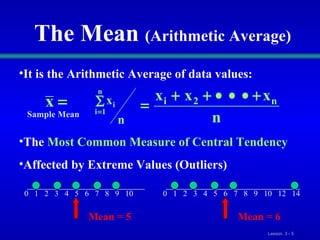
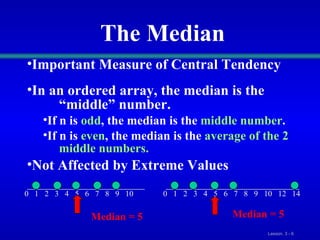
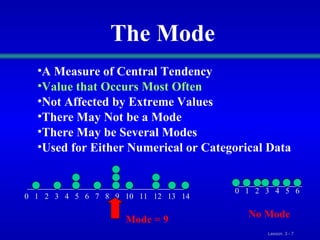
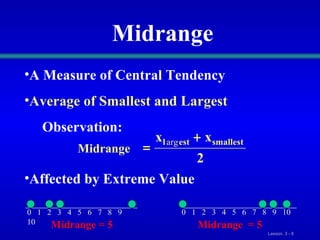
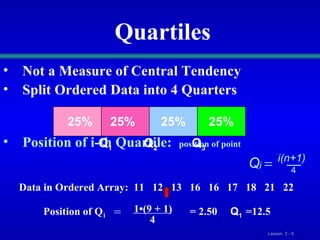
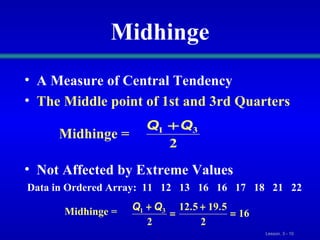
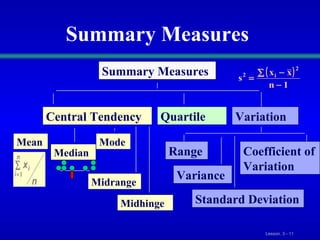
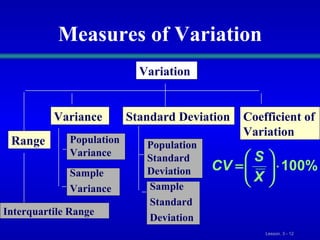
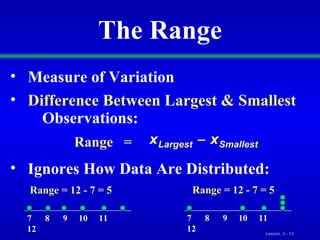
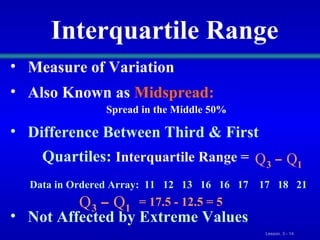
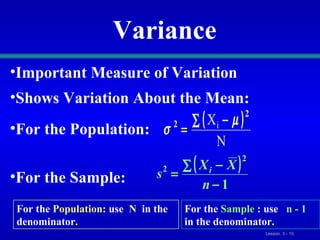
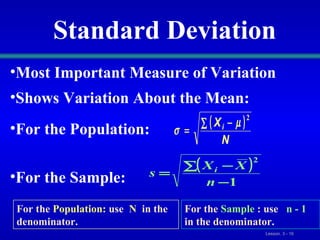
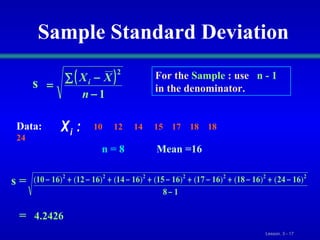
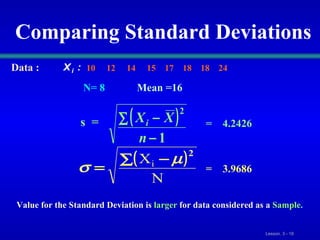
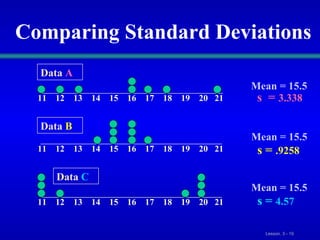
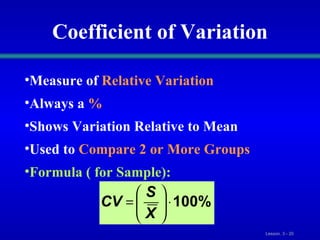
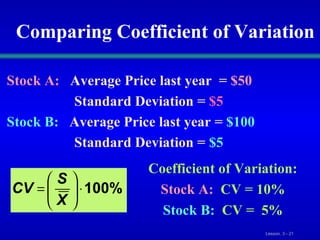
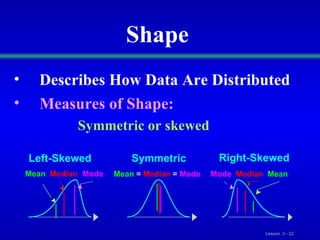
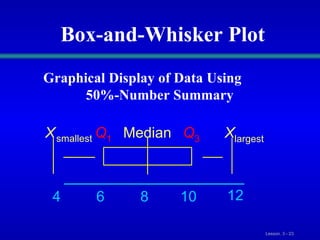
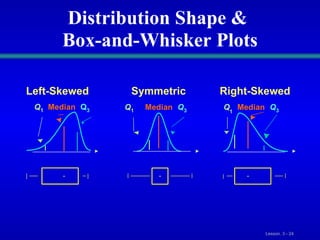
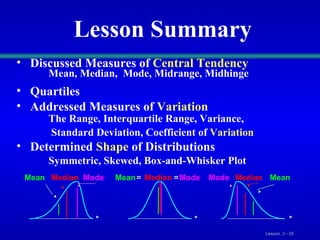
Statistics  for Management  Summarizing and Describing Numerical Data
Lesson Topics Measures of   Central Tendency Mean, Median, Mode, Midrange,  Midhinge Quartile Measures of   Variation The Range, Interquartile Range, Variance and  Standard Deviation, Coefficient of variation Shape Symmetric, Skewed, using Box-and-Whisker  Plots
Summary Measures  Central Tendency Mean Median Mode Midrange Quartile Midhinge Summary Measures Variation Variance Standard Deviation Coefficient of Variation Range
Measures of Central Tendency Central Tendency Mean Median Mode Midrange Midhinge
The Mean  (Arithmetic Average) It is the   Arithmetic Average   of data values: The  Most Common Measure of Central Tendency Affected by Extreme Values   (Outliers) 0  1  2  3  4  5  6  7  8  9  10 0  1  2  3  4  5  6  7  8  9  10  12  14  Mean = 5 Mean = 6 Sample Mean
The Median 0  1  2  3  4  5  6  7  8  9  10 0  1  2  3  4  5  6  7  8  9  10  12  14  Median = 5 Median = 5 Important Measure of Central Tendency In an ordered array, the median is the  “ middle” number. If n is  odd , the median is the  middle number . If n is  even , the median is the  average of the 2  middle numbers. Not Affected by Extreme Values
The Mode 0  1  2  3  4  5  6  7  8  9  10  11  12  13  14  Mode = 9 A Measure of Central Tendency Value that Occurs Most Often Not Affected by Extreme Values There May Not be a Mode There May be Several Modes Used for Either Numerical or Categorical Data 0  1  2  3  4  5  6 No Mode
Midrange A Measure of Central Tendency Average of Smallest and Largest   Observation: Affected by Extreme Value Midrange 0  1  2  3  4  5  6  7  8  9  10 0  1  2  3  4  5  6  7  8  9  10 Midrange = 5 Midrange  = 5
Quartiles Not a Measure of Central Tendency Split Ordered Data into 4 Quarters Position of i-th Quartile:  position of point 25% 25% 25% 25% Q 1 Q 2 Q 3 Q i(n+1) i  4 Data in Ordered Array:  11  12  13  16  16  17  18  21  22  Position of Q 1  = 2.50  Q 1 =12.5 = 1•(9 + 1) 4
Midhinge A Measure of Central Tendency The Middle point of 1st and 3rd Quarters Not Affected by Extreme Values Midhinge =  Data in Ordered Array:  11  12  13  16  16  17  18  21  22 Midhinge =
Summary Measures  Central Tendency Mean Median Mode Midrange Quartile Midhinge Summary Measures Variation Variance Standard Deviation Coefficient of Variation Range
Measures of Variation Variation Variance Standard Deviation Coefficient of Variation Population Variance Sample  Variance Population Standard Deviation Sample  Standard  Deviation Range Interquartile Range
Measure of Variation Difference Between Largest & Smallest   Observations: Range  =   Ignores How Data Are Distributed: The Range 7  8  9  10  11  12 Range = 12 - 7 = 5 7  8  9  10  11  12 Range = 12 - 7 = 5
Measure of Variation Also Known as   Midspread:   Spread in the Middle 50% Difference Between Third & First Quartiles:   Interquartile Range = Not Affected by Extreme Values Interquartile Range Data in Ordered Array:  11  12  13  16  16  17  17  18  21 = 17.5 - 12.5 = 5
Important Measure of Variation  Shows Variation About the Mean: For the Population: For the Sample:  Variance For the  Population : use  N  in the denominator. For the  Sample  : use  n - 1   in the denominator.
Most Important Measure of Variation  Shows Variation About the Mean: For the Population: For the Sample:  Standard Deviation For the   Population:   use   N   in the denominator. For the   Sample  : use   n - 1   in the denominator .
Sample Standard Deviation For the  Sample  : use   n - 1   in the denominator. Data:   10  12  14  15  17  18  18  24 s =  n = 8  Mean =16 =   4.2426 s
Comparing Standard Deviations s  =  =  4.2426 =  3.9686 Value for the Standard Deviation is   larger   for data considered as a   Sample . Data :   10  12  14  15  17  18  18  24 N= 8  Mean =16
Comparing Standard Deviations Mean = 15.5 s  =  3.338   11  12  13  14  15  16  17  18  19  20  21 11  12  13  14  15  16  17  18  19  20  21 Data   B Data  A Mean = 15.5 s =   .9258 11  12  13  14  15  16  17  18  19  20  21 Mean = 15.5 s =   4.57 Data  C
Coefficient of Variation Measure of   Relative Variation Always a   % Shows Variation Relative to Mean Used to   Compare 2 or More Groups Formula ( for Sample):
Comparing Coefficient of Variation Stock A:   Average Price last year  =   $50   Standard Deviation   =  $5 Stock B:   Average Price last year   =  $100   Standard Deviation =   $5 Coefficient of Variation: Stock A:   CV   = 10% Stock B:   CV   =  5%
Shape Describes How Data Are Distributed Measures of Shape:  Symmetric or skewed Right-Skewed Left-Skewed Symmetric Mean =  Median =  Mode Mean Median Mode Median Mean Mode
Box-and-Whisker Plot Graphical Display of Data Using 50%-Number Summary Median 4 6 8 10 12 Q 3 Q 1 X largest X smallest
Distribution Shape &  Box-and-Whisker Plots Right-Skewed Left-Skewed Symmetric Q 1 Median Q 3 Q 1 Median Q 3 Q 1 Median Q 3
Lesson Summary Discussed Measures of   Central Tendency Mean, Median,  Mode, Midrange, Midhinge Quartiles Addressed Measures of   Variation The Range, Interquartile Range, Variance,    Standard Deviation, Coefficient of   Variation Determined  Shape  of Distributions Symmetric, Skewed, Box-and-Whisker Plot Mean =  Median =  Mode Mean Median Mode Mode Median Mean

Lesson03_static11

  • 1.
    Statistics forManagement Summarizing and Describing Numerical Data
  • 2.
    Lesson Topics Measuresof Central Tendency Mean, Median, Mode, Midrange, Midhinge Quartile Measures of Variation The Range, Interquartile Range, Variance and Standard Deviation, Coefficient of variation Shape Symmetric, Skewed, using Box-and-Whisker Plots
  • 3.
    Summary Measures Central Tendency Mean Median Mode Midrange Quartile Midhinge Summary Measures Variation Variance Standard Deviation Coefficient of Variation Range
  • 4.
    Measures of CentralTendency Central Tendency Mean Median Mode Midrange Midhinge
  • 5.
    The Mean (Arithmetic Average) It is the Arithmetic Average of data values: The Most Common Measure of Central Tendency Affected by Extreme Values (Outliers) 0 1 2 3 4 5 6 7 8 9 10 0 1 2 3 4 5 6 7 8 9 10 12 14 Mean = 5 Mean = 6 Sample Mean
  • 6.
    The Median 0 1 2 3 4 5 6 7 8 9 10 0 1 2 3 4 5 6 7 8 9 10 12 14 Median = 5 Median = 5 Important Measure of Central Tendency In an ordered array, the median is the “ middle” number. If n is odd , the median is the middle number . If n is even , the median is the average of the 2 middle numbers. Not Affected by Extreme Values
  • 7.
    The Mode 0 1 2 3 4 5 6 7 8 9 10 11 12 13 14 Mode = 9 A Measure of Central Tendency Value that Occurs Most Often Not Affected by Extreme Values There May Not be a Mode There May be Several Modes Used for Either Numerical or Categorical Data 0 1 2 3 4 5 6 No Mode
  • 8.
    Midrange A Measureof Central Tendency Average of Smallest and Largest Observation: Affected by Extreme Value Midrange 0 1 2 3 4 5 6 7 8 9 10 0 1 2 3 4 5 6 7 8 9 10 Midrange = 5 Midrange = 5
  • 9.
    Quartiles Not aMeasure of Central Tendency Split Ordered Data into 4 Quarters Position of i-th Quartile: position of point 25% 25% 25% 25% Q 1 Q 2 Q 3 Q i(n+1) i  4 Data in Ordered Array: 11 12 13 16 16 17 18 21 22 Position of Q 1 = 2.50 Q 1 =12.5 = 1•(9 + 1) 4
  • 10.
    Midhinge A Measureof Central Tendency The Middle point of 1st and 3rd Quarters Not Affected by Extreme Values Midhinge = Data in Ordered Array: 11 12 13 16 16 17 18 21 22 Midhinge =
  • 11.
    Summary Measures Central Tendency Mean Median Mode Midrange Quartile Midhinge Summary Measures Variation Variance Standard Deviation Coefficient of Variation Range
  • 12.
    Measures of VariationVariation Variance Standard Deviation Coefficient of Variation Population Variance Sample Variance Population Standard Deviation Sample Standard Deviation Range Interquartile Range
  • 13.
    Measure of VariationDifference Between Largest & Smallest Observations: Range = Ignores How Data Are Distributed: The Range 7 8 9 10 11 12 Range = 12 - 7 = 5 7 8 9 10 11 12 Range = 12 - 7 = 5
  • 14.
    Measure of VariationAlso Known as Midspread: Spread in the Middle 50% Difference Between Third & First Quartiles: Interquartile Range = Not Affected by Extreme Values Interquartile Range Data in Ordered Array: 11 12 13 16 16 17 17 18 21 = 17.5 - 12.5 = 5
  • 15.
    Important Measure ofVariation Shows Variation About the Mean: For the Population: For the Sample: Variance For the Population : use N in the denominator. For the Sample : use n - 1 in the denominator.
  • 16.
    Most Important Measureof Variation Shows Variation About the Mean: For the Population: For the Sample: Standard Deviation For the Population: use N in the denominator. For the Sample : use n - 1 in the denominator .
  • 17.
    Sample Standard DeviationFor the Sample : use n - 1 in the denominator. Data: 10 12 14 15 17 18 18 24 s = n = 8 Mean =16 = 4.2426 s
  • 18.
    Comparing Standard Deviationss = = 4.2426 = 3.9686 Value for the Standard Deviation is larger for data considered as a Sample . Data : 10 12 14 15 17 18 18 24 N= 8 Mean =16
  • 19.
    Comparing Standard DeviationsMean = 15.5 s = 3.338 11 12 13 14 15 16 17 18 19 20 21 11 12 13 14 15 16 17 18 19 20 21 Data B Data A Mean = 15.5 s = .9258 11 12 13 14 15 16 17 18 19 20 21 Mean = 15.5 s = 4.57 Data C
  • 20.
    Coefficient of VariationMeasure of Relative Variation Always a % Shows Variation Relative to Mean Used to Compare 2 or More Groups Formula ( for Sample):
  • 21.
    Comparing Coefficient ofVariation Stock A: Average Price last year = $50 Standard Deviation = $5 Stock B: Average Price last year = $100 Standard Deviation = $5 Coefficient of Variation: Stock A: CV = 10% Stock B: CV = 5%
  • 22.
    Shape Describes HowData Are Distributed Measures of Shape: Symmetric or skewed Right-Skewed Left-Skewed Symmetric Mean = Median = Mode Mean Median Mode Median Mean Mode
  • 23.
    Box-and-Whisker Plot GraphicalDisplay of Data Using 50%-Number Summary Median 4 6 8 10 12 Q 3 Q 1 X largest X smallest
  • 24.
    Distribution Shape & Box-and-Whisker Plots Right-Skewed Left-Skewed Symmetric Q 1 Median Q 3 Q 1 Median Q 3 Q 1 Median Q 3
  • 25.
    Lesson Summary DiscussedMeasures of Central Tendency Mean, Median, Mode, Midrange, Midhinge Quartiles Addressed Measures of Variation The Range, Interquartile Range, Variance, Standard Deviation, Coefficient of Variation Determined Shape of Distributions Symmetric, Skewed, Box-and-Whisker Plot Mean = Median = Mode Mean Median Mode Mode Median Mean