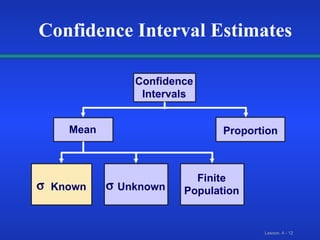
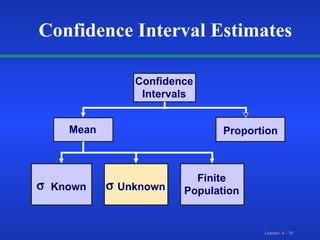
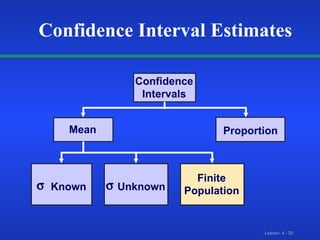
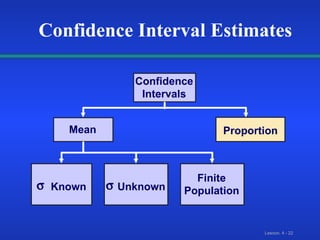
This document discusses statistical confidence interval estimation. It covers:
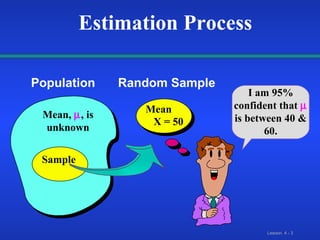
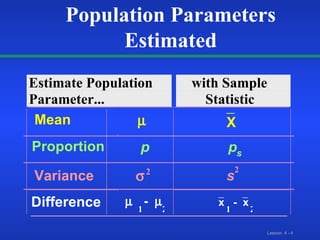
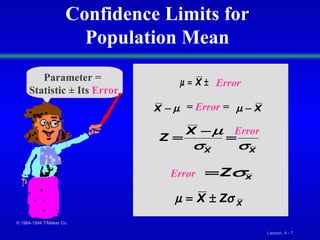
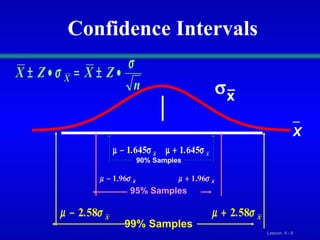
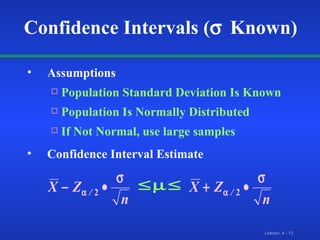
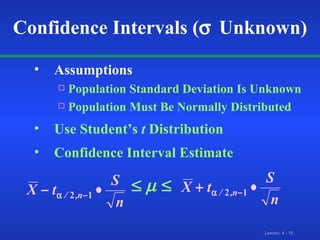
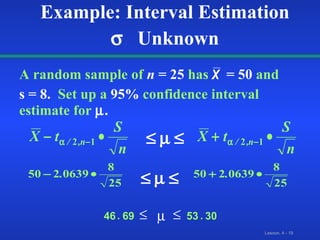
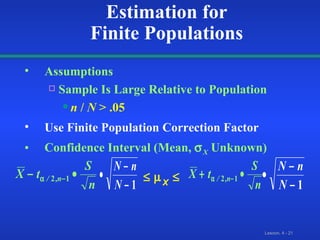
1) Confidence interval estimation for the mean when the population standard deviation is known and unknown.
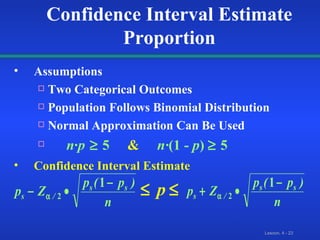
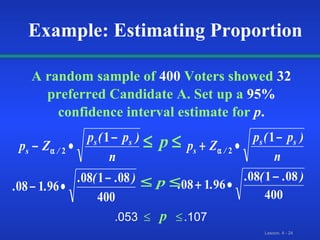
2) Confidence interval estimation for the proportion.
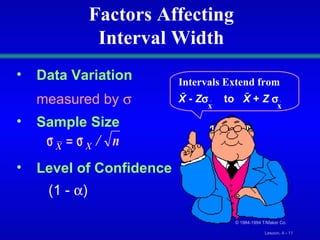
3) Factors that affect confidence interval width like data variation, sample size, and confidence level.
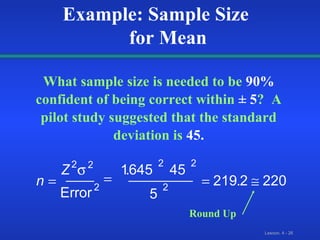
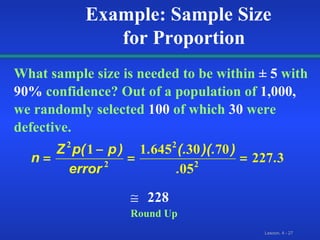
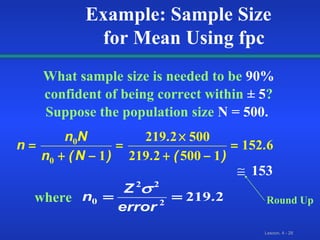
4) How to estimate sample sizes needed to estimate a population mean or proportion within a given level of precision and confidence.