SlideShare a Scribd company logo
Summary Measures
Central Tendency
Mean
Median
Mode
Midrange
Quartile
Midhinge
Summary Measures
Variation
Variance
Standard Deviation
Coefficient of
Variation
Range
Measures of Central Tendency
Central Tendency
Mean Median Mode
Midrange
Midhinge
n
x
n
i
i

1
The Mean (Arithmetic Average)
•It is the Arithmetic Average of data values:
•The Most Common Measure of Central Tendency
•Affected by Extreme Values (Outliers)
n
x
n
1
i
i


n
x
x
x n
2
i 






0 1 2 3 4 5 6 7 8 9 10 0 1 2 3 4 5 6 7 8 9 10 12 14
Mean = 5 Mean = 6

x
Sample Mean
The Median
0 1 2 3 4 5 6 7 8 9 10 0 1 2 3 4 5 6 7 8 9 10 12 14
Median = 5 Median = 5
•Important Measure of Central Tendency
•In an ordered array, the median is the
“middle” number.
•If n is odd, the median is the middle number.
•If n is even, the median is the average of the 2
middle numbers.
•Not Affected by Extreme Values
The Mode
0 1 2 3 4 5 6 7 8 9 10 11 12 13 14
Mode = 9
•A Measure of Central Tendency
•Value that Occurs Most Often
•Not Affected by Extreme Values
•There May Not be a Mode
•There May be Several Modes
•Used for Either Numerical or Categorical Data
0 1 2 3 4 5 6
No Mode
• Measure of Variation
• Difference Between Largest & Smallest
Observations:
Range =
• Ignores How Data Are Distributed:
The Range
Smallest
rgest
La x
x 
7 8 9 10 11 12
Range = 12 - 7 = 5
7 8 9 10 11 12
Range = 12 - 7 = 5
Midrange
•A Measure of Central Tendency
•Average of Smallest and Largest
Observation:
•Affected by Extreme Value
2
x
x smallest
est
l 
 arg
Midrange
0 1 2 3 4 5 6 7 8 9 10 0 1 2 3 4 5 6 7 8 9 10
Midrange = 5 Midrange = 5
Quartiles
• Not a Measure of Central Tendency
• Split Ordered Data into 4 Quarters
• Position of i-th Quartile: position of point
25% 25% 25% 25%
Q1 Q2 Q3
Q i(n+1)
i  4
Data in Ordered Array: 11 12 13 16 16 17 18 21 22
Position of Q1 = 2.50 Q1 =12.5
= 1•(9 + 1)
4
• Measure of Variation
• Also Known as Midspread:
Spread in the Middle 50%
• Difference Between Third & First
Quartiles: Interquartile Range =
• Not Affected by Extreme Values
Interquartile Range
1
3 Q
Q 
Data in Ordered Array: 11 12 13 16 16 17 17 18 21
1
3 Q
Q  = 17.5 - 12.5 = 5
•Important Measure of Variation
•Shows Variation About the Mean:
•For the Population:
•For the Sample:
Variance
 
N
Xi
 

2
2 

 
1
2
2

 

n
X
X
s i
For the Population: use N in the
denominator.
For the Sample : use n - 1
in the denominator.
Comparing Standard Deviations
 
1
2

 
n
X
Xi
s = = 4.2426
 
N
X i
 

2

 = 3.9686
Value for the Standard Deviation is larger for data considered as a Sample.
Data : 10 12 14 15 17 18 18 24
:
X i
N= 8 Mean =16
Comparing Standard Deviations
Mean = 15.5
s = 3.338
11 12 13 14 15 16 17 18 19 20 21
11 12 13 14 15 16 17 18 19 20 21
Data B
Data A
Mean = 15.5
s = .9258
11 12 13 14 15 16 17 18 19 20 21
Mean = 15.5
s = 4.57
Data C
Coefficient of Variation
•Measure of Relative Variation
•Always a %
•Shows Variation Relative to Mean
•Used to Compare 2 or More Groups
•Formula ( for Sample):
100%








X
S
CV
Comparing Coefficient of Variation
• Stock A: Average Price last year = $50
• Standard Deviation = $5
• Stock B: Average Price last year = $100
• Standard Deviation = $5
100%








X
S
CV
Coefficient of Variation:
Stock A: CV = 10%
Stock B: CV = 5%
Shape
• Describes How Data Are Distributed
• Measures of Shape:
• Symmetric or skewed
Right-Skewed
Left-Skewed Symmetric
Mean = Median = Mode
Mean Median Mode Median Mean
Mod
e

More Related Content

Similar to STATISTICAL MEASURES.ppt

Statisticsforbiologists colstons
Statisticsforbiologists colstonsStatisticsforbiologists colstons
Statisticsforbiologists colstons
andymartin
 
polar pojhjgfnbhggnbh hnhghgnhbhnhbjnhhhhhh
polar pojhjgfnbhggnbh hnhghgnhbhnhbjnhhhhhhpolar pojhjgfnbhggnbh hnhghgnhbhnhbjnhhhhhh
polar pojhjgfnbhggnbh hnhghgnhbhnhbjnhhhhhh
NathanAndreiBoongali
 
Statistics and probability lec006 part 1
Statistics and probability lec006 part 1Statistics and probability lec006 part 1
Statistics and probability lec006 part 1
TieeTiee
 
Measure OF Central Tendency
Measure OF Central TendencyMeasure OF Central Tendency
Measure OF Central Tendency
Iqrabutt038
 
Measures of central tendency
Measures of central tendencyMeasures of central tendency
Measures of central tendency
kreshajay
 
Mean_Median_Mode.ppthhhhhhhhhhhhhhhhhhhhhhhhhhhhhhhhhhhhhhhhhhhhhhhhhhhhhhhhh...
Mean_Median_Mode.ppthhhhhhhhhhhhhhhhhhhhhhhhhhhhhhhhhhhhhhhhhhhhhhhhhhhhhhhhh...Mean_Median_Mode.ppthhhhhhhhhhhhhhhhhhhhhhhhhhhhhhhhhhhhhhhhhhhhhhhhhhhhhhhhh...
Mean_Median_Mode.ppthhhhhhhhhhhhhhhhhhhhhhhhhhhhhhhhhhhhhhhhhhhhhhhhhhhhhhhhh...
JuliusRomano3
 

Similar to STATISTICAL MEASURES.ppt (20)

descriptive statistics.pptx
descriptive statistics.pptxdescriptive statistics.pptx
descriptive statistics.pptx
 
Summarizing data
Summarizing dataSummarizing data
Summarizing data
 
State presentation2
State presentation2State presentation2
State presentation2
 
3.3 Measures of relative standing and boxplots
3.3 Measures of relative standing and boxplots3.3 Measures of relative standing and boxplots
3.3 Measures of relative standing and boxplots
 
Penggambaran Data Secara Numerik
Penggambaran Data Secara NumerikPenggambaran Data Secara Numerik
Penggambaran Data Secara Numerik
 
UNIT III -Measures of Central Tendency 2.ppt
UNIT III -Measures of Central Tendency 2.pptUNIT III -Measures of Central Tendency 2.ppt
UNIT III -Measures of Central Tendency 2.ppt
 
Central Tendency_Final.ppt
Central Tendency_Final.pptCentral Tendency_Final.ppt
Central Tendency_Final.ppt
 
MEASURESD OF CENTRAL TENDENCY 2 with examples.pdf
MEASURESD OF CENTRAL TENDENCY 2 with examples.pdfMEASURESD OF CENTRAL TENDENCY 2 with examples.pdf
MEASURESD OF CENTRAL TENDENCY 2 with examples.pdf
 
UNIT III -Measures of Central Tendency 2.ppt
UNIT III -Measures of Central Tendency 2.pptUNIT III -Measures of Central Tendency 2.ppt
UNIT III -Measures of Central Tendency 2.ppt
 
Statisticsforbiologists colstons
Statisticsforbiologists colstonsStatisticsforbiologists colstons
Statisticsforbiologists colstons
 
polar pojhjgfnbhggnbh hnhghgnhbhnhbjnhhhhhh
polar pojhjgfnbhggnbh hnhghgnhbhnhbjnhhhhhhpolar pojhjgfnbhggnbh hnhghgnhbhnhbjnhhhhhh
polar pojhjgfnbhggnbh hnhghgnhbhnhbjnhhhhhh
 
Statistics and probability lec006 part 1
Statistics and probability lec006 part 1Statistics and probability lec006 part 1
Statistics and probability lec006 part 1
 
Basic Statistical Descriptions of Data.pptx
Basic Statistical Descriptions of Data.pptxBasic Statistical Descriptions of Data.pptx
Basic Statistical Descriptions of Data.pptx
 
Central Tendency
Central TendencyCentral Tendency
Central Tendency
 
Measure OF Central Tendency
Measure OF Central TendencyMeasure OF Central Tendency
Measure OF Central Tendency
 
Unit 3_1.pptx
Unit 3_1.pptxUnit 3_1.pptx
Unit 3_1.pptx
 
Statistics
StatisticsStatistics
Statistics
 
Measures of central tendency
Measures of central tendencyMeasures of central tendency
Measures of central tendency
 
Measure of Variability Report.pptx
Measure of Variability Report.pptxMeasure of Variability Report.pptx
Measure of Variability Report.pptx
 
Mean_Median_Mode.ppthhhhhhhhhhhhhhhhhhhhhhhhhhhhhhhhhhhhhhhhhhhhhhhhhhhhhhhhh...
Mean_Median_Mode.ppthhhhhhhhhhhhhhhhhhhhhhhhhhhhhhhhhhhhhhhhhhhhhhhhhhhhhhhhh...Mean_Median_Mode.ppthhhhhhhhhhhhhhhhhhhhhhhhhhhhhhhhhhhhhhhhhhhhhhhhhhhhhhhhh...
Mean_Median_Mode.ppthhhhhhhhhhhhhhhhhhhhhhhhhhhhhhhhhhhhhhhhhhhhhhhhhhhhhhhhh...
 

More from sadiakhan783184 (6)

Theories of Envoirnmnetal Psy.ppt
Theories of Envoirnmnetal Psy.pptTheories of Envoirnmnetal Psy.ppt
Theories of Envoirnmnetal Psy.ppt
 
Frequency distributions.pptx
Frequency distributions.pptxFrequency distributions.pptx
Frequency distributions.pptx
 
LINEAR REGRESSION ANALYSIS.pptx
LINEAR REGRESSION ANALYSIS.pptxLINEAR REGRESSION ANALYSIS.pptx
LINEAR REGRESSION ANALYSIS.pptx
 
HYPOTHESIS TESTING.ppt
HYPOTHESIS TESTING.pptHYPOTHESIS TESTING.ppt
HYPOTHESIS TESTING.ppt
 
CORRELATION.ppt
CORRELATION.pptCORRELATION.ppt
CORRELATION.ppt
 
ANOVA.ppt
ANOVA.pptANOVA.ppt
ANOVA.ppt
 

Recently uploaded

AI/ML Infra Meetup | Improve Speed and GPU Utilization for Model Training & S...
AI/ML Infra Meetup | Improve Speed and GPU Utilization for Model Training & S...AI/ML Infra Meetup | Improve Speed and GPU Utilization for Model Training & S...
AI/ML Infra Meetup | Improve Speed and GPU Utilization for Model Training & S...
Alluxio, Inc.
 

Recently uploaded (20)

WSO2Con2024 - WSO2's IAM Vision: Identity-Led Digital Transformation
WSO2Con2024 - WSO2's IAM Vision: Identity-Led Digital TransformationWSO2Con2024 - WSO2's IAM Vision: Identity-Led Digital Transformation
WSO2Con2024 - WSO2's IAM Vision: Identity-Led Digital Transformation
 
Designing for Privacy in Amazon Web Services
Designing for Privacy in Amazon Web ServicesDesigning for Privacy in Amazon Web Services
Designing for Privacy in Amazon Web Services
 
AI/ML Infra Meetup | Improve Speed and GPU Utilization for Model Training & S...
AI/ML Infra Meetup | Improve Speed and GPU Utilization for Model Training & S...AI/ML Infra Meetup | Improve Speed and GPU Utilization for Model Training & S...
AI/ML Infra Meetup | Improve Speed and GPU Utilization for Model Training & S...
 
A Comprehensive Appium Guide for Hybrid App Automation Testing.pdf
A Comprehensive Appium Guide for Hybrid App Automation Testing.pdfA Comprehensive Appium Guide for Hybrid App Automation Testing.pdf
A Comprehensive Appium Guide for Hybrid App Automation Testing.pdf
 
How to install and activate eGrabber JobGrabber
How to install and activate eGrabber JobGrabberHow to install and activate eGrabber JobGrabber
How to install and activate eGrabber JobGrabber
 
A Python-based approach to data loading in TM1 - Using Airflow as an ETL for TM1
A Python-based approach to data loading in TM1 - Using Airflow as an ETL for TM1A Python-based approach to data loading in TM1 - Using Airflow as an ETL for TM1
A Python-based approach to data loading in TM1 - Using Airflow as an ETL for TM1
 
iGaming Platform & Lottery Solutions by Skilrock
iGaming Platform & Lottery Solutions by SkilrockiGaming Platform & Lottery Solutions by Skilrock
iGaming Platform & Lottery Solutions by Skilrock
 
TROUBLESHOOTING 9 TYPES OF OUTOFMEMORYERROR
TROUBLESHOOTING 9 TYPES OF OUTOFMEMORYERRORTROUBLESHOOTING 9 TYPES OF OUTOFMEMORYERROR
TROUBLESHOOTING 9 TYPES OF OUTOFMEMORYERROR
 
GraphSummit Stockholm - Neo4j - Knowledge Graphs and Product Updates
GraphSummit Stockholm - Neo4j - Knowledge Graphs and Product UpdatesGraphSummit Stockholm - Neo4j - Knowledge Graphs and Product Updates
GraphSummit Stockholm - Neo4j - Knowledge Graphs and Product Updates
 
Top Mobile App Development Companies 2024
Top Mobile App Development Companies 2024Top Mobile App Development Companies 2024
Top Mobile App Development Companies 2024
 
How Does XfilesPro Ensure Security While Sharing Documents in Salesforce?
How Does XfilesPro Ensure Security While Sharing Documents in Salesforce?How Does XfilesPro Ensure Security While Sharing Documents in Salesforce?
How Does XfilesPro Ensure Security While Sharing Documents in Salesforce?
 
A Guideline to Gorgias to to Re:amaze Data Migration
A Guideline to Gorgias to to Re:amaze Data MigrationA Guideline to Gorgias to to Re:amaze Data Migration
A Guideline to Gorgias to to Re:amaze Data Migration
 
Paketo Buildpacks : la meilleure façon de construire des images OCI? DevopsDa...
Paketo Buildpacks : la meilleure façon de construire des images OCI? DevopsDa...Paketo Buildpacks : la meilleure façon de construire des images OCI? DevopsDa...
Paketo Buildpacks : la meilleure façon de construire des images OCI? DevopsDa...
 
StrimziCon 2024 - Transition to Apache Kafka on Kubernetes with Strimzi
StrimziCon 2024 - Transition to Apache Kafka on Kubernetes with StrimziStrimziCon 2024 - Transition to Apache Kafka on Kubernetes with Strimzi
StrimziCon 2024 - Transition to Apache Kafka on Kubernetes with Strimzi
 
How To Build a Successful SaaS Design.pdf
How To Build a Successful SaaS Design.pdfHow To Build a Successful SaaS Design.pdf
How To Build a Successful SaaS Design.pdf
 
AI/ML Infra Meetup | ML explainability in Michelangelo
AI/ML Infra Meetup | ML explainability in MichelangeloAI/ML Infra Meetup | ML explainability in Michelangelo
AI/ML Infra Meetup | ML explainability in Michelangelo
 
Using IESVE for Room Loads Analysis - Australia & New Zealand
Using IESVE for Room Loads Analysis - Australia & New ZealandUsing IESVE for Room Loads Analysis - Australia & New Zealand
Using IESVE for Room Loads Analysis - Australia & New Zealand
 
De mooiste recreatieve routes ontdekken met RouteYou en FME
De mooiste recreatieve routes ontdekken met RouteYou en FMEDe mooiste recreatieve routes ontdekken met RouteYou en FME
De mooiste recreatieve routes ontdekken met RouteYou en FME
 
KLARNA - Language Models and Knowledge Graphs: A Systems Approach
KLARNA -  Language Models and Knowledge Graphs: A Systems ApproachKLARNA -  Language Models and Knowledge Graphs: A Systems Approach
KLARNA - Language Models and Knowledge Graphs: A Systems Approach
 
Corporate Management | Session 3 of 3 | Tendenci AMS
Corporate Management | Session 3 of 3 | Tendenci AMSCorporate Management | Session 3 of 3 | Tendenci AMS
Corporate Management | Session 3 of 3 | Tendenci AMS
 

STATISTICAL MEASURES.ppt

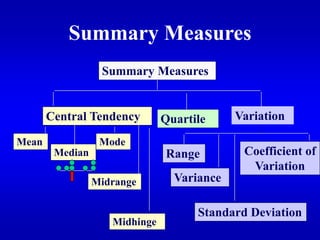
  • 1. Summary Measures Central Tendency Mean Median Mode Midrange Quartile Midhinge Summary Measures Variation Variance Standard Deviation Coefficient of Variation Range
  • 2. Measures of Central Tendency Central Tendency Mean Median Mode Midrange Midhinge n x n i i  1
  • 3. The Mean (Arithmetic Average) •It is the Arithmetic Average of data values: •The Most Common Measure of Central Tendency •Affected by Extreme Values (Outliers) n x n 1 i i   n x x x n 2 i        0 1 2 3 4 5 6 7 8 9 10 0 1 2 3 4 5 6 7 8 9 10 12 14 Mean = 5 Mean = 6  x Sample Mean
  • 4. The Median 0 1 2 3 4 5 6 7 8 9 10 0 1 2 3 4 5 6 7 8 9 10 12 14 Median = 5 Median = 5 •Important Measure of Central Tendency •In an ordered array, the median is the “middle” number. •If n is odd, the median is the middle number. •If n is even, the median is the average of the 2 middle numbers. •Not Affected by Extreme Values
  • 5. The Mode 0 1 2 3 4 5 6 7 8 9 10 11 12 13 14 Mode = 9 •A Measure of Central Tendency •Value that Occurs Most Often •Not Affected by Extreme Values •There May Not be a Mode •There May be Several Modes •Used for Either Numerical or Categorical Data 0 1 2 3 4 5 6 No Mode
  • 6. • Measure of Variation • Difference Between Largest & Smallest Observations: Range = • Ignores How Data Are Distributed: The Range Smallest rgest La x x  7 8 9 10 11 12 Range = 12 - 7 = 5 7 8 9 10 11 12 Range = 12 - 7 = 5
  • 7. Midrange •A Measure of Central Tendency •Average of Smallest and Largest Observation: •Affected by Extreme Value 2 x x smallest est l   arg Midrange 0 1 2 3 4 5 6 7 8 9 10 0 1 2 3 4 5 6 7 8 9 10 Midrange = 5 Midrange = 5
  • 8. Quartiles • Not a Measure of Central Tendency • Split Ordered Data into 4 Quarters • Position of i-th Quartile: position of point 25% 25% 25% 25% Q1 Q2 Q3 Q i(n+1) i  4 Data in Ordered Array: 11 12 13 16 16 17 18 21 22 Position of Q1 = 2.50 Q1 =12.5 = 1•(9 + 1) 4
  • 9. • Measure of Variation • Also Known as Midspread: Spread in the Middle 50% • Difference Between Third & First Quartiles: Interquartile Range = • Not Affected by Extreme Values Interquartile Range 1 3 Q Q  Data in Ordered Array: 11 12 13 16 16 17 17 18 21 1 3 Q Q  = 17.5 - 12.5 = 5
  • 10. •Important Measure of Variation •Shows Variation About the Mean: •For the Population: •For the Sample: Variance   N Xi    2 2     1 2 2     n X X s i For the Population: use N in the denominator. For the Sample : use n - 1 in the denominator.
  • 11. Comparing Standard Deviations   1 2    n X Xi s = = 4.2426   N X i    2   = 3.9686 Value for the Standard Deviation is larger for data considered as a Sample. Data : 10 12 14 15 17 18 18 24 : X i N= 8 Mean =16
  • 12. Comparing Standard Deviations Mean = 15.5 s = 3.338 11 12 13 14 15 16 17 18 19 20 21 11 12 13 14 15 16 17 18 19 20 21 Data B Data A Mean = 15.5 s = .9258 11 12 13 14 15 16 17 18 19 20 21 Mean = 15.5 s = 4.57 Data C
  • 13. Coefficient of Variation •Measure of Relative Variation •Always a % •Shows Variation Relative to Mean •Used to Compare 2 or More Groups •Formula ( for Sample): 100%         X S CV
  • 14. Comparing Coefficient of Variation • Stock A: Average Price last year = $50 • Standard Deviation = $5 • Stock B: Average Price last year = $100 • Standard Deviation = $5 100%         X S CV Coefficient of Variation: Stock A: CV = 10% Stock B: CV = 5%
  • 15. Shape • Describes How Data Are Distributed • Measures of Shape: • Symmetric or skewed Right-Skewed Left-Skewed Symmetric Mean = Median = Mode Mean Median Mode Median Mean Mod e