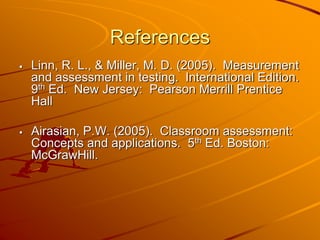
Scoring and Rating
Introduction 
Valid measurement of achievement 
is the product of a systematically 
controlled series of steps, beginning 
with the identification of instructional 
objectives and ending with the 
scoring and interpretation of results.
Scoring The Test 
A Scoring Key – comparing the 
columns of answers from the master 
copy of the test with the columns of 
answers on each student’s paper. 
A Strip Key – cutting the columns of 
answers from the master copy of the 
test and mounting them on strips of 
cardboard cut from manila folders.
Scoring The Test 
A Scoring Stencil – blank answer 
sheet within holes punched where 
the correct answers should appear. 
The stencil is laid over each answer 
sheet and the number of answer 
checks appearing through the holes 
are counted, red line – no answer.
MARKING MULTIPLE-CHOICE 
ITEMS (GOOD PRACTICE) 
Draw a red line through the correct 
answer of the missed items rather than 
through the student’s wrong answers 
Scan each test paper to ensure that 
only ONE answer was marked for each 
item – eliminate any item containing 
more than one answer
Types of Grading and 
Reporting Systems 
Traditional Letter-Grade System 
Pass-Fail System 
Checklists of Objectives 
Letters to Parents/Guardians 
Portfolios of Student Work 
Parent-Teacher Conferences
Traditional letter-Grade System 
Assign a little grade (e.g A,B,C,D,E) for each subject 
In some cases a single number (e.g 5,4,3,2,1) is used 
instead of a letter 
This system is concise, convenient, the marks are easily 
averaged and they are useful in predicting future 
achievement 
Limitations : 
- The student’s strengths and weaknesses in learning are 
not indicated 
- It is difficult to interpret and use a single letter grade
Assigning Letter Grades 
Determining what to include in a grade 
Combining data in assigning grades 
Selecting the proper frame of reference for 
grading 
Determining the distribution of grades
Pass-Fail System 
A two – category system (e.g. satisfactory – 
unsatisfactory, pass–fail) is used 
It is easy to use but it offers less information than the 
traditional A,B,C,D,F system 
It does not provides indication of the level of learning, i.e. 
present performance or predicting future performance 
Suitable to be used for courses using the mastery learning 
approach.
Checklist of Objective 
A list of objectives are checked or rated 
For rating purposes, the traditional A,B,C,D,F system OR 
symbols like O (outstanding), S (satisfactory) and N (need 
improvement) can be used 
Advantage – provide a detailed analysis of the student’s 
strengths and weaknesses so that follow-up activities can 
be carried out to improve learning
Letter to Parents/Guardians 
A flexible way of reporting student’s progress to parents 
The strengths, weaknesses, learning needs and to suggest 
specific plans for improvement can be reported 
Details to indicate clearly the student’s progress in all 
areas of development can be included 
Limitations : 
- requires time and skill in preparing comprehensive and 
thoughtful reports 
- descriptions of student’s learning weaknesses are easily 
misinterpreted by parents. 
- fail to provide a systematic and cumulative record of 
student progress.
Parent-Teacher Conferences 
To establish better cooperation between teachers and 
parents 
A flexible procedure to provide a two-way communication 
between home and school 
Parents can provide information concerning students out-of- 
school life
Parent-Teacher Conferences 
Permits the teacher and parents to ask question, to 
discuss common concerns in helping the student and to 
cooperatively plan a program for improving the student’s 
learning and development. 
Limitations 
- requires a lot of time and skill 
- does not provide a systematic record of student progress 
- some parents are unwilling or unable to come/attend
Multiple Grading and Reporting System 
Retain the use of traditional grading (letter grades or 
numbers) and supplements the grades with 
checklists of objectives. 
Two grades are assigned to each subject: one for 
achievement and the other for effort, improvement, 
or growth
Guidelines for Developing a 
Multiple Grading and Reporting Systems 
Guided by the functions to be served. 
Developed cooperatively by parents, students, and 
school personnel. 
Based on a clear statement of educational objectives. 
Consistent with school standards. 
Based on adequate assessment. 
Detailed enough to be diagnostic and yet compact 
enough to be practical. 
Provide for parent-teacher conferences as needed.
Record-Keeping and 
Grading Software 
Grade books have been a familiar part of 
teaching for many decades. 
Although any simple spreadsheet can be used as 
a grade book, there is a host of specialized 
software available that is specially designed to 
facilitate the common tasks of recording and 
combining grades.
Measures Of Central Tendency 
A convenient way of summarizing data is to find a 
single index that can represent a whole set of 
measures. In statistics, the term "measures of 
central tendency" or “averages” is just a fancy 
name for mean, median and mode. 
The average can be this measure, known as the 
mean, or one of the other two measures of central 
tendency, known as the mode and median. Each 
of these can serve as an index to represent a 
group as a whole.
Mean 
1.Mean 
The most widely used measure of central 
tendency is the mean. It is the sum of a set of 
data divided by the number of data. (the answer 
should not be rounded up unless directed to do 
so.) 
Example 
Sum of the Data 130 = 13 
Number of Data 10
Median 
The median is defined as that point in a distribution of 
measures below which 50 percent of the cases lie. It is the 
middle value or the mean of the middle two values, when 
the data is arranged in numerical order. When there are an 
odd number of scores, the median is the middle score in the 
distribution. 
Example 
5, 5, 10, 10, 10, 15, 15, 15, 20, 25 
it has been found that organizing the data is the easiest way 
to find the median. The numbers 10 and 15 both fall in the 
middle. Thus, these two numbers have to averaged to get 
the median. 
Median = 10+15 = 12.5 
2
Mode 
The mode is the value in a distribution that 
occurs most frequently. It is the value 
(number) that appears the most. It is possible 
to have more than one mode, and it is possible 
to have no mode. If there is no mode, write "no 
mode", do not write zero (0). 
In the example above, two numbers appear the 
most often: 10 and 15. The table shows there 
are three 10's and three 15's. Thus, in this 
example, there are two answers for the mode.
Measures Of Variability 
Variability refers to the "spread-out-ness" 
of scores in the distribution. The greater 
the difference between scores, the more 
spread out the distribution is. The more 
tightly the scores group together, the less 
variability there is in the distribution. One 
such measure of variability or spread is 
the range.
Standard Deviation 
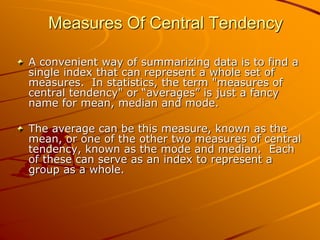
Score Mean X - Mean (X - Mean)2 
7 6 1 1 
6 6 0 0 
7 6 1 1 
8 6 2 4 
2 6 -4 16 
Sum 30 0 22 
Standard Deviation 
S2 (Variance) = [Σ (X-M)2]/(N – 1) 
S2 (Variance) = [Sum (X - M) 2]/(N – 1) 
S2 (Variance) = 22/ (5 – 1) 
S2 (Variance) = 5.5 
S (Standard Deviation) = 2.35
Conclusion 
A student’s score is simply the number 
of items answered correctly. 
When all students answer every item on 
a test, the rank of the students’ scores 
will be the same whether the number is 
right or a correction for guessing is 
used.
Summary 
Scoring Methods 
Grading Systems 
Measures of Central Tendency 
Measures of Variability
Questions 
Which type of scoring method that you 
prefer for the subject that you teach? 
Please justify with reasons. 
Which type of grading system that you 
used in your class? Please clarify with 
reasons.
References 
 Linn, R. L., & Miller, M. D. (2005). Measurement 
and assessment in testing. International Edition. 
9th Ed. New Jersey: Pearson Merrill Prentice 
Hall 
 Airasian, P.W. (2005). Classroom assessment: 
Concepts and applications. 5th Ed. Boston: 
McGrawHill.

Week 6 - Scoring and Rating

  • 1.
  • 2.
    Introduction Valid measurementof achievement is the product of a systematically controlled series of steps, beginning with the identification of instructional objectives and ending with the scoring and interpretation of results.
  • 3.
    Scoring The Test A Scoring Key – comparing the columns of answers from the master copy of the test with the columns of answers on each student’s paper. A Strip Key – cutting the columns of answers from the master copy of the test and mounting them on strips of cardboard cut from manila folders.
  • 4.
    Scoring The Test A Scoring Stencil – blank answer sheet within holes punched where the correct answers should appear. The stencil is laid over each answer sheet and the number of answer checks appearing through the holes are counted, red line – no answer.
  • 5.
    MARKING MULTIPLE-CHOICE ITEMS(GOOD PRACTICE) Draw a red line through the correct answer of the missed items rather than through the student’s wrong answers Scan each test paper to ensure that only ONE answer was marked for each item – eliminate any item containing more than one answer
  • 6.
    Types of Gradingand Reporting Systems Traditional Letter-Grade System Pass-Fail System Checklists of Objectives Letters to Parents/Guardians Portfolios of Student Work Parent-Teacher Conferences
  • 7.
    Traditional letter-Grade System Assign a little grade (e.g A,B,C,D,E) for each subject In some cases a single number (e.g 5,4,3,2,1) is used instead of a letter This system is concise, convenient, the marks are easily averaged and they are useful in predicting future achievement Limitations : - The student’s strengths and weaknesses in learning are not indicated - It is difficult to interpret and use a single letter grade
  • 8.
    Assigning Letter Grades Determining what to include in a grade Combining data in assigning grades Selecting the proper frame of reference for grading Determining the distribution of grades
  • 9.
    Pass-Fail System Atwo – category system (e.g. satisfactory – unsatisfactory, pass–fail) is used It is easy to use but it offers less information than the traditional A,B,C,D,F system It does not provides indication of the level of learning, i.e. present performance or predicting future performance Suitable to be used for courses using the mastery learning approach.
  • 10.
    Checklist of Objective A list of objectives are checked or rated For rating purposes, the traditional A,B,C,D,F system OR symbols like O (outstanding), S (satisfactory) and N (need improvement) can be used Advantage – provide a detailed analysis of the student’s strengths and weaknesses so that follow-up activities can be carried out to improve learning
  • 11.
    Letter to Parents/Guardians A flexible way of reporting student’s progress to parents The strengths, weaknesses, learning needs and to suggest specific plans for improvement can be reported Details to indicate clearly the student’s progress in all areas of development can be included Limitations : - requires time and skill in preparing comprehensive and thoughtful reports - descriptions of student’s learning weaknesses are easily misinterpreted by parents. - fail to provide a systematic and cumulative record of student progress.
  • 12.
    Parent-Teacher Conferences Toestablish better cooperation between teachers and parents A flexible procedure to provide a two-way communication between home and school Parents can provide information concerning students out-of- school life
  • 13.
    Parent-Teacher Conferences Permitsthe teacher and parents to ask question, to discuss common concerns in helping the student and to cooperatively plan a program for improving the student’s learning and development. Limitations - requires a lot of time and skill - does not provide a systematic record of student progress - some parents are unwilling or unable to come/attend
  • 14.
    Multiple Grading andReporting System Retain the use of traditional grading (letter grades or numbers) and supplements the grades with checklists of objectives. Two grades are assigned to each subject: one for achievement and the other for effort, improvement, or growth
  • 15.
    Guidelines for Developinga Multiple Grading and Reporting Systems Guided by the functions to be served. Developed cooperatively by parents, students, and school personnel. Based on a clear statement of educational objectives. Consistent with school standards. Based on adequate assessment. Detailed enough to be diagnostic and yet compact enough to be practical. Provide for parent-teacher conferences as needed.
  • 16.
    Record-Keeping and GradingSoftware Grade books have been a familiar part of teaching for many decades. Although any simple spreadsheet can be used as a grade book, there is a host of specialized software available that is specially designed to facilitate the common tasks of recording and combining grades.
  • 17.
    Measures Of CentralTendency A convenient way of summarizing data is to find a single index that can represent a whole set of measures. In statistics, the term "measures of central tendency" or “averages” is just a fancy name for mean, median and mode. The average can be this measure, known as the mean, or one of the other two measures of central tendency, known as the mode and median. Each of these can serve as an index to represent a group as a whole.
  • 18.
    Mean 1.Mean Themost widely used measure of central tendency is the mean. It is the sum of a set of data divided by the number of data. (the answer should not be rounded up unless directed to do so.) Example Sum of the Data 130 = 13 Number of Data 10
  • 19.
    Median The medianis defined as that point in a distribution of measures below which 50 percent of the cases lie. It is the middle value or the mean of the middle two values, when the data is arranged in numerical order. When there are an odd number of scores, the median is the middle score in the distribution. Example 5, 5, 10, 10, 10, 15, 15, 15, 20, 25 it has been found that organizing the data is the easiest way to find the median. The numbers 10 and 15 both fall in the middle. Thus, these two numbers have to averaged to get the median. Median = 10+15 = 12.5 2
  • 20.
    Mode The modeis the value in a distribution that occurs most frequently. It is the value (number) that appears the most. It is possible to have more than one mode, and it is possible to have no mode. If there is no mode, write "no mode", do not write zero (0). In the example above, two numbers appear the most often: 10 and 15. The table shows there are three 10's and three 15's. Thus, in this example, there are two answers for the mode.
  • 21.
    Measures Of Variability Variability refers to the "spread-out-ness" of scores in the distribution. The greater the difference between scores, the more spread out the distribution is. The more tightly the scores group together, the less variability there is in the distribution. One such measure of variability or spread is the range.
  • 22.
    Standard Deviation ScoreMean X - Mean (X - Mean)2 7 6 1 1 6 6 0 0 7 6 1 1 8 6 2 4 2 6 -4 16 Sum 30 0 22 Standard Deviation S2 (Variance) = [Σ (X-M)2]/(N – 1) S2 (Variance) = [Sum (X - M) 2]/(N – 1) S2 (Variance) = 22/ (5 – 1) S2 (Variance) = 5.5 S (Standard Deviation) = 2.35
  • 23.
    Conclusion A student’sscore is simply the number of items answered correctly. When all students answer every item on a test, the rank of the students’ scores will be the same whether the number is right or a correction for guessing is used.
  • 24.
    Summary Scoring Methods Grading Systems Measures of Central Tendency Measures of Variability
  • 25.
    Questions Which typeof scoring method that you prefer for the subject that you teach? Please justify with reasons. Which type of grading system that you used in your class? Please clarify with reasons.
  • 26.
    References  Linn,R. L., & Miller, M. D. (2005). Measurement and assessment in testing. International Edition. 9th Ed. New Jersey: Pearson Merrill Prentice Hall  Airasian, P.W. (2005). Classroom assessment: Concepts and applications. 5th Ed. Boston: McGrawHill.