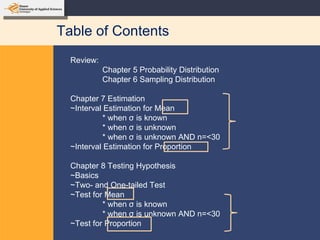
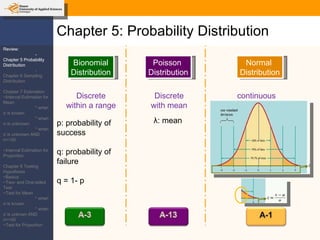
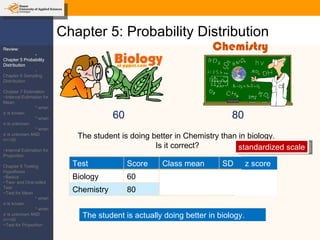
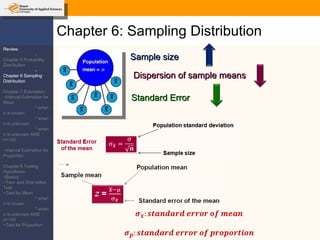
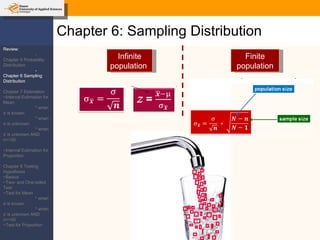
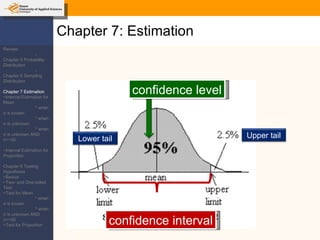
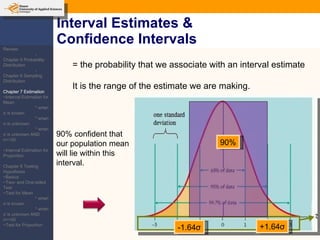
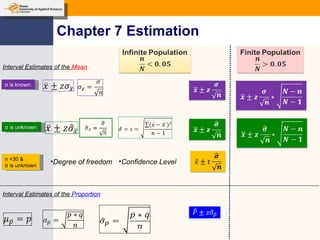
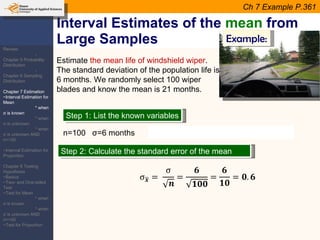
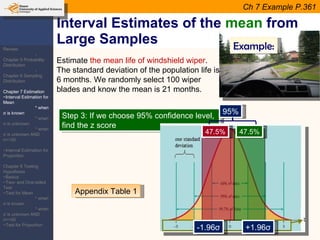
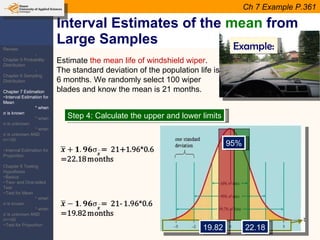
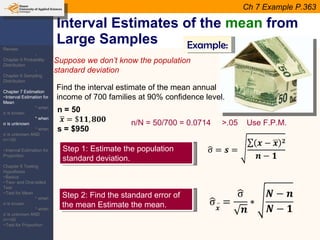
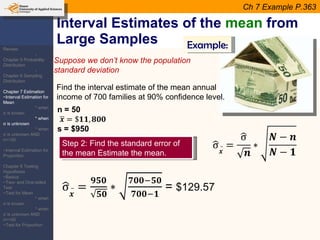
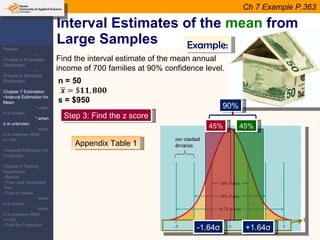
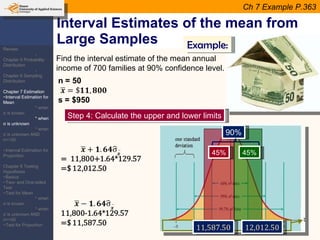
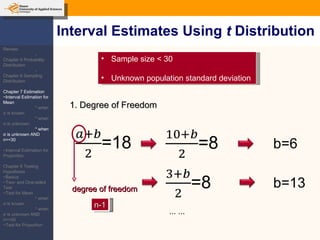
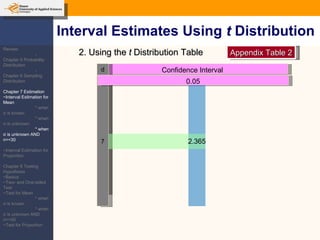
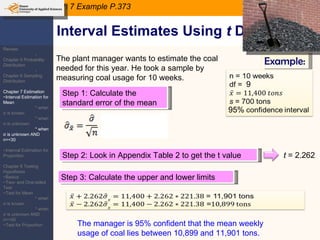
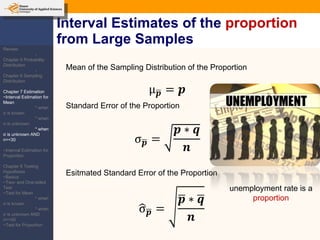
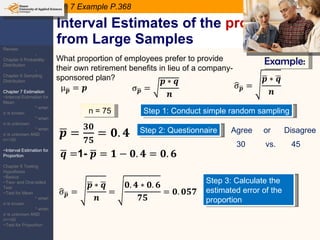
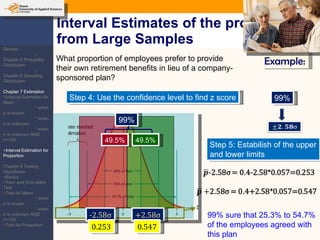
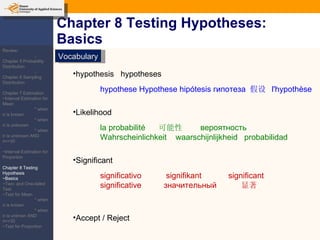
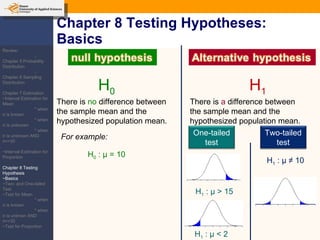
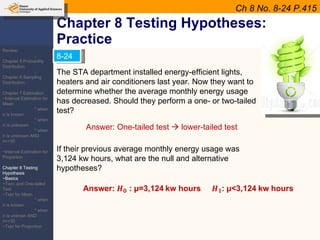
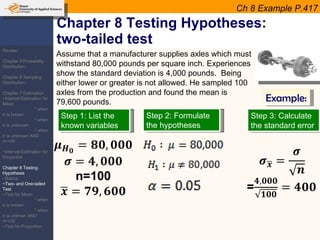
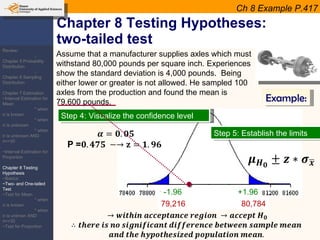
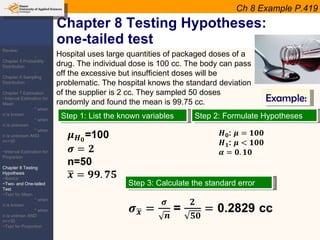
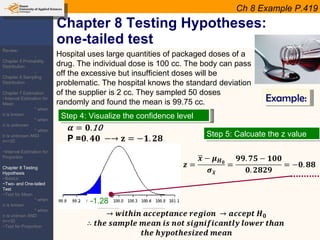
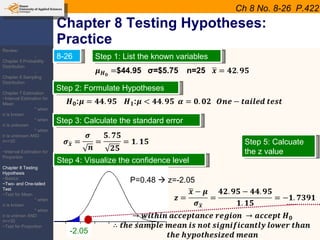
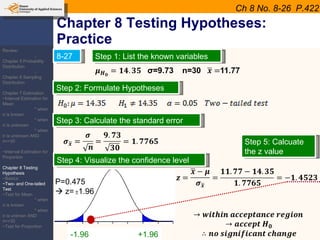
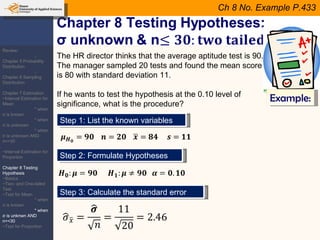
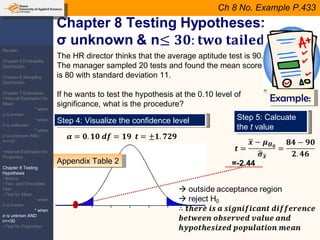
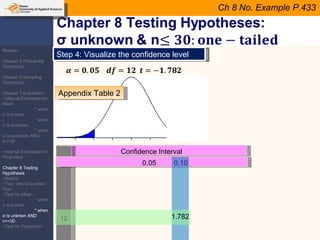
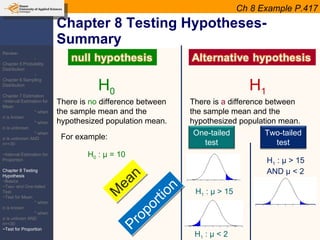
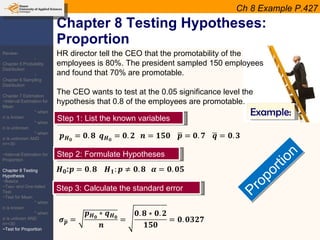
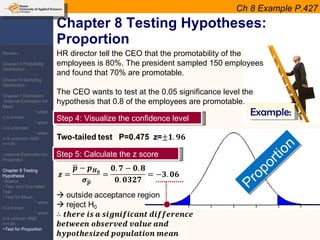
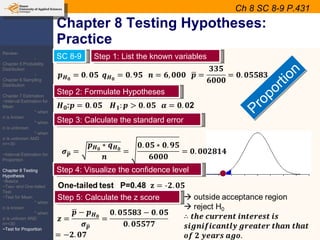
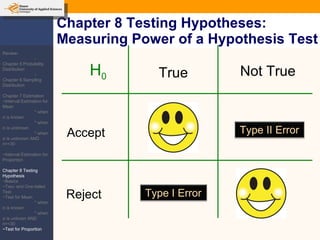
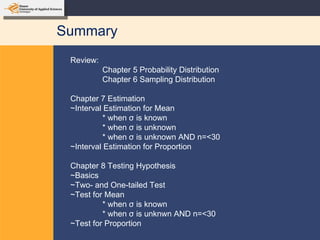
This document provides an outline and overview of topics covered in a course on inductive statistics, including probability distributions, sampling distributions, estimation, and hypothesis testing. Key topics discussed include interval estimation for means and proportions, using t-distributions when sample sizes are small and variances are unknown, and the basics of hypothesis testing such as null and alternative hypotheses. Examples are provided to illustrate concepts like confidence intervals for means, proportions, and hypothesis testing.
1. Inductive Statistics Dr. Ning DING [email_address] I.007 IBS, Hanze You’d better use the full-screen mode to view this PPT file.
2. Table of Contents Review: Chapter 5 Probability Distribution Chapter 6 Sampling Distribution Chapter 7 Estimation ~Interval Estimation for Mean * when σ is known * when σ is unknown * when σ is unknown AND n=<30 ~Interval Estimation for Proportion Chapter 8 Testing Hypothesis ~Basics ~Two- and One-tailed Test ~Test for Mean * when σ is known * when σ is unknown AND n=<30 ~Test for Proportion
3. Chapter 5: Probability Distribution Bionomial Distribution Poisson Distribution Discrete within a range Normal Distribution continuous Discrete with mean λ : mean p: probability of success q: probability of failure q = 1- p Review: -Chapter 5 Probability Distribution -Chapter 6 Sampling Distribution Chapter 7 Estimation ~Interval Estimation for Mean * when σ is known * when σ is unknown * when σ is unknown AND n=<30 ~Interval Estimation for Proportion Chapter 8 Testing Hypothesis ~Basics ~Two- and One-tailed Test ~Test for Mean * when σ is known * when σ is unknwn AND n=<30 ~Test for Proportion
4. 60 80 The student is doing better in Chemistry than in biology. Is it correct? The student is actually doing better in biology. Chapter 5: Probability Distribution Chemistry standardized scale Review: -Chapter 5 Probability Distribution -Chapter 6 Sampling Distribution Chapter 7 Estimation ~Interval Estimation for Mean * when σ is known * when σ is unknown * when σ is unknown AND n=<30 ~Interval Estimation for Proportion Chapter 8 Testing Hypothesis ~Basics ~Two- and One-tailed Test ~Test for Mean * when σ is known * when σ is unknown AND n=<30 ~Test for Proportion Test Score Class mean SD z score Biology 60 50 5 +2 Chemistry 80 90 10 -1
5. Chapter 6: Sampling Distribution Sample size Dispersion of sample means Standard Error Review: -Chapter 5 Probability Distribution -Chapter 6 Sampling Distribution Chapter 7 Estimation ~Interval Estimation for Mean * when σ is known * when σ is unknown * when σ is unknown AND n=<30 ~Interval Estimation for Proportion Chapter 8 Testing Hypothesis ~Basics ~Two- and One-tailed Test ~Test for Mean * when σ is known * when σ is unknown AND n=<30 ~Test for Proportion
6. Chapter 6: Sampling Distribution Infinite population Finite population Review: -Chapter 5 Probability Distribution -Chapter 6 Sampling Distribution Chapter 7 Estimation ~Interval Estimation for Mean * when σ is known * when σ is unknown * when σ is unknown AND n=<30 ~Interval Estimation for Proportion Chapter 8 Testing Hypothesis ~Basics ~Two- and One-tailed Test ~Test for Mean * when σ is known * when σ is unknown AND n=<30 ~Test for Proportion
7. Chapter 7: Estimation confidence level confidence interval Review: -Chapter 5 Probability Distribution -Chapter 6 Sampling Distribution Chapter 7 Estimation ~Interval Estimation for Mean * when σ is known * when σ is unknown * when σ is unknown AND n=<30 ~Interval Estimation for Proportion Chapter 8 Testing Hypothesis ~Basics ~Two- and One-tailed Test ~Test for Mean * when σ is known * when σ is unknown AND n=<30 ~Test for Proportion Upper tail Lower tail
8. Interval Estimates & Confidence Intervals = the probability that we associate with an interval estimate It is the range of the estimate we are making. -1.64 σ +1.64 σ 90% 90% confident that our population mean will lie within this interval. Review: -Chapter 5 Probability Distribution -Chapter 6 Sampling Distribution Chapter 7 Estimation ~Interval Estimation for Mean * when σ is known * when σ is unknown * when σ is unknown AND n=<30 ~Interval Estimation for Proportion Chapter 8 Testing Hypothesis ~Basics ~Two- and One-tailed Test ~Test for Mean * when σ is known * when σ is unknown AND n=<30 ~Test for Proportion
9.
10. Interval Estimates of the mean from Large Samples Estimate the mean life of windshield wiper . The standard deviation of the population life is 6 months. We randomly select 100 wiper blades and know the mean is 21 months. Example: Step 1: List the known variables Step 2: Calculate the standard error of the mean n=100 σ =6 months Ch 7 Example P.361 Review: -Chapter 5 Probability Distribution -Chapter 6 Sampling Distribution Chapter 7 Estimation ~Interval Estimation for Mean * when σ is known * when σ is unknown * when σ is unknown AND n=<30 ~Interval Estimation for Proportion Chapter 8 Testing Hypothesis ~Basics ~Two- and One-tailed Test ~Test for Mean * when σ is known * when σ is unknown AND n=<30 ~Test for Proportion
11. Interval Estimates of the mean from Large Samples Estimate the mean life of windshield wiper . The standard deviation of the population life is 6 months. We randomly select 100 wiper blades and know the mean is 21 months. Example: Step 3: If we choose 95% confidence level, find the z score -1.96 σ 95% +1.96 σ Appendix Table 1 47.5% 47.5% Ch 7 Example P.361 Review: -Chapter 5 Probability Distribution -Chapter 6 Sampling Distribution Chapter 7 Estimation ~Interval Estimation for Mean * when σ is known * when σ is unknown * when σ is unknown AND n=<30 ~Interval Estimation for Proportion Chapter 8 Testing Hypothesis ~Basics ~Two- and One-tailed Test ~Test for Mean * when σ is known * when σ is unknown AND n=<30 ~Test for Proportion
12. Interval Estimates of the mean from Large Samples Estimate the mean life of windshield wiper . The standard deviation of the population life is 6 months. We randomly select 100 wiper blades and know the mean is 21 months. Example: Step 4: Calculate the upper and lower limits 19.82 22.18 95% Ch 7 Example P.361 Review: -Chapter 5 Probability Distribution -Chapter 6 Sampling Distribution Chapter 7 Estimation ~Interval Estimation for Mean * when σ is known * when σ is unknown * when σ is unknown AND n=<30 ~Interval Estimation for Proportion Chapter 8 Testing Hypothesis ~Basics ~Two- and One-tailed Test ~Test for Mean * when σ is known * when σ is unknown AND n=<30 ~Test for Proportion
13. Interval Estimates of the mean from Large Samples Suppose we don’t know the population standard deviation Example: Find the interval estimate of the mean annual income of 700 families at 90% confidence level. Step 1: Estimate the population standard deviation. Step 2: Find the standard error of the mean Estimate the mean. Ch 7 Example P.363 n/N = 50/700 = 0.0714 >.05 Use F.P.M. Review: -Chapter 5 Probability Distribution -Chapter 6 Sampling Distribution Chapter 7 Estimation ~Interval Estimation for Mean * when σ is known * when σ is unknown * when σ is unknown AND n=<30 ~Interval Estimation for Proportion Chapter 8 Testing Hypothesis ~Basics ~Two- and One-tailed Test ~Test for Mean * when σ is known * when σ is unknown AND n=<30 ~Test for Proportion
14. Interval Estimates of the mean from Large Samples Suppose we don’t know the population standard deviation Example: Find the interval estimate of the mean annual income of 700 families at 90% confidence level. Step 2: Find the standard error of the mean Estimate the mean. Ch 7 Example P.363 Review: -Chapter 5 Probability Distribution -Chapter 6 Sampling Distribution Chapter 7 Estimation ~Interval Estimation for Mean * when σ is known * when σ is unknown * when σ is unknown AND n=<30 ~Interval Estimation for Proportion Chapter 8 Testing Hypothesis ~Basics ~Two- and One-tailed Test ~Test for Mean * when σ is known * when σ is unknown AND n=<30 ~Test for Proportion
15. Interval Estimates of the mean from Large Samples Step 3: Find the z score -1.64 σ +1.64 σ Appendix Table 1 Example: Find the interval estimate of the mean annual income of 700 families at 90% confidence level. 90% 45% 45% Ch 7 Example P.363 Review: -Chapter 5 Probability Distribution -Chapter 6 Sampling Distribution Chapter 7 Estimation ~Interval Estimation for Mean * when σ is known * when σ is unknown * when σ is unknown AND n=<30 ~Interval Estimation for Proportion Chapter 8 Testing Hypothesis ~Basics ~Two- and One-tailed Test ~Test for Mean * when σ is known * when σ is unknown AND n=<30 ~Test for Proportion
16. Interval Estimates of the mean from Large Samples 11,587.50 12,012.50 Example: Find the interval estimate of the mean annual income of 700 families at 90% confidence level. Step 4: Calculate the upper and lower limits 90% 45% 45% Ch 7 Example P.363 Review: -Chapter 5 Probability Distribution -Chapter 6 Sampling Distribution Chapter 7 Estimation ~Interval Estimation for Mean * when σ is known * when σ is unknown * when σ is unknown AND n=<30 ~Interval Estimation for Proportion Chapter 8 Testing Hypothesis ~Basics ~Two- and One-tailed Test ~Test for Mean * when σ is known * when σ is unknown AND n=<30 ~Test for Proportion
17.
18. Interval Estimates Using t Distribution 2. Using the t Distribution Table Appendix Table 2 Confidence Interval degree of f reedom 7 0.05 2.365 Review: -Chapter 5 Probability Distribution -Chapter 6 Sampling Distribution Chapter 7 Estimation ~Interval Estimation for Mean * when σ is known * when σ is unknown * when σ is unknown AND n=<30 ~Interval Estimation for Proportion Chapter 8 Testing Hypothesis ~Basics ~Two- and One-tailed Test ~Test for Mean * when σ is known * when σ is unknown AND n=<30 ~Test for Proportion
19. Interval Estimates Using t Distribution Example: The plant manager wants to estimate the coal needed for this year. He took a sample by measuring coal usage for 10 weeks. Step 1: Calculate the standard error of the mean 9 Step 2: Look in Appendix Table 2 to get the t value t = 2.262 95% Step 3: Calculate the upper and lower limits The manager is 95% confident that the mean weekly usage of coal lies between 10,899 and 11,901 tons. Ch 7 Example P.373 Review: -Chapter 5 Probability Distribution -Chapter 6 Sampling Distribution Chapter 7 Estimation ~Interval Estimation for Mean * when σ is known * when σ is unknown * when σ is unknown AND n=<30 ~Interval Estimation for Proportion Chapter 8 Testing Hypothesis ~Basics ~Two- and One-tailed Test ~Test for Mean * when σ is known * when σ is unknown AND n=<30 ~Test for Proportion
20. Interval Estimates of the proportion from Large Samples Mean of the Sampling Distribution of the Proportion Standard Error of the Proportion Esitmated Standard Error of the Proportion unemployment rate is a proportion Review: -Chapter 5 Probability Distribution -Chapter 6 Sampling Distribution Chapter 7 Estimation ~Interval Estimation for Mean * when σ is known * when σ is unknown * when σ is unknown AND n=<30 ~Interval Estimation for Proportion Chapter 8 Testing Hypothesis ~Basics ~Two- and One-tailed Test ~Test for Mean * when σ is known * when σ is unknown AND n=<30 ~Test for Proportion
21. Interval Estimates of the proportion from Large Samples Example: What proportion of employees prefer to provide their own retirement benefits in lieu of a company-sponsored plan? n = 75 Step 1: Conduct simple random sampling Step 2: Questionnaire Agree or Disagree 30 vs. 45 Step 3: Calculate the estimated error of the proportion Ch 7 Example P.368 Review: -Chapter 5 Probability Distribution -Chapter 6 Sampling Distribution Chapter 7 Estimation ~Interval Estimation for Mean * when σ is known * when σ is unknown * when σ is unknown AND n=<30 ~Interval Estimation for Proportion Chapter 8 Testing Hypothesis ~Basics ~Two- and One-tailed Test ~Test for Mean * when σ is known * when σ is unknown AND n=<30 ~Test for Proportion
22. Interval Estimates of the proportion from Large Samples Example: What proportion of employees prefer to provide their own retirement benefits in lieu of a company-sponsored plan? Step 4: Use the confidence level to find z score 99% -2.58 σ 99% 49.5% 49.5% +2.58 σ Step 5: Estabilish of the upper and lower limits 0.253 0.547 99% sure that 25.3% to 54.7% of the employees agreed with this plan Review: -Chapter 5 Probability Distribution -Chapter 6 Sampling Distribution Chapter 7 Estimation ~Interval Estimation for Mean * when σ is known * when σ is unknown * when σ is unknown AND n=<30 ~Interval Estimation for Proportion Chapter 8 Testing Hypothesis ~Basics ~Two- and One-tailed Test ~Test for Mean * when σ is known * when σ is unknown AND n=<30 ~Test for Proportion
23.
24. Chapter 8 Testing Hypotheses: Basics H 0 H 1 There is no difference between the sample mean and the hypothesized population mean. There is a difference between the sample mean and the hypothesized population mean. H 0 : µ = 10 H 1 : µ > 15 H 1 : µ < 2 H 1 : µ ≠ 10 For example: Review: -Chapter 5 Probability Distribution -Chapter 6 Sampling Distribution Chapter 7 Estimation ~Interval Estimation for Mean * when σ is known * when σ is unknown * when σ is unknown AND n=<30 ~Interval Estimation for Proportion Chapter 8 Testing Hypothesis ~Basics ~Two- and One-tailed Test ~Test for Mean * when σ is known * when σ is unknwn AND n=<30 ~Test for Proportion Two-tailed test One-tailed test
25. Chapter 8 Testing Hypotheses: Practice Ch 8 No. 8-24 P.415 The STA department installed energy-efficient lights, heaters and air conditioners last year. Now they want to determine whether the average monthly energy usage has decreased. Should they perform a one- or two-tailed test? If their previous average monthly energy usage was 3,124 kw hours, what are the null and alternative hypotheses? Answer: One-tailed test lower-tailed test 8-24 Review: -Chapter 5 Probability Distribution -Chapter 6 Sampling Distribution Chapter 7 Estimation ~Interval Estimation for Mean * when σ is known * when σ is unknown * when σ is unknown AND n=<30 ~Interval Estimation for Proportion Chapter 8 Testing Hypothesis ~Basics ~Two- and One-tailed Test ~Test for Mean * when σ is known * when σ is unknwn AND n=<30 ~Test for Proportion
26. Chapter 8 Testing Hypotheses: two-tailed test Ch 8 Example P.417 Assume that a manufacturer supplies axles which must withstand 80,000 pounds per square inch. Experiences show the standard deviation is 4,000 pounds. Being either lower or greater is not allowed. He sampled 100 axles from the production and found the mean is 79,600 pounds. Example: Step 1: List the known variables Step 2: Formulate the hypotheses Step 3: Calculate the standard error Review: -Chapter 5 Probability Distribution -Chapter 6 Sampling Distribution Chapter 7 Estimation ~Interval Estimation for Mean * when σ is known * when σ is unknown * when σ is unknown AND n=<30 ~Interval Estimation for Proportion Chapter 8 Testing Hypothesis ~Basics ~Two- and One-tailed Test ~Test for Mean * when σ is known * when σ is unknwn AND n=<30 ~Test for Proportion
27. Chapter 8 Testing Hypotheses: two-tailed test Ch 8 Example P.417 Assume that a manufacturer supplies axles which must withstand 80,000 pounds per square inch. Experiences show the standard deviation is 4,000 pounds. Being either lower or greater is not allowed. He sampled 100 axles from the production and found the mean is 79,600 pounds. Example: Step 4: Visualize the confidence level -1.96 +1.96 Step 5: Establish the limits 79,216 80,784 Review: -Chapter 5 Probability Distribution -Chapter 6 Sampling Distribution Chapter 7 Estimation ~Interval Estimation for Mean * when σ is known * when σ is unknown * when σ is unknown AND n=<30 ~Interval Estimation for Proportion Chapter 8 Testing Hypothesis ~Basics ~Two- and One-tailed Test ~Test for Mean * when σ is known * when σ is unknwn AND n=<30 ~Test for Proportion
28. Chapter 8 Testing Hypotheses: one-tailed test Ch 8 Example P.419 Hospital uses large quantities of packaged doses of a drug. The individual dose is 100 cc. The body can pass off the excessive but insufficient doses will be problematic. The hospital knows the standard deviation of the supplier is 2 cc. They sampled 50 doses randomly and found the mean is 99.75 cc. Example: Step 1: List the known variables Step 2: Formulate Hypotheses Step 3: Calculate the standard error Review: -Chapter 5 Probability Distribution -Chapter 6 Sampling Distribution Chapter 7 Estimation ~Interval Estimation for Mean * when σ is known * when σ is unknown * when σ is unknown AND n=<30 ~Interval Estimation for Proportion Chapter 8 Testing Hypothesis ~Basics ~Two- and One-tailed Test ~Test for Mean * when σ is known * when σ is unknwn AND n=<30 ~Test for Proportion
29. Chapter 8 Testing Hypotheses: one-tailed test Ch 8 Example P.419 Hospital uses large quantities of packaged doses of a drug. The individual dose is 100 cc. The body can pass off the excessive but insufficient doses will be problematic. The hospital knows the standard deviation of the supplier is 2 cc. They sampled 50 doses randomly and found the mean is 99.75 cc. Example: Step 4: Visualize the confidence level Step 5: Calcuate the z value -1.28 Review: -Chapter 5 Probability Distribution -Chapter 6 Sampling Distribution Chapter 7 Estimation ~Interval Estimation for Mean * when σ is known * when σ is unknown * when σ is unknown AND n=<30 ~Interval Estimation for Proportion Chapter 8 Testing Hypothesis ~Basics ~Two- and One-tailed Test ~Test for Mean * when σ is known * when σ is unknwn AND n=<30 ~Test for Proportion
30. Chapter 8 Testing Hypotheses: Practice Ch 8 No. 8-26 P.422 8-26 Step 1: List the known variables Step 2: Formulate Hypotheses Step 3: Calculate the standard error Step 4: Visualize the confidence level Step 5: Calcuate the z value P=0.48 z=-2.05 -2.05 Review: -Chapter 5 Probability Distribution -Chapter 6 Sampling Distribution Chapter 7 Estimation ~Interval Estimation for Mean * when σ is known * when σ is unknown * when σ is unknown AND n=<30 ~Interval Estimation for Proportion Chapter 8 Testing Hypothesis ~Basics ~Two- and One-tailed Test ~Test for Mean * when σ is known * when σ is unknwn AND n=<30 ~Test for Proportion
31. Chapter 8 Testing Hypotheses: Practice Ch 8 No. 8-26 P.422 8-27 Step 1: List the known variables Step 2: Formulate Hypotheses Step 3: Calculate the standard error Step 4: Visualize the confidence level Step 5: Calcuate the z value P=0.475 z= 1.96 -1.96 +1.96 Review: -Chapter 5 Probability Distribution -Chapter 6 Sampling Distribution Chapter 7 Estimation ~Interval Estimation for Mean * when σ is known * when σ is unknown * when σ is unknown AND n=<30 ~Interval Estimation for Proportion Chapter 8 Testing Hypothesis ~Basics ~Two- and One-tailed Test ~Test for Mean * when σ is known * when σ is unknwn AND n=<30 ~Test for Proportion
32. Ch 8 No. Example P.433 Example: Step 1: List the known variables Step 2: Formulate Hypotheses Step 3: Calculate the standard error The HR director thinks that the average aptitude test is 90. The manager sampled 20 tests and found the mean score is 80 with standard deviation 11. If he wants to test the hypothesis at the 0.10 level of significance, what is the procedure? Review: -Chapter 5 Probability Distribution -Chapter 6 Sampling Distribution Chapter 7 Estimation ~Interval Estimation for Mean * when σ is known * when σ is unknown * when σ is unknown AND n=<30 ~Interval Estimation for Proportion Chapter 8 Testing Hypothesis ~Basics ~Two- and One-tailed Test ~Test for Mean * when σ is known * when σ is unknwn AND n=<30 ~Test for Proportion
33. Ch 8 No. Example P.433 Example: Step 4: Visualize the confidence level Step 5: Calcuate the t value The HR director thinks that the average aptitude test is 90. The manager sampled 20 tests and found the mean score is 80 with standard deviation 11. If he wants to test the hypothesis at the 0.10 level of significance, what is the procedure? Appendix Table 2 Review: -Chapter 5 Probability Distribution -Chapter 6 Sampling Distribution Chapter 7 Estimation ~Interval Estimation for Mean * when σ is known * when σ is unknown * when σ is unknown AND n=<30 ~Interval Estimation for Proportion Chapter 8 Testing Hypothesis ~Basics ~Two- and One-tailed Test ~Test for Mean * when σ is known * when σ is unknwn AND n=<30 ~Test for Proportion
34. Ch 8 No. Example P.433 Step 4: Visualize the confidence level Appendix Table 2 Confidence Interval degree of f reedom 12 0.05 0.10 1.782 Review: -Chapter 5 Probability Distribution -Chapter 6 Sampling Distribution Chapter 7 Estimation ~Interval Estimation for Mean * when σ is known * when σ is unknown * when σ is unknown AND n=<30 ~Interval Estimation for Proportion Chapter 8 Testing Hypothesis ~Basics ~Two- and One-tailed Test ~Test for Mean * when σ is known * when σ is unknwn AND n=<30 ~Test for Proportion
35. Chapter 8 Testing Hypotheses-Summary Ch 8 Example P.417 H 0 H 1 There is no difference between the sample mean and the hypothesized population mean. There is a difference between the sample mean and the hypothesized population mean. H 0 : µ = 10 H 1 : µ > 15 H 1 : µ < 2 H 1 : µ > 15 AND µ < 2 For example: Mean Proportion Review: -Chapter 5 Probability Distribution -Chapter 6 Sampling Distribution Chapter 7 Estimation ~Interval Estimation for Mean * when σ is known * when σ is unknown * when σ is unknown AND n=<30 ~Interval Estimation for Proportion Chapter 8 Testing Hypothesis ~Basics ~Two- and One-tailed Test ~Test for Mean * when σ is known * when σ is unknwn AND n=<30 ~Test for Proportion Two-tailed test One-tailed test
36. Chapter 8 Testing Hypotheses: Proportion Ch 8 Example P.427 HR director tell the CEO that the promotability of the employees is 80%. The president sampled 150 employees and found that 70% are promotable. The CEO wants to test at the 0.05 significance level the hypothesis that 0.8 of the employees are promotable. Example: Step 1: List the known variables Step 2: Formulate Hypotheses Step 3: Calculate the standard error Proportion Review: -Chapter 5 Probability Distribution -Chapter 6 Sampling Distribution Chapter 7 Estimation ~Interval Estimation for Mean * when σ is known * when σ is unknown * when σ is unknown AND n=<30 ~Interval Estimation for Proportion Chapter 8 Testing Hypothesis ~Basics ~Two- and One-tailed Test ~Test for Mean * when σ is known * when σ is unknwn AND n=<30 ~Test for Proportion
37. Chapter 8 Testing Hypotheses: Proportion Ch 8 Example P.427 HR director tell the CEO that the promotability of the employees is 80%. The president sampled 150 employees and found that 70% are promotable. The CEO wants to test at the 0.05 significance level the hypothesis that 0.8 of the employees are promotable. Example: Step 4: Visualize the confidence level Step 5: Calculate the z score Proportion Review: -Chapter 5 Probability Distribution -Chapter 6 Sampling Distribution Chapter 7 Estimation ~Interval Estimation for Mean * when σ is known * when σ is unknown * when σ is unknown AND n=<30 ~Interval Estimation for Proportion Chapter 8 Testing Hypothesis ~Basics ~Two- and One-tailed Test ~Test for Mean * when σ is known * when σ is unknwn AND n=<30 ~Test for Proportion
38. Chapter 8 Testing Hypotheses: Practice Ch 8 SC 8-9 P.431 . Step 4: Visualize the confidence level Step 5: Calculate the z score Proportion Step 1: List the known variables Step 2: Formulate Hypotheses Step 3: Calculate the standard error SC 8-9 Review: -Chapter 5 Probability Distribution -Chapter 6 Sampling Distribution Chapter 7 Estimation ~Interval Estimation for Mean * when σ is known * when σ is unknown * when σ is unknown AND n=<30 ~Interval Estimation for Proportion Chapter 8 Testing Hypothesis ~Basics ~Two- and One-tailed Test ~Test for Mean * when σ is known * when σ is unknwn AND n=<30 ~Test for Proportion
39. Chapter 8 Testing Hypotheses: Measuring Power of a Hypothesis Test True Not True Accept Reject H 0 Review: -Chapter 5 Probability Distribution -Chapter 6 Sampling Distribution Chapter 7 Estimation ~Interval Estimation for Mean * when σ is known * when σ is unknown * when σ is unknown AND n=<30 ~Interval Estimation for Proportion Chapter 8 Testing Hypothesis ~Basics ~Two- and One-tailed Test ~Test for Mean * when σ is known * when σ is unknwn AND n=<30 ~Test for Proportion Type I Error Type II Error
40. Summary Review: Chapter 5 Probability Distribution Chapter 6 Sampling Distribution Chapter 7 Estimation ~Interval Estimation for Mean * when σ is known * when σ is unknown * when σ is unknown AND n=<30 ~Interval Estimation for Proportion Chapter 8 Testing Hypothesis ~Basics ~Two- and One-tailed Test ~Test for Mean * when σ is known * when σ is unknwn AND n=<30 ~Test for Proportion
43. The Normal Distribution SPSS 1st Assessment The data can be downloaded from: Blackboard – Inductive Statsitics STA2—SPSS-- Week 3 Creating Graphs.sav
Editor's Notes
Solution. If we let X denote the number of subscribers who qualify for favorable rates, then X is a binomial random variable with n = 10 and p = 0.70. And, if we let Y denote the number of subscribers who don't qualify for favorable rates, then Y , which equals 10 − X , is a binomial random variable with n = 10 and q = 1 − p = 0.30. We are interested in finding P ( X ≥ 4). We can't use the cumulative binomial tables, because they only go up to p = 0.50. The good news is that we can rewrite P ( X ≥ 4) as a probability statement in terms of Y : P ( X ≥ 4) = P (− X ≤ −4) = P (10 − X ≤ 10 − 4) = P ( Y ≤ 6) Now it's just a matter of looking up the probability in the right place on our cumulative binomial table. To find P ( Y ≤ 6), we: Find n = 10 in the first column on the left. Find the column containing p = 0.30 . Find the 6 in the second column on the left, since we want to find F (6) = P ( Y ≤ 6). Now, all we need to do is read the probability value where the p = 0.30 column and the ( n = 10, y = 6) row intersect. What do you get? Do you need a hint? The cumulative binomial probability table tells us that P ( Y ≤ 6) = P ( X ≥ 4) = 0.9894. That is, the probability that at least four people in a random sample of ten would qualify for favorable rates is 0.9894.