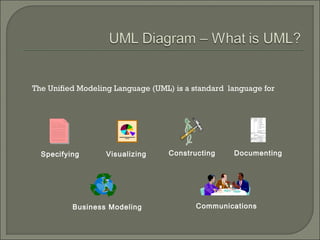
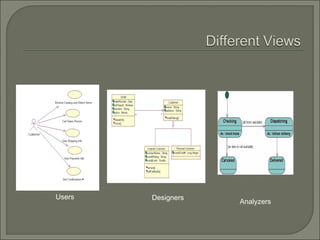
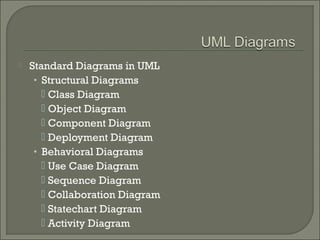
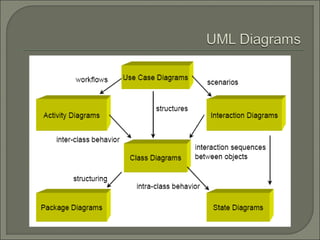
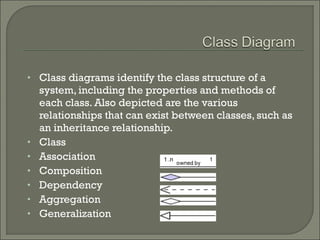
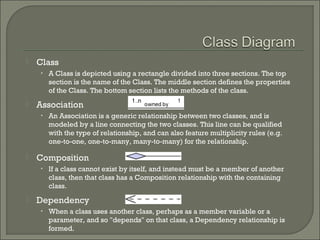
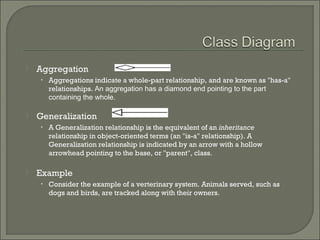
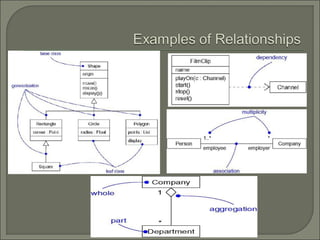
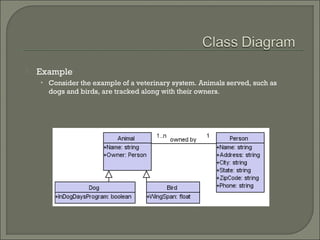
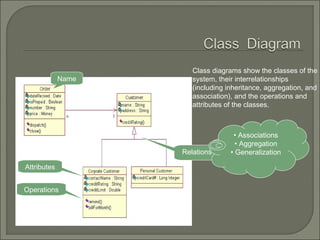
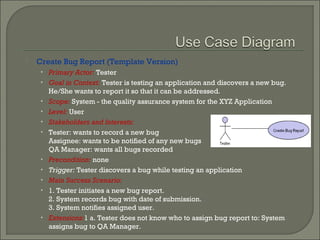
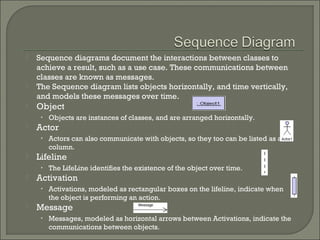
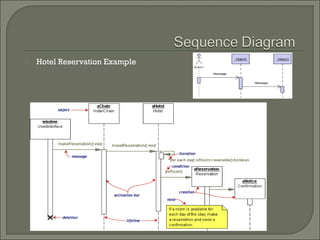
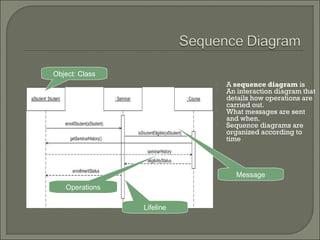
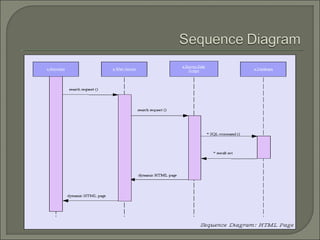
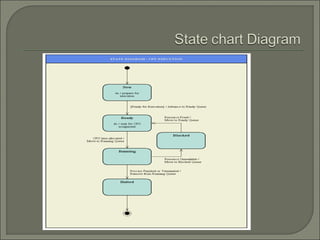
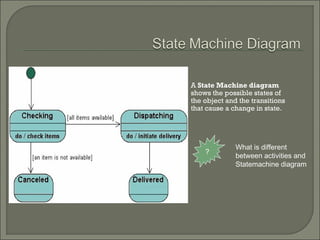
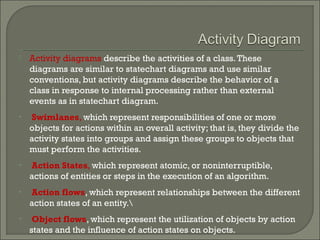
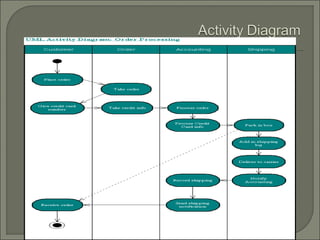
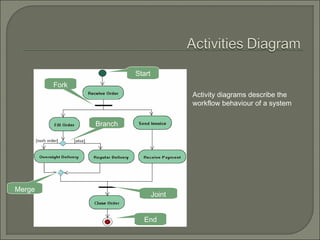
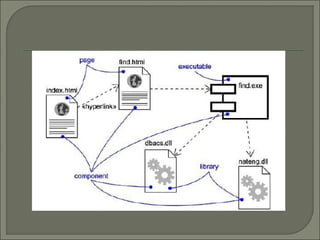
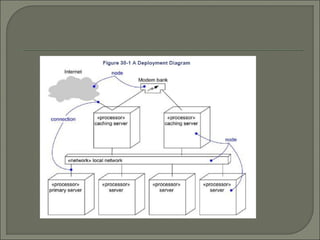
By:
Altaf Hussain
SS KRL
BS(CS), AU Peshawar, MS(CSE), NUST Islamabad
Modeling and documenting may often seem tedious
and boring but they are essential for helping to
reduce complexity and thus building better
software systems!
The Unified Modeling Language (UML) is a standard  language for
Specifying Visualizing Constructing Documenting
Business Modeling Communications
Users Designers
Analyzers
 Standard Diagrams in UML
• Structural Diagrams
 Class Diagram
 Object Diagram
 Component Diagram
 Deployment Diagram
• Behavioral Diagrams
 Use Case Diagram
 Sequence Diagram
 Collaboration Diagram
 Statechart Diagram
 Activity Diagram
• Class diagrams identify the class structure of a
system, including the properties and methods of
each class. Also depicted are the various
relationships that can exist between classes, such as
an inheritance relationship.
• Class
• Association
• Composition
• Dependency
• Aggregation
• Generalization
 Class
• A Class is depicted using a rectangle divided into three sections. The top
section is the name of the Class. The middle section defines the properties
of the Class. The bottom section lists the methods of the class.
 Association
• An Association is a generic relationship between two classes, and is
modeled by a line connecting the two classes. This line can be qualified
with the type of relationship, and can also feature multiplicity rules (e.g.
one-to-one, one-to-many, many-to-many) for the relationship.
 Composition
• If a class cannot exist by itself, and instead must be a member of another
class, then that class has a Composition relationship with the containing
class.
 Dependency
• When a class uses another class, perhaps as a member variable or a
parameter, and so "depends" on that class, a Dependency relationship is
formed.
 Aggregation
• Aggregations indicate a whole-part relationship, and are known as "has-a"
relationships. An aggregation has a diamond end pointing to the part
containing the whole.
 Generalization
• A Generalization relationship is the equivalent of an inheritance
relationship in object-oriented terms (an "is-a" relationship). A
Generalization relationship is indicated by an arrow with a hollow
arrowhead pointing to the base, or "parent", class.
 Example
• Consider the example of a verterinary system. Animals served, such as
dogs and birds, are tracked along with their owners.
 Example
• Consider the example of a veterinary system. Animals served, such as
dogs and birds, are tracked along with their owners.
Class diagrams show the classes of the
system, their interrelationships
(including inheritance, aggregation, and
association), and the operations and
attributes of the classes.
Name
Attributes
Operations
Relations
• Associations
• Aggregation
• Generalization
 A CRC card is an index card that is use to represent the
responsibilities of classes and the interaction between the
classes.
 The cards are created through scenarios, based on the system
requirements, that model the conceptual view of the system.
 Example
 Object diagrams model instances of classes. This type of
diagram is used to describe the system at a particular point in
time.
 Object
• Objects are identified by placing the instance name followed by a colon
(:) in front of the class name. Property values are written as "name=value"
pairs. The icon for an object is a rectangle divided into sections.
 Association
• Object diagrams can contain associations as well. Often, the constraints,
relationship details, and multiplicity rules found in the Class diagram are
left out to concentrate the diagram on the Objects and their properties.
 Example
• We'll consider the case of John, a pet lover from Boston, MA and
client of the veterinary hospital. He has two pets, Rover, a dog, and
Tweety, a bird.
 Use Case diagrams identify the functionality provided by the
system (use cases), the users who interact with the system
(actors), and the association between the users and the
functionality
 Use Cases are used in the Analysis phase of software development
to articulate the high-level requirements of the system.
 The primary goals of Use Case diagrams include:
Providing a high-level view of what the system does
Identifying the users ("actors") of the system
Determining areas needing human-computer interfaces
 Actor
• An Actor is a user of the system
 Use Case
• A Use Case is functionality provided by the system, typically described as
verb+object (eg. Register Car, Delete User).
 Association
• Associations are used to link Actors with Use Cases, and indicate that an
Actor participates in the Use Case in some form.
 Use Case Diagram: Graphical Notation
• A user placing an order with a sales company might follow these steps. 
 Use Case Diagram: Text Notation
 Create Bug Report (Paragraph Version)
• The Tester initiates a new bug report. The Tester indicates
the source of the bug, a description of the problem, and
the person to whom the bug should be assigned. The
System records the bug as an open issue, and notifies the
Assigned Person that a new bug has been submitted.
 Create Bug Report (Template Version)
• Primary Actor: Tester
• Goal in Context: Tester is testing an application and discovers a new bug.
He/She wants to report it so that it can be addressed.
• Scope: System - the quality assurance system for the XYZ Application
• Level: User
• Stakeholders and Interests:
• Tester: wants to record a new bug
Assignee: wants to be notified of any new bugs
QA Manager: wants all bugs recorded
• Precondition: none
• Trigger: Tester discovers a bug while testing an application
• Main Success Scenario:
• 1. Tester initiates a new bug report.
2. System records bug with date of submission.
3. System notifies assigned user.
• Extensions:1 a. Tester does not know who to assign bug report to: System
assigns bug to QA Manager.
 Sequence diagrams document the interactions between classes to
achieve a result, such as a use case. These communications between
classes are known as messages.
 The Sequence diagram lists objects horizontally, and time vertically,
and models these messages over time.
 Object
• Objects are instances of classes, and are arranged horizontally.
 Actor
• Actors can also communicate with objects, so they too can be listed as a
column.
 Lifeline
• The LifeLine identifies the existence of the object over time.
 Activation
• Activations, modeled as rectangular boxes on the lifeline, indicate when
the object is performing an action.
 Message
• Messages, modeled as horizontal arrows between Activations, indicate the
communications between objects.
 Hotel Reservation Example
 A sequence diagram is
 An interaction diagram that
details how operations are
carried out.
 What messages are sent
and when.
 Sequence diagrams are
organized according to
time
Object: Class
Lifeline
Operations
Message
 Collaboration Diagrams describe interactions among classes and
associations.These interactions are modeled as exchanges of
messages between classes through their associations.
Collaboration diagrams are a type of interaction diagram.
Collaboration diagrams contain the following elements.
• Class roles, which represent roles that objects may play within
the interaction.
• Association roles, which represent roles that links may play
within the interaction.
• Message flows, which represent messages sent between objects
via links. Links transport or implement the delivery of the
message.
 State chart (or state) diagrams describe the states and
responses of a class. Statechart diagrams describe the
behavior of a class in response to external stimuli.
These diagrams contain the following elements:
• States, which represent the situations during the life of
an object in which it satisfies some condition, performs
some activity, or waits for some occurrence.
• Transitions, which represent relationships between
the different states of an object.
A State Machine diagram
shows the possible states of
the object and the transitions
that cause a change in state.
?
What is different
between activities and
Statemachine diagram
 Activity diagrams describe the activities of a class.These
diagrams are similar to statechart diagrams and use similar
conventions, but activity diagrams describe the behavior of a
class in response to internal processing rather than external
events as in statechart diagram.
• Swimlanes, which represent responsibilities of one or more
objects for actions within an overall activity; that is, they divide the
activity states into groups and assign these groups to objects that
must perform the activities.
• Action States, which represent atomic, or noninterruptible,
actions of entities or steps in the execution of an algorithm.
• Action flows, which represent relationships between the different
action states of an entity.
• Object flows, which represent the utilization of objects by action
states and the influence of action states on objects.
Activity diagrams describe the
workflow behaviour of a system
Start
Fork
Branch
Merge
Joint
End
 Component diagrams describe the organization of and
dependencies among software implementation
components.These diagrams contain components,
which represent distributable physical units, including
source code, object code, and executable code.
 Deployment diagrams describe the configuration of
processing resource elements and the mapping of
software implementation components onto them.These
diagrams contain components and nodes, which
represent processing or computational resources,
including computers, printers, etc.
Lecture#03, uml diagrams

Lecture#03, uml diagrams

  • 1.
    By: Altaf Hussain SS KRL BS(CS),AU Peshawar, MS(CSE), NUST Islamabad
  • 2.
    Modeling and documentingmay often seem tedious and boring but they are essential for helping to reduce complexity and thus building better software systems!
  • 3.
    The Unified ModelingLanguage (UML) is a standard  language for Specifying Visualizing Constructing Documenting Business Modeling Communications
  • 4.
  • 5.
     Standard Diagramsin UML • Structural Diagrams  Class Diagram  Object Diagram  Component Diagram  Deployment Diagram • Behavioral Diagrams  Use Case Diagram  Sequence Diagram  Collaboration Diagram  Statechart Diagram  Activity Diagram
  • 7.
    • Class diagramsidentify the class structure of a system, including the properties and methods of each class. Also depicted are the various relationships that can exist between classes, such as an inheritance relationship. • Class • Association • Composition • Dependency • Aggregation • Generalization
  • 8.
     Class • AClass is depicted using a rectangle divided into three sections. The top section is the name of the Class. The middle section defines the properties of the Class. The bottom section lists the methods of the class.  Association • An Association is a generic relationship between two classes, and is modeled by a line connecting the two classes. This line can be qualified with the type of relationship, and can also feature multiplicity rules (e.g. one-to-one, one-to-many, many-to-many) for the relationship.  Composition • If a class cannot exist by itself, and instead must be a member of another class, then that class has a Composition relationship with the containing class.  Dependency • When a class uses another class, perhaps as a member variable or a parameter, and so "depends" on that class, a Dependency relationship is formed.
  • 9.
     Aggregation • Aggregationsindicate a whole-part relationship, and are known as "has-a" relationships. An aggregation has a diamond end pointing to the part containing the whole.  Generalization • A Generalization relationship is the equivalent of an inheritance relationship in object-oriented terms (an "is-a" relationship). A Generalization relationship is indicated by an arrow with a hollow arrowhead pointing to the base, or "parent", class.  Example • Consider the example of a verterinary system. Animals served, such as dogs and birds, are tracked along with their owners.
  • 11.
     Example • Considerthe example of a veterinary system. Animals served, such as dogs and birds, are tracked along with their owners.
  • 12.
    Class diagrams showthe classes of the system, their interrelationships (including inheritance, aggregation, and association), and the operations and attributes of the classes. Name Attributes Operations Relations • Associations • Aggregation • Generalization
  • 13.
     A CRCcard is an index card that is use to represent the responsibilities of classes and the interaction between the classes.  The cards are created through scenarios, based on the system requirements, that model the conceptual view of the system.
  • 14.
  • 15.
     Object diagramsmodel instances of classes. This type of diagram is used to describe the system at a particular point in time.  Object • Objects are identified by placing the instance name followed by a colon (:) in front of the class name. Property values are written as "name=value" pairs. The icon for an object is a rectangle divided into sections.  Association • Object diagrams can contain associations as well. Often, the constraints, relationship details, and multiplicity rules found in the Class diagram are left out to concentrate the diagram on the Objects and their properties.
  • 16.
     Example • We'llconsider the case of John, a pet lover from Boston, MA and client of the veterinary hospital. He has two pets, Rover, a dog, and Tweety, a bird.
  • 17.
     Use Casediagrams identify the functionality provided by the system (use cases), the users who interact with the system (actors), and the association between the users and the functionality  Use Cases are used in the Analysis phase of software development to articulate the high-level requirements of the system.  The primary goals of Use Case diagrams include: Providing a high-level view of what the system does Identifying the users ("actors") of the system Determining areas needing human-computer interfaces
  • 18.
     Actor • AnActor is a user of the system  Use Case • A Use Case is functionality provided by the system, typically described as verb+object (eg. Register Car, Delete User).  Association • Associations are used to link Actors with Use Cases, and indicate that an Actor participates in the Use Case in some form.
  • 19.
     Use CaseDiagram: Graphical Notation • A user placing an order with a sales company might follow these steps. 
  • 20.
     Use CaseDiagram: Text Notation  Create Bug Report (Paragraph Version) • The Tester initiates a new bug report. The Tester indicates the source of the bug, a description of the problem, and the person to whom the bug should be assigned. The System records the bug as an open issue, and notifies the Assigned Person that a new bug has been submitted.
  • 21.
     Create BugReport (Template Version) • Primary Actor: Tester • Goal in Context: Tester is testing an application and discovers a new bug. He/She wants to report it so that it can be addressed. • Scope: System - the quality assurance system for the XYZ Application • Level: User • Stakeholders and Interests: • Tester: wants to record a new bug Assignee: wants to be notified of any new bugs QA Manager: wants all bugs recorded • Precondition: none • Trigger: Tester discovers a bug while testing an application • Main Success Scenario: • 1. Tester initiates a new bug report. 2. System records bug with date of submission. 3. System notifies assigned user. • Extensions:1 a. Tester does not know who to assign bug report to: System assigns bug to QA Manager.
  • 22.
     Sequence diagramsdocument the interactions between classes to achieve a result, such as a use case. These communications between classes are known as messages.  The Sequence diagram lists objects horizontally, and time vertically, and models these messages over time.  Object • Objects are instances of classes, and are arranged horizontally.  Actor • Actors can also communicate with objects, so they too can be listed as a column.  Lifeline • The LifeLine identifies the existence of the object over time.  Activation • Activations, modeled as rectangular boxes on the lifeline, indicate when the object is performing an action.  Message • Messages, modeled as horizontal arrows between Activations, indicate the communications between objects.
  • 23.
  • 24.
     A sequencediagram is  An interaction diagram that details how operations are carried out.  What messages are sent and when.  Sequence diagrams are organized according to time Object: Class Lifeline Operations Message
  • 26.
     Collaboration Diagramsdescribe interactions among classes and associations.These interactions are modeled as exchanges of messages between classes through their associations. Collaboration diagrams are a type of interaction diagram. Collaboration diagrams contain the following elements. • Class roles, which represent roles that objects may play within the interaction. • Association roles, which represent roles that links may play within the interaction. • Message flows, which represent messages sent between objects via links. Links transport or implement the delivery of the message.
  • 28.
     State chart(or state) diagrams describe the states and responses of a class. Statechart diagrams describe the behavior of a class in response to external stimuli. These diagrams contain the following elements: • States, which represent the situations during the life of an object in which it satisfies some condition, performs some activity, or waits for some occurrence. • Transitions, which represent relationships between the different states of an object.
  • 30.
    A State Machinediagram shows the possible states of the object and the transitions that cause a change in state. ? What is different between activities and Statemachine diagram
  • 31.
     Activity diagramsdescribe the activities of a class.These diagrams are similar to statechart diagrams and use similar conventions, but activity diagrams describe the behavior of a class in response to internal processing rather than external events as in statechart diagram. • Swimlanes, which represent responsibilities of one or more objects for actions within an overall activity; that is, they divide the activity states into groups and assign these groups to objects that must perform the activities. • Action States, which represent atomic, or noninterruptible, actions of entities or steps in the execution of an algorithm. • Action flows, which represent relationships between the different action states of an entity. • Object flows, which represent the utilization of objects by action states and the influence of action states on objects.
  • 33.
    Activity diagrams describethe workflow behaviour of a system Start Fork Branch Merge Joint End
  • 34.
     Component diagramsdescribe the organization of and dependencies among software implementation components.These diagrams contain components, which represent distributable physical units, including source code, object code, and executable code.
  • 36.
     Deployment diagramsdescribe the configuration of processing resource elements and the mapping of software implementation components onto them.These diagrams contain components and nodes, which represent processing or computational resources, including computers, printers, etc.