Understanding Hazards:
Protecting OurWorld
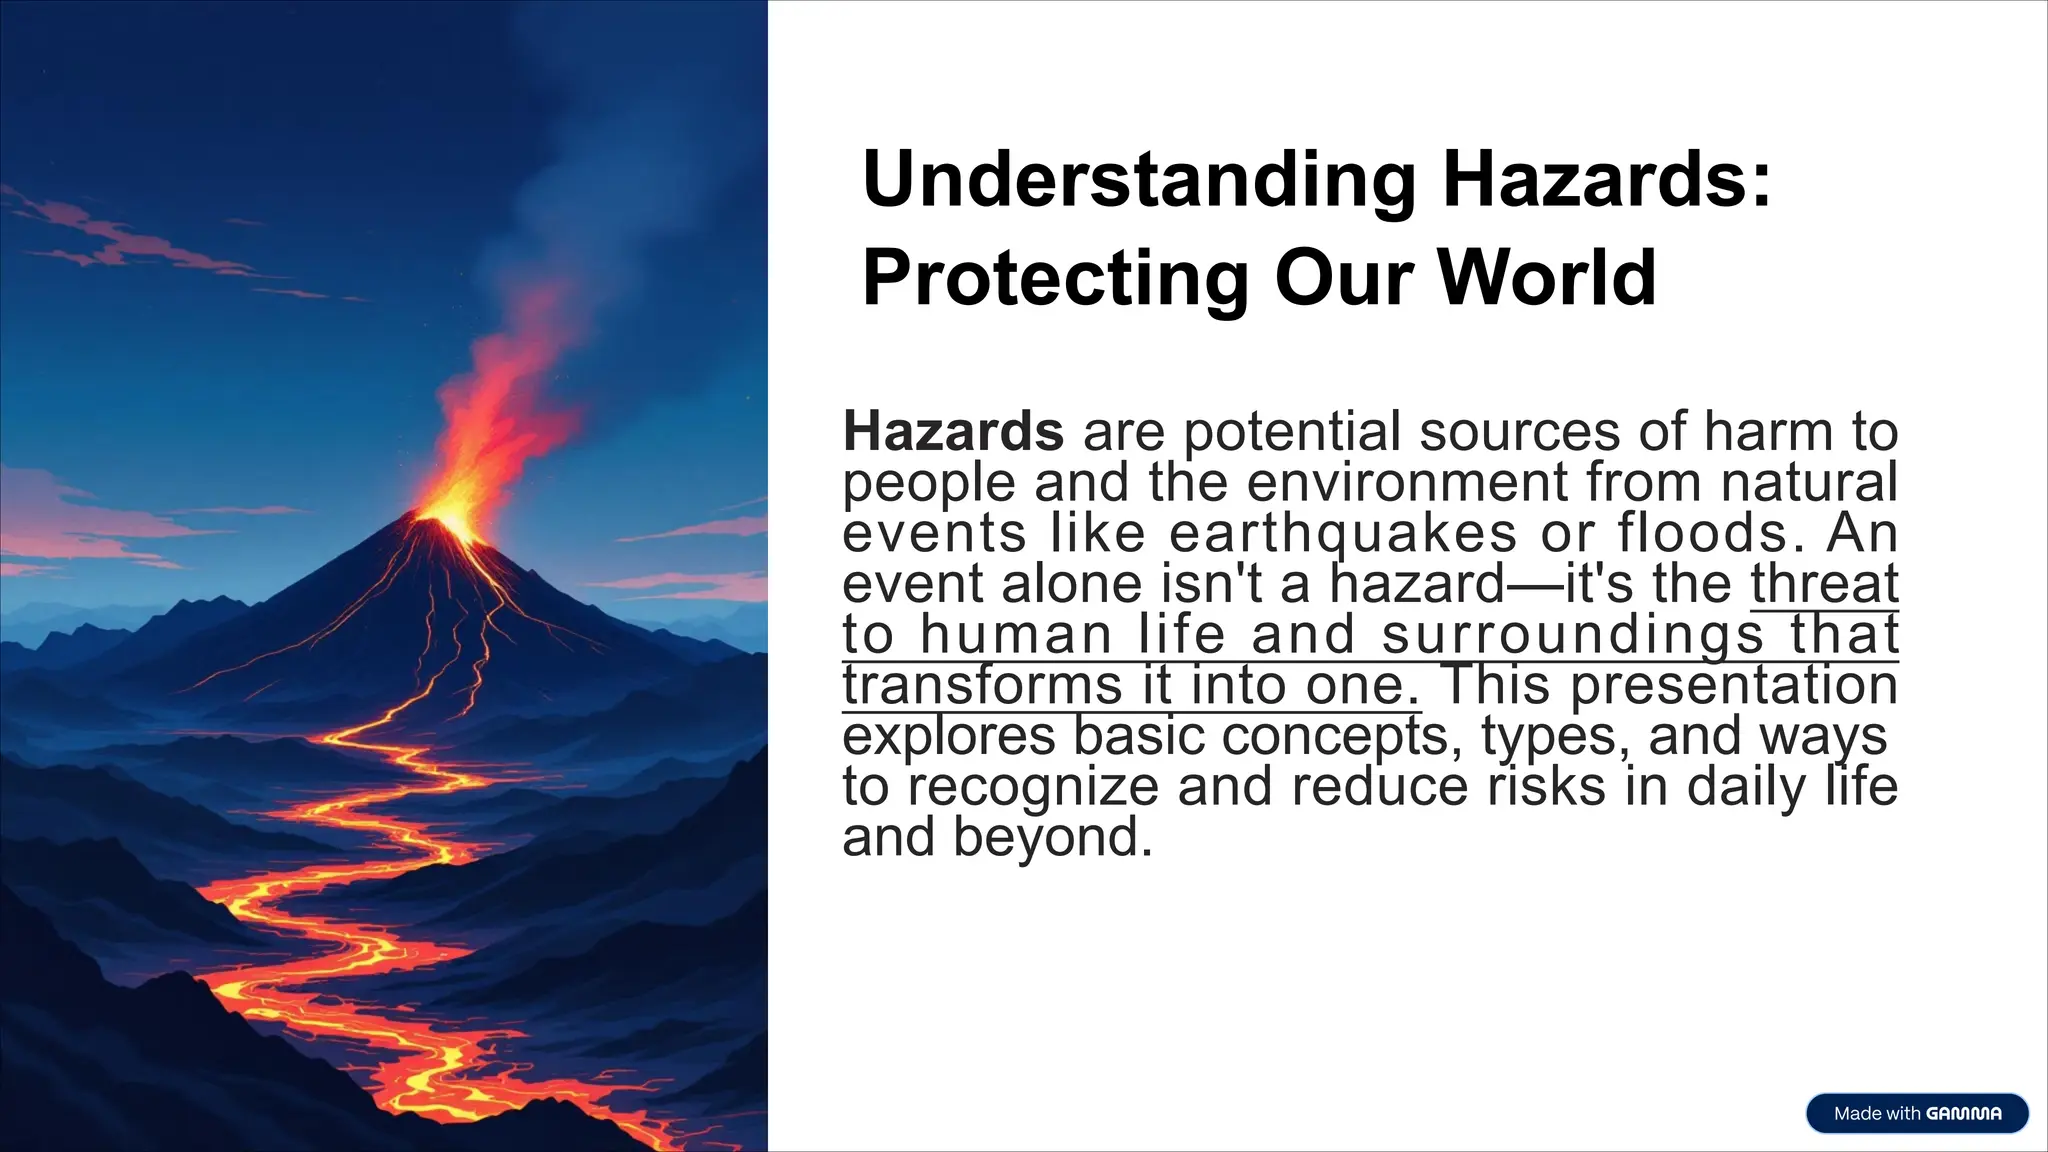
Hazards are potential sources of harm to
people and the environment from natural
events like earthquakes or floods. An
event alone isn't a hazard—it's the threat
to human life and surroundings that
transforms it into one. This presentation
explores basic concepts, types, and ways
to recognize and reduce risks in daily life
and beyond.
2.
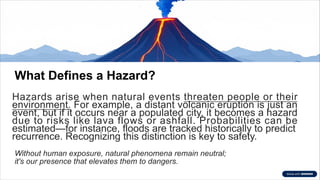
What Defines aHazard?
Hazards arise when natural events threaten people or their
environment. For example, a distant volcanic eruption is just an
event, but if it occurs near a populated city, it becomes a hazard
due to risks like lava flows or ashfall. Probabilities can be
estimated—for instance, floods are tracked historically to predict
recurrence. Recognizing this distinction is key to safety.
Without human exposure, natural phenomena remain neutral;
it's our presence that elevates them to dangers.
3.
Everyday Hazards WeOften
Ignore
Common hazards lurk in homes and schools:
tripping over cords, slipping on wet floors, or
faulty wiring. We often overlook them, delaying
fixes until "later." Yet, these small risks can lead
to injuries. Failing to spot them stems from
familiarity—always check your surroundings.
Start small: secure cords, clean spills, and
inspect wiring for standards compliance.
4.
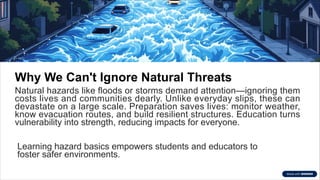
Why We Can'tIgnore Natural Threats
Natural hazards like floods or storms demand attention—ignoring them
costs lives and communities dearly. Unlike everyday slips, these can
devastate on a large scale. Preparation saves lives: monitor weather,
know evacuation routes, and build resilient structures. Education turns
vulnerability into strength, reducing impacts for everyone.
Learning hazard basics empowers students and educators to
foster safer environments.
5.
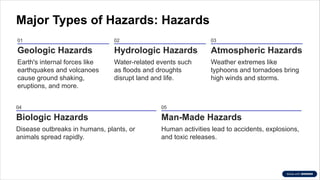
Major Types ofHazards: Hazards
01
Geologic Hazards
Earth's internal forces like
earthquakes and volcanoes
cause ground shaking,
eruptions, and more.
02
Hydrologic Hazards
Water-related events such
as floods and droughts
disrupt land and life.
03
Atmospheric Hazards
Weather extremes like
typhoons and tornadoes bring
high winds and storms.
04
Biologic Hazards
Disease outbreaks in humans, plants, or
animals spread rapidly.
05
Man-Made Hazards
Human activities lead to accidents, explosions,
and toxic releases.
6.
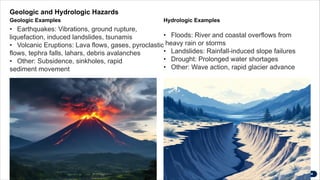
Geologic and HydrologicHazards
Geologic Examples
• Earthquakes: Vibrations, ground rupture,
liquefaction, induced landslides, tsunamis
• Volcanic Eruptions: Lava flows, gases, pyroclastic
flows, tephra falls, lahars, debris avalanches
• Other: Subsidence, sinkholes, rapid
sediment movement
Hydrologic Examples
• Floods: River and coastal overflows from
heavy rain or storms
• Landslides: Rainfall-induced slope failures
• Drought: Prolonged water shortages
• Other: Wave action, rapid glacier advance
7.
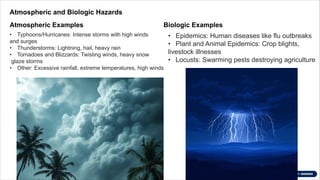
Atmospheric and BiologicHazards
Atmospheric Examples
• Typhoons/Hurricanes: Intense storms with high winds
and surges
• Thunderstorms: Lightning, hail, heavy rain
• Tornadoes and Blizzards: Twisting winds, heavy snow
glaze storms
• Other: Excessive rainfall, extreme temperatures, high winds
Biologic Examples
• Epidemics: Human diseases like flu outbreaks
• Plant and Animal Epidemics: Crop blights,
livestock illnesses
• Locusts: Swarming pests destroying agriculture
8.
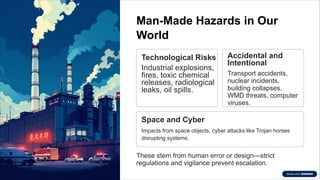
Man-Made Hazards inOur
World
Technological Risks
Industrial explosions,
fires, toxic chemical
releases, radiological
leaks, oil spills.
Accidental and
Intentional
Transport accidents,
nuclear incidents,
building collapses,
WMD threats, computer
viruses.
Space and Cyber
Impacts from space objects, cyber attacks like Trojan horses
disrupting systems.
These stem from human error or design—strict
regulations and vigilance prevent escalation.
9.
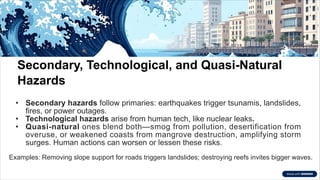
Secondary, Technological, andQuasi-Natural
Hazards
• Secondary hazards follow primaries: earthquakes trigger tsunamis, landslides,
fires, or power outages.
• Technological hazards arise from human tech, like nuclear leaks.
• Quasi-natural ones blend both—smog from pollution, desertification from
overuse, or weakened coasts from mangrove destruction, amplifying storm
surges. Human actions can worsen or lessen these risks.
Examples: Removing slope support for roads triggers landslides; destroying reefs invites bigger waves.
10.
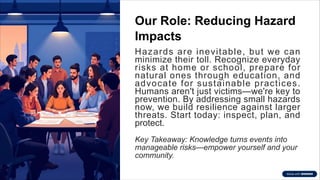
Our Role: ReducingHazard
Impacts
Hazards are inevitable, but we can
minimize their toll. Recognize everyday
risks at home or school, prepare for
natural ones through education, and
advocate for sustainable practices.
Humans aren't just victims—we're key to
prevention. By addressing small hazards
now, we build resilience against larger
threats. Start today: inspect, plan, and
protect.
Key Takeaway: Knowledge turns events into
manageable risks—empower yourself and your
community.
11.
CHARACTERISTICS OF HAZARD
ANDHAZARD PARAMETERS
1. Magnitude and Intensity
Magnitude – measures the strength or energy
of a hazard event (how strong or destructive it
is).
Example:
• Richter Scale – measures energy released
by earthquakes.
• VEI (Volcanic Explosivity Index) – measures
the explosiveness of volcanic eruptions.
12.
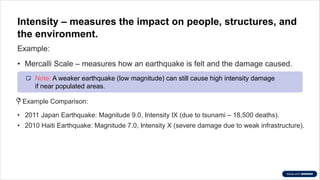
Intensity – measuresthe impact on people, structures, and
the environment.
Example:
• Mercalli Scale – measures how an earthquake is felt and the damage caused.
Note: A weaker earthquake (low magnitude) can still cause high intensity damage
if near populated areas.
�Example Comparison:
• 2011 Japan Earthquake: Magnitude 9.0, Intensity IX (due to tsunami – 18,500 deaths).
• 2010 Haiti Earthquake: Magnitude 7.0, Intensity X (severe damage due to weak infrastructure).
13.
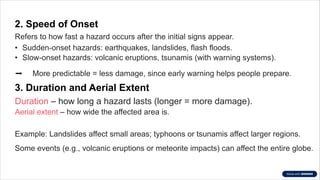
2. Speed ofOnset
Refers to how fast a hazard occurs after the initial signs appear.
• Sudden-onset hazards: earthquakes, landslides, flash floods.
• Slow-onset hazards: volcanic eruptions, tsunamis (with warning systems).
➡️More predictable = less damage, since early warning helps people prepare.
3. Duration and Aerial Extent
Duration – how long a hazard lasts (longer = more damage).
Aerial extent – how wide the affected area is.
Example: Landslides affect small areas; typhoons or tsunamis affect larger regions.
Some events (e.g., volcanic eruptions or meteorite impacts) can affect the entire globe.
14.
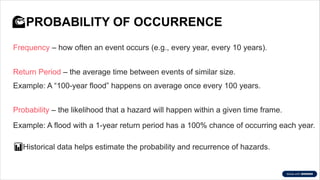
�PROBABILITY OF OCCURRENCE
Frequency– how often an event occurs (e.g., every year, every 10 years).
Return Period – the average time between events of similar size.
Example: A “100-year flood” happens on average once every 100 years.
Probability – the likelihood that a hazard will happen within a given time frame.
Example: A flood with a 1-year return period has a 100% chance of occurring each year.
�Historical data helps estimate the probability and recurrence of hazards.
15.
�
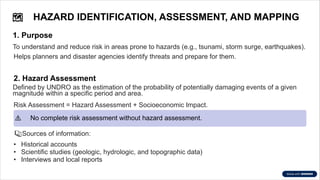
️HAZARD IDENTIFICATION, ASSESSMENT,AND MAPPING
1. Purpose
To understand and reduce risk in areas prone to hazards (e.g., tsunami, storm surge, earthquakes).
Helps planners and disaster agencies identify threats and prepare for them.
2. Hazard Assessment
Defined by UNDRO as the estimation of the probability of potentially damaging events of a given
magnitude within a specific period and area.
Risk Assessment = Hazard Assessment + Socioeconomic Impact.
⚠️No complete risk assessment without hazard assessment.
�Sources of information:
• Historical accounts
• Scientific studies (geologic, hydrologic, and topographic data)
• Interviews and local reports
16.
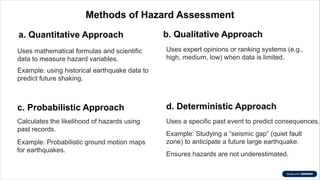
Methods of HazardAssessment
a. Quantitative Approach
Uses mathematical formulas and scientific
data to measure hazard variables.
Example: using historical earthquake data to
predict future shaking.
b. Qualitative Approach
Uses expert opinions or ranking systems (e.g.,
high, medium, low) when data is limited.
c. Probabilistic Approach
Calculates the likelihood of hazards using
past records.
Example: Probabilistic ground motion maps
for earthquakes.
d. Deterministic Approach
Uses a specific past event to predict consequences.
Example: Studying a “seismic gap” (quiet fault
zone) to anticipate a future large earthquake.
Ensures hazards are not underestimated.
17.
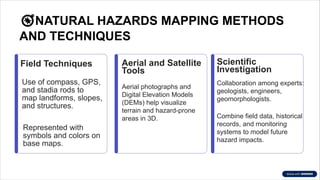
�NATURAL HAZARDS MAPPINGMETHODS
AND TECHNIQUES
Field Techniques
Use of compass, GPS,
and stadia rods to
map landforms, slopes,
and structures.
Represented with
symbols and colors on
base maps.
Aerial and Satellite
Tools
Aerial photographs and
Digital Elevation Models
(DEMs) help visualize
terrain and hazard-prone
areas in 3D.
Scientific
Investigation
Collaboration among experts:
geologists, engineers,
geomorphologists.
Combine field data, historical
records, and monitoring
systems to model future
hazard impacts.