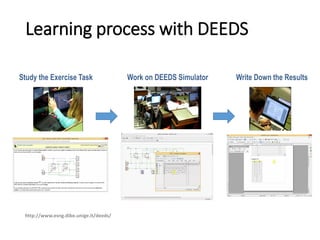
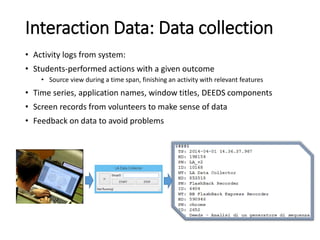
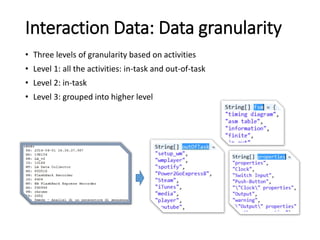
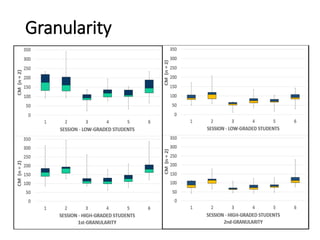
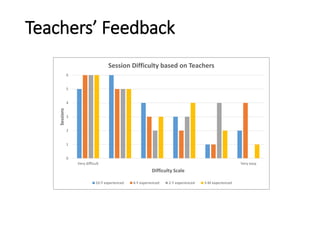
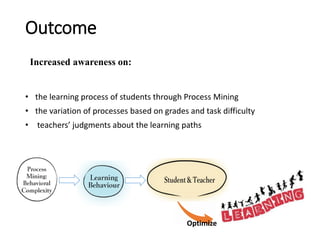
The document presents a learning analytics framework aimed at correlating students' academic achievements with their interaction data collected from an educational simulator called DEEDS. It details an experiment involving 225 BSc students to study learning behaviors, process mining methodologies, and the impact of task difficulty on learning paths. The results indicate variations in learning processes based on grades and highlight the importance of teachers' feedback in understanding students' learning experiences.

![Introduction:
Learning Analytics Process
In LA/ EDM process, data is collected and analyzed, and after post processing, feedback and
interventions are made in order to optimize learning (based on [1, 2, 16])](https://image.slidesharecdn.com/ectel2015-150922145821-lva1-app6891/85/A-Learning-Analytics-Approach-5-320.jpg)
![Introduction:
Context
• Our educational simulator: DEEDS
• Provides learning materials
• Stands for: Digital Electronics Education and Design Suite
• Is an interactive simulation environment for e-learning in digital
electronics [3]
• Asks to solve varied-level problems](https://image.slidesharecdn.com/ectel2015-150922145821-lva1-app6891/85/A-Learning-Analytics-Approach-6-320.jpg)
![Introduction:
Experiment
• On two sets of BSc students
• 125 students: for pilot (March to June 2014)
• 100 students: (October to December 2014)
• During the course of digital design at the University of Genoa:
• 6 laboratory sessions [15]](https://image.slidesharecdn.com/ectel2015-150922145821-lva1-app6891/85/A-Learning-Analytics-Approach-7-320.jpg)
![Process Mining
• Emerged from the business community
• To obtain valuable knowledge from a process
• To get better insight on the underlying educational processes [4, 5]
• Challenge: educational processes are very unordered and complex
• Solution: complexity metrics to measure the understandability of
process models
https://fluxicon.com/disco/](https://image.slidesharecdn.com/ectel2015-150922145821-lva1-app6891/85/A-Learning-Analytics-Approach-13-320.jpg)
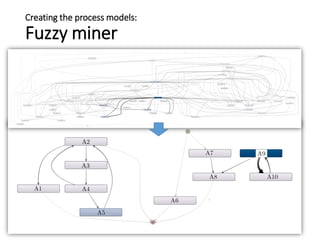
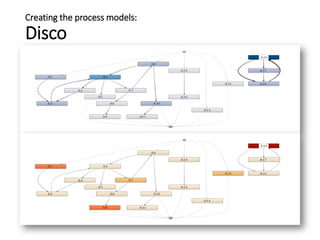
![Creating the process models:
Educational processes
• Educational processes are very unordered and complex
• Algorithm to obtain the process models: Fuzzy miner [6, 7]
• Events are unstructured, the process model is not known beforehand.
• Disco tool based on Fuzzy miner: discovering models through seamless
abstraction and generalization [8]
• Dealing with spaghetti-like processes](https://image.slidesharecdn.com/ectel2015-150922145821-lva1-app6891/85/A-Learning-Analytics-Approach-14-320.jpg)
![Process Mining:
Comparing the process models
• Process models help understand the processes, but understanding
complex models faces cognitive limits
• Complexity metrics measure understandability and maintainability of a
workflow net [9]
• Applied metric: Cyclomatic Complexity of McCabe (CM) [10]
• to measure the complexity of a control-flow graph of a program
Complexity of
Process Models](https://image.slidesharecdn.com/ectel2015-150922145821-lva1-app6891/85/A-Learning-Analytics-Approach-17-320.jpg)
![References
• [1] M. A. Chatti, A. L. Dyckhoff, U. Schroeder, and H. Thüs. A reference model for learning
analytics. International Journal of Technology Enhanced Learning, 4(5):318–331, 2012.
• [2] D. Clow. The learning analytics cycle: Closing the loop effectively. In International
Conference on Learning Analytics and Knowledge, 2012.
• [3] Donzellini, G., Ponta, D.: A simulation environment for e-learning in digital design. IEEE
Transactions on Industrial Electronics 54(6) (2007) 3078–3085
• [4] Trcka, N., Pechenizkiy, M., Van Der Aalst, W.: Process mining from educational data.
Chapman & Hall/CRC (2010)
• [5] Pechenizkiy, M., Trcka, N., Vasilyeva, E., Van Der Aalst, W., De Bra, P.: Process mining
online assessment data. In: International Working Group on Educational Data Mining.
(2009)
• [6] Günther, C.W., Van Der Aalst, W.M.P.: Fuzzy mining–adaptive process simplification
based on multi-perspective metrics. In: Business Process Management. (2007)
• [7] Van der Aalst, W., Weijters, T., Maruster, L.: Workflow mining: Discovering process
models from event logs. IEEE Transactions on Knowledge and Data Engineering 16(9)
(2004) 1128–1142
• [8] Van Der Aalst, W.M.: Tool support. In: Process Mining. (2011)
• [9] Gruhn, V., Laue, R.: Complexity metrics for business process models. In: International
conference on business information systems. (2006)](https://image.slidesharecdn.com/ectel2015-150922145821-lva1-app6891/85/A-Learning-Analytics-Approach-25-320.jpg)
![References
• [10] McCabe, T.J.: A complexity measure. IEEE Transactions on Software Engineering (4)
(1976) 308–320
• [11] C. Romero and S. Ventura. Educational data mining: A survey from 1995 to 2005.
Expert systems with applications, 33(1):135–146, 2007.
• [12] G. Siemens and P. Long. Penetrating the fog: Analytics in learning and education.
Educause Review, 46(5):30–32, 2011.
• [13] Drachsler, Hendrik, and Wolfgang Greller. "The pulse of learning analytics
understandings and expectations from the stakeholders." Proceedings of the 2nd
international conference on learning analytics and knowledge. ACM, 2012.
• [14] A. Pena-Ayala. Educational data mining: A survey and a data mining-based analysis of
recent works. Expert systems with applications, 41(4):1432–1462, 2014.
• [15] Vahdat, M., Oneto, L., Ghio, A., Donzellini, G., Anguita, D., Funk, M., Rauterberg, M.: A
learning analytics methodology to profile students behavior and explore interactions with
a digital electronics simulator. In: Open Learning and Teaching in Educational Communities.
(2014)
• [16] Vahdat, M., , Ghio, A., , Oneto, L., Anguita, D., Funk, M., Rauterberg, M.: Advances in
learning analytics and educational data mining. In: European Symposium on Artificial
Neural Networks, Computational Intelligence and Machine Learning. (2015)](https://image.slidesharecdn.com/ectel2015-150922145821-lva1-app6891/85/A-Learning-Analytics-Approach-26-320.jpg)