Downloaded 142 times

![Coming soon to a future near you?...
Analytics Report
Application from Ali Bloggs to study Z0001
This applicant has a high risk profile:
1. No academic study for last 15 years
2. Low socio-economic background
3. English as a second language
4. Weak ICT skills
5. His responses to the learning styles survey indicate a loner,
rather than a collaborative learner, known to be a
disadvantage on this course
[click to view the 3 other risk factors]
Without a Grade 3 tutor (advanced skills in 1-1 support), based
on the last 5 years data there is a 37% chance of dropping out
by Week 6.
[ACCEPT] [REJECT]
3](https://image.slidesharecdn.com/sociallearninganalytics-calrg2011-110614064029-phpapp02/85/Social-Learning-Analytics-3-320.jpg)

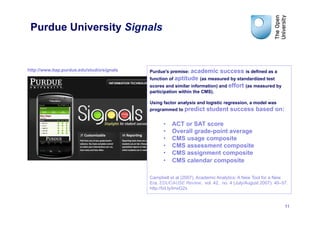
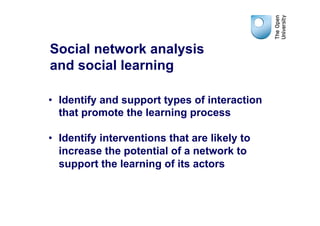


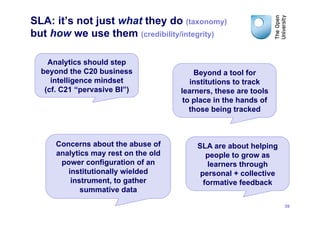

1) The document discusses social learning analytics, which examines how learners interact and engage in social learning networks, discourses, and contexts. 2) It presents a taxonomy of social learning analytics, including social network analysis, discourse analysis, content analysis, analysis of learning dispositions, and analysis of social learning contexts. 3) The discussion emphasizes that social learning analytics should not just track what learners do, but also how the data is used to provide formative feedback and help learners grow, moving beyond just institutional tracking of students.