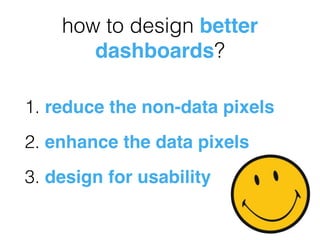
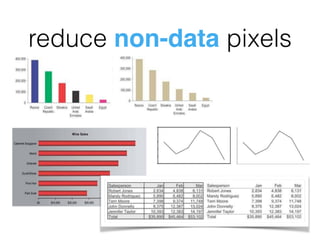
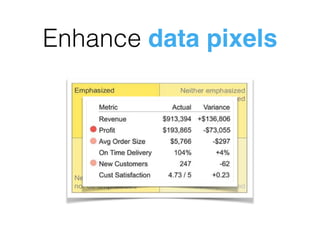
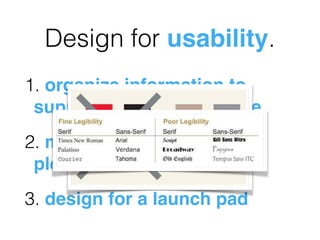
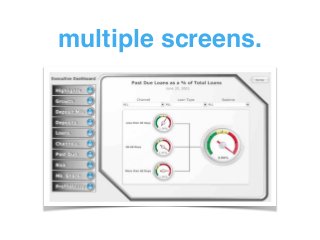
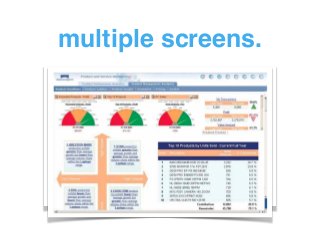
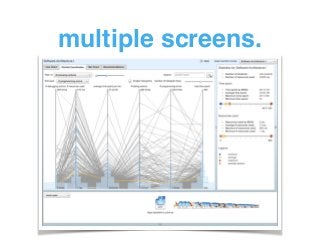
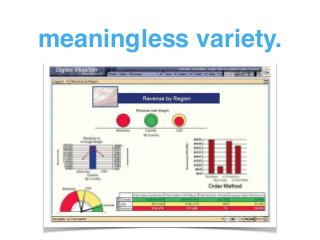
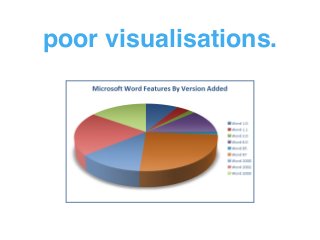
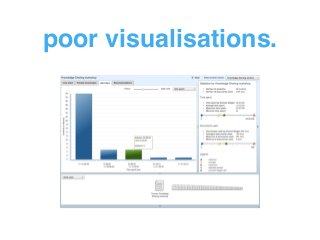
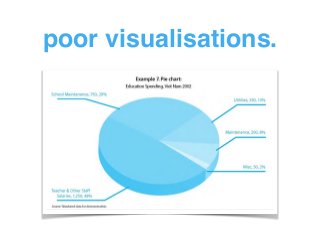
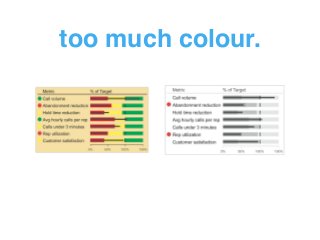
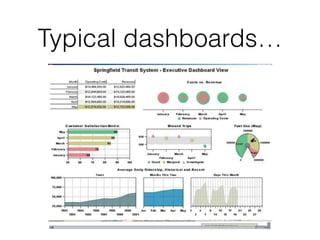
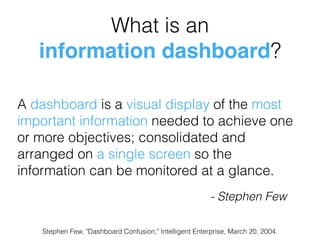
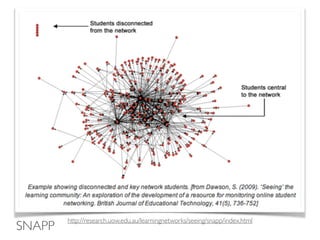
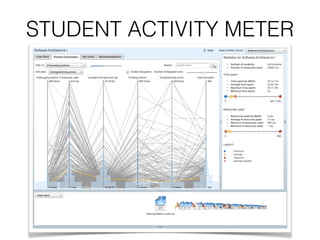
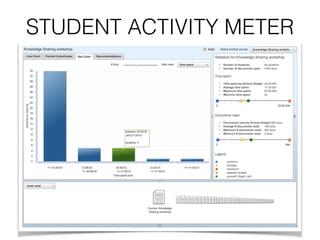
This document discusses learning analytics dashboards and how to design them effectively. It provides examples of existing learning analytics dashboards such as SNAPP, GISMO, and the Student Activity Meter. Common issues with dashboards are outlined, such as having too many screens, inadequate data context, and poor visualizations. The document recommends designing dashboards by reducing non-data elements, enhancing data visualization, and organizing information to support its intended meaning and use.


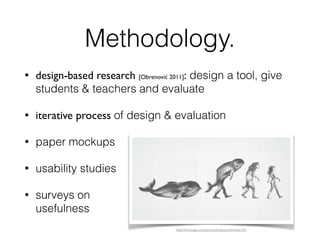


![Methodology.
• design-based research [Obrenović 2011]: design a tool, give
students & teachers and evaluate
• iterative process of design & evaluation
• paper mockups
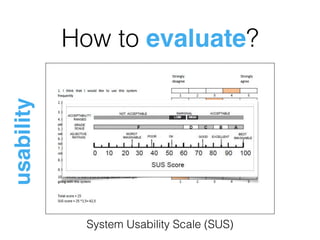
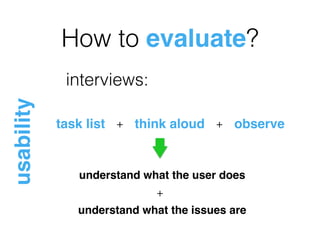
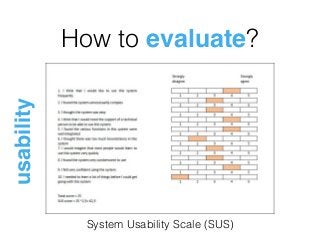
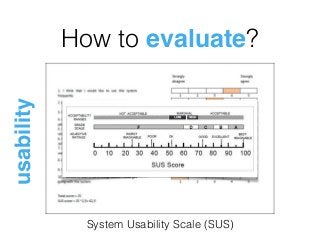
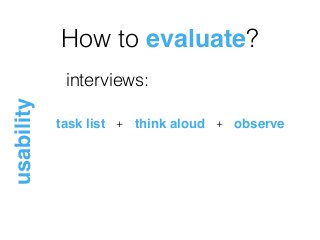
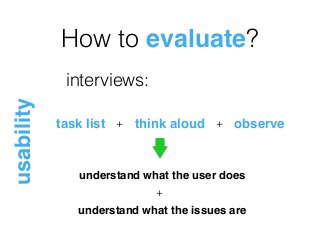
• usability studies
• surveys on
usefulness
http://funnytogo.com/pictures/evolution/timeline.htm](https://image.slidesharecdn.com/learning-analytics-dashboards-for-learning-analytics-day-at-kuleuven-140522093640-phpapp02/85/Learning-Analytics-Dashboards-49-320.jpg)